


The Best Interactive Sales Presentation Software to Close More Deals

Every year, leaders across departments, projects and entire organizations fight the same battle: creating a budget and getting it approved.
Crunching the numbers is the easy part. The real test is presenting them in a way that convinces decision-makers to back your plan or project.
The problem is, over half of executives in a McKinsey survey said they’re dissatisfied with the transparency of their organization’s budgets.
If your budget pitch falls flat, you won’t get the approval, allocation and resources you need.
That means you’ll spend the next operating period scrambling to hit targets with one hand tied behind your back.
That’s why I’ve laid out practical steps to help you create a budget presentation that gets approved. I’ll share real-life budget slide examples and templates to get you on the right track.
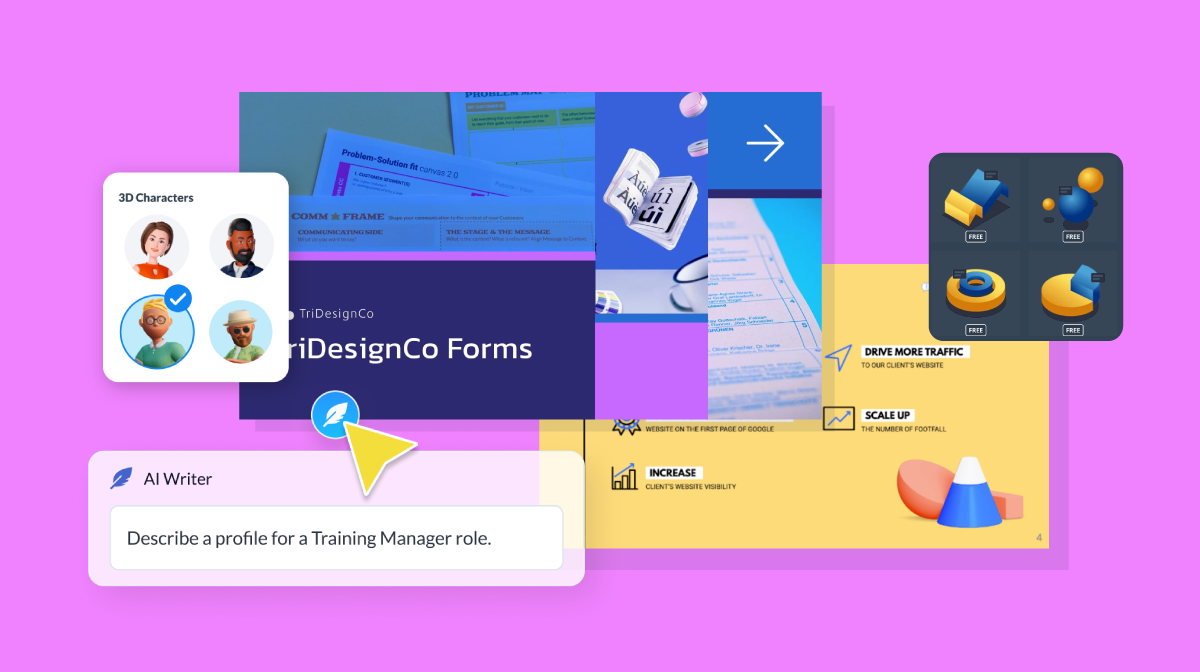
Before you dive in, watch this video to learn how to create a professional presentation in less than two minutes.
Knowing how to present a budget is an important skill any business or finance leaders should acquire. That’s your best chance of communicating your financial plans and goals in a way that stakeholders can act on.
A budget presentation provides a snapshot of your company’s financial goals, connects your spending with strategic priorities and justifies why resources are allocated as they are.
And if you get it right, everyone in the room sees the bigger picture, understands trade-offs and feels confident backing your plan.
Let’s break down the biggest benefits of a good budget presentation.
Budgets can be intimidating when presented as spreadsheets.
A solid budget presentation takes those numbers and translates them into visuals and plain language that anyone in the room can understand.
For example, instead of showing rows of revenue and expense data, a chart that compares current spending to projected revenue. At a glance, your leadership team can see if the business is on track or under pressure.
Numbers by themselves don’t move an executive team. What matters is how they impact the company’s future trajectory.
When you tie budget allocations to strategic plans or expected outcomes such as expanding into new markets or doubling down on R&D, Stakeholders will understand exactly why money is being directed where it is.
For instance, a marketing director might feel reassured when they see how an increase in ad spend links directly to the company’s growth targets for the next quarter. This alignment creates momentum and ensures resources aren’t scattered across competing priorities.
Not all stakeholders view budgets through the same lens. Investors want to see profitability, risk management and long-term returns. Executives want to understand how resources map to KPIs.
Employees are concerned about their future and job security. A strong budget slide presentation addresses these perspectives upfront.
For example, including a slide on how cost-saving measures won’t threaten jobs can help reassure staff. Similarly, outlining risk buffers demonstrates to investors that the business is financially resilient. Being able to tailor your executive presentation helps you get solid backing.
Budgeting often comes down to trade-offs. And a winning presentation gives decision-makers the tools to evaluate those choices and act fast.
Instead of endless debates over spreadsheets, a slide comparing the ROI of two potential investments—say, launching a new product line versus expanding an existing one—helps executives make an informed decision quickly.
When you present KPIs like profit margins, revenue growth or market share visually, you give your audience the context they need to weigh risks and opportunities.
A well-crafted budget presentation sets benchmarks that make it easier to track progress and hold teams accountable.
For example, if the finance team commits to cutting overhead by 10% in six months, that target can be tracked against monthly performance dashboards. Similarly, showing department-level spending plans with assigned leads makes it clear who is responsible for what. This level of accountability prevents finger-pointing later and keeps everyone working toward the same outcomes.
A budget presentation isn’t a one-size-fits-all document.
The core elements, such as revenue, expenses and projections, remain the same.
But how you present them depends on who’s in the room and what decision you want them to make.
With that in mind, here are the key sections every budget proposal presentation should include, plus the angle you might take depending on your audience:
Made with Visme Infographic Maker
A solid budget pitch deck doesn’t start the moment you walk into the room.
It starts 48–72 hours earlier, when you’re tightening slides, checking numbers and plugging gaps.
Because here’s the truth. If your deck is sloppy, confusing, or riddled with holes, it won’t get approved.
That’s why a checklist is so important. It forces you to slow down, double-check the details and make sure nothing critical slips through the cracks.
Use this checklist right before you finalize your slides or walk into the boardroom presentation.
Print it out. Go through every single item. If you can tick every box, you’ll walk in confident knowing your budget deck is solid.
Made with Visme
Follow the steps to create an effective budget presentation that wins your audience over.
Start by pulling the numbers that actually matter: revenue, expenses, cash flow, forecasts and key variances.
But don’t just grab everything you can find; be intentional. Of course, the data you need will depend on:
For the C-suite or corporate/strategic budget, don’t waste time with department-level line items. Show the financial levers that move strategy: margin expansion, cost of capital, liquidity and the impact on earnings per share.
Tie budget requests directly to strategic goals like growth, efficiency, or risk management. For example, instead of showing “marketing spend,” show how that spend affects pipeline contribution and CAC-to-LTV ratios over time.
For a departmental budget review (marketing, IT, HR or operations), you’ll want to zoom into the details. This means you won't just visualize total operating expenses.
Break them down into controllable vs. uncontrollable costs. Highlight variances against forecast at the cost-center level and give department heads clear visibility into what they can act on immediately.
For investors, focus on forward-looking metrics. Show them the sensitivity analysis behind your financial projections—best case, worst case and most likely. ROI, payback period and risk mitigation strategies should dominate this conversation.
If you can, add benchmark comparisons: how your gross margins, burn rate or capital allocation stack up against peers.
Here’s the part most people skip. Gather it from reliable sources.
Experienced Cost Specialist and Finance expert, Ime Umoh, recommends referencing your data source when presenting figures.
“When I’m discussing inflation forecasts during my budget presentation, I reference where I sourced the data, whether from Reuters, FSDH, Bloomberg, IMF, World Bank or another authority. Similarly, when discussing HR budgets, I reference documents like third-party contracts, employee headcount reports, payroll records, and vendor invoices. That way, if anyone challenges the numbers, I can immediately point to the source and defend my analysis.” - Ime Umoh, Management Accounting at Nestle Nigeria Plc.
Verify it and analyze it until you’re confident you can stand behind it when questions come. You don’t want one error—or worse, an unexplained variance—to damage your credibility.
Bottom line: If a figure doesn’t help the audience understand the story or make a decision, it doesn’t belong in your deck. Nobody cares about a 20-line breakdown of office supplies. But they will care about how operating costs shifted quarter-over-quarter, or why one expense category is eating into margins (and what you’re doing about it).
Numbers on their own are meaningless without context.
The way you organize and frame your budget is what turns a pile of data into something leaders can actually use to make decisions.
Start by grouping your information into buckets: current performance, resource allocation, priorities and projections. This simple structure makes it easy for stakeholders to follow without needing to flip your slides back and forth.
Just as important: offer a balanced perspective. Share the wins, but also acknowledge the weak spots and how you plan to fix them. Transparency builds credibility and hiding flaws only erodes trust.
Instead, highlight shortcomings. Then walk your audience through the steps you’re taking to fix it.
Comparing your results to those of your peers or benchmarks can also make your story stronger and grounded in reality. Even if there’s proof your competitors are ahead, you can frame the gap as an opportunity that can be closed with fund injections.
And don’t forget, your story has to be non-fiction. If your claims aren’t backed by real data, your audience will spot it. Be prepared for tough questions and back up your points with evidence. If you don’t know the answer at that moment, say so and commit to following up.
I’ve broken down storytelling frameworks you can use in my guide on financial presentations: Here's a sneak peek:
This is where the story you’ve crafted has to come alive visually.
Most budget decks fall flat because they’re built in PowerPoint like we’re still in the 2000s.
Ten fonts, crowded tables and slides so dense they could double as a spreadsheet.
If you want to influence decisions at the highest level, your slides have to do the selling for you.
A good rule of thumb: if someone took your deck into a meeting without you, would it still make sense? If the answer is no, refine it until it does.
I get it; handling all the different aspects of slide design manually can be nerve-wracking.
That’s why I recommend starting with professionally designed finance presentation templates.
Visme has plenty of it and we’ll get into that below. A solid template gives you a framework to begin with.
Instead of obsessing over the best fonts, visuals and the right presentation layouts, you can spend more time prepping your delivery.
In my article about financial presentations, I mentioned they have a reputation for being boring. Budget slides are no exception.
I’ve sat through countless slide decks with dense spreadsheets, generic charts and numbers that I can’t even remember after the fifth slide.
The solution is making your presentation interactive. That’s the edge you need.
Build interactivity into your budget deck itself. More than 60% of presenters rely on interactive elements to make their decks dynamic and memorable.
Instead of dozens of static slides, focus on the insights that really matter. Here’s how:
And don’t just stop at the deck. The session itself needs to be interactive. Ask sharp questions, run a poll, or pause for discussion when you reveal a major shift in costs or forecasts. (More on this below).
The bottom line? When people feel involved in the conversation, they start owning the decisions. And that’s exactly how you get everyone on the same page.
Visme makes interactive data visualization ridiculously easy. You can easily:
Read our complete guide on how to create interactive data visualizations. We’ve also included real-life examples, techniques and tools to make your data look fascinating.
A budget deck without a request or decision is just a financial update. Your job is to move people toward a roadmap or decision.
And that means your last slide must do two things:
Spell it out. Do you need approval for the full budget? Are you asking for sign-off on a specific allocation? Or is this about aligning leadership on priorities before you finalize numbers?
Put the decision front and center. Then, show the sequence of what happens after the decision. For example:
Tie each decision to the activities that should follow. If follow-ups are needed, assign owners and deadlines right there in the slide.
This signals urgency and keeps momentum moving after you walk out of the room.
Executives don’t want a tour of your spreadsheets. They want to know two things right away: What do we need? And how does this budget proposal deliver it?
Your executive summary should tie your request directly to company goals. If the board’s priority is margin expansion, growth acceleration or risk reduction, show how your budget does exactly that. Keep it high-level and provide details when needed.
Don’t present your ask as the only path forward. Show leadership the options on the table and the trade-offs for each.
For example:
Use visuals that make tradeoffs, ROI, timelines and risks crystal clear. This makes the decision less about trust in your gut and more about clarity in the data.
Tie budget requests directly to business impact. If the budget is approved, what’s the upside? If it isn’t, what’s the risk?
For example, say something like, “If we get this funding, we can speed up our expansion into the X market. If we pass on this, our competitors will grab the market share that we'll struggle to reclaim in 2025.”
That contrast creates urgency and forces decision-makers to see the budget as a lever for getting results.
Learning from real-world budget presentation examples is like getting insider coaching.
Instead of guessing what works, you get to see how other organizations have structured their deck to win approval, funding or alignment.
In this section, I’ll share real-life examples of budget decks to inspire yours. To make it practical, I’ll also share customizable templates that you can plug your own numbers into.
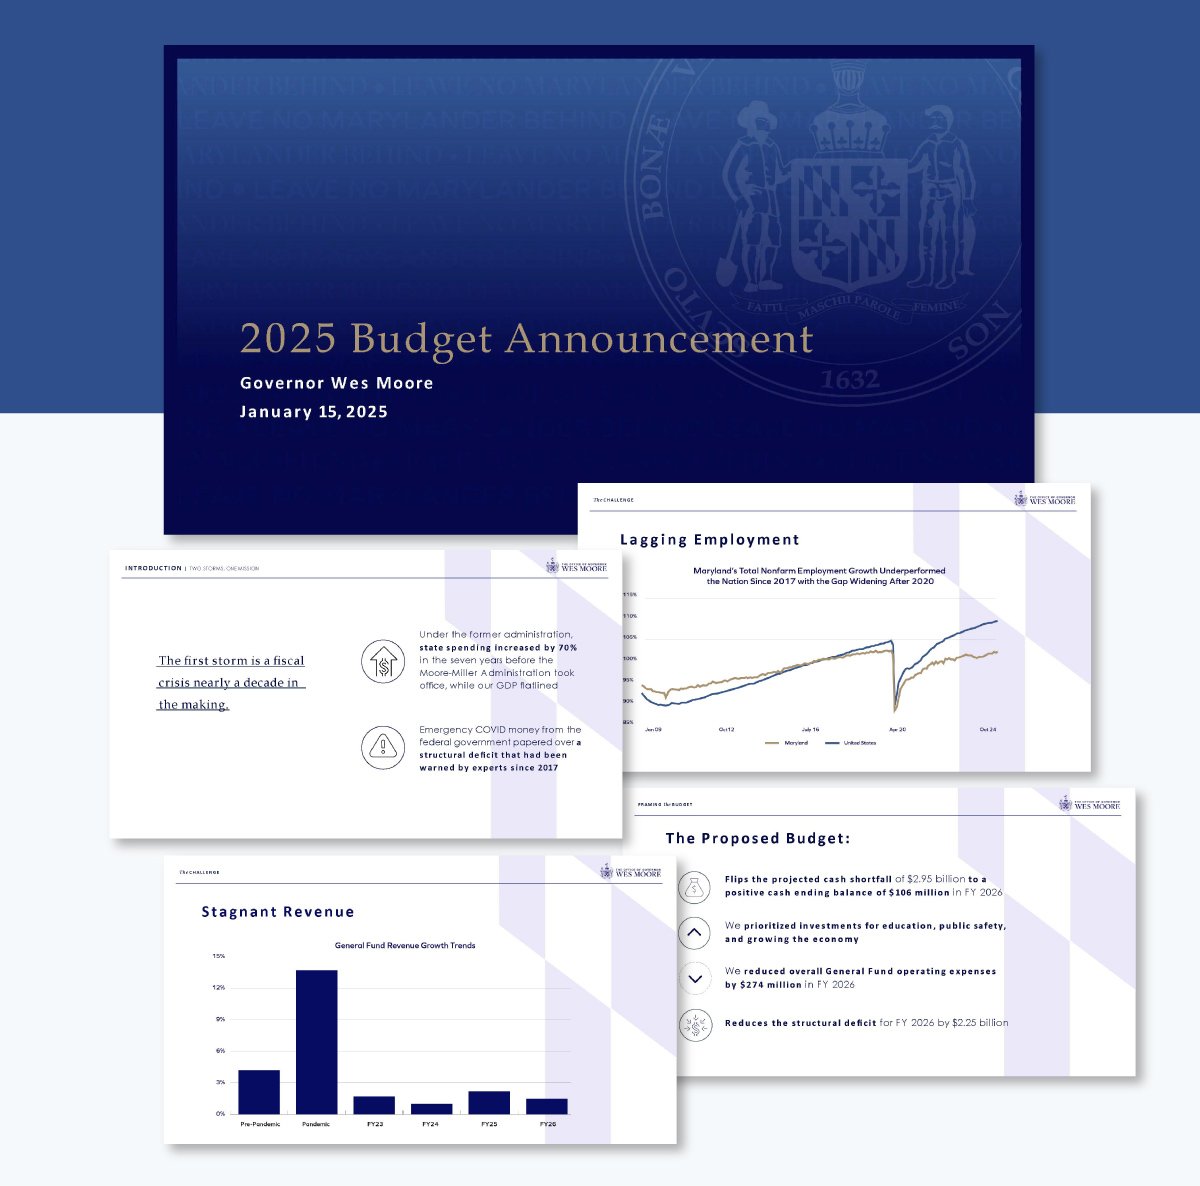
Maryland’s 2025 budget is a 46-slide presentation delivered by Governor Wes Moore. The opening pages set the stage with the state’s vision, top priorities and expected outcomes. This makes the numbers easier to follow later.
Next, the deck highlights the state’s biggest challenges: economic headwinds, weak job growth and stagnant revenue.
I love that the slides aren't filled with dense tables. Rather, they've broken down the data into bullet points, icons and beautiful charts. The design is clean and consistent across all slides. Colors, fonts and spacing keep the content easy to read.
The takeaway from this annual budget presentation? A budget deck doesn’t have to be overwhelming. With context up front and visuals that guide the eye, even complex state finances can be simple and persuasive.
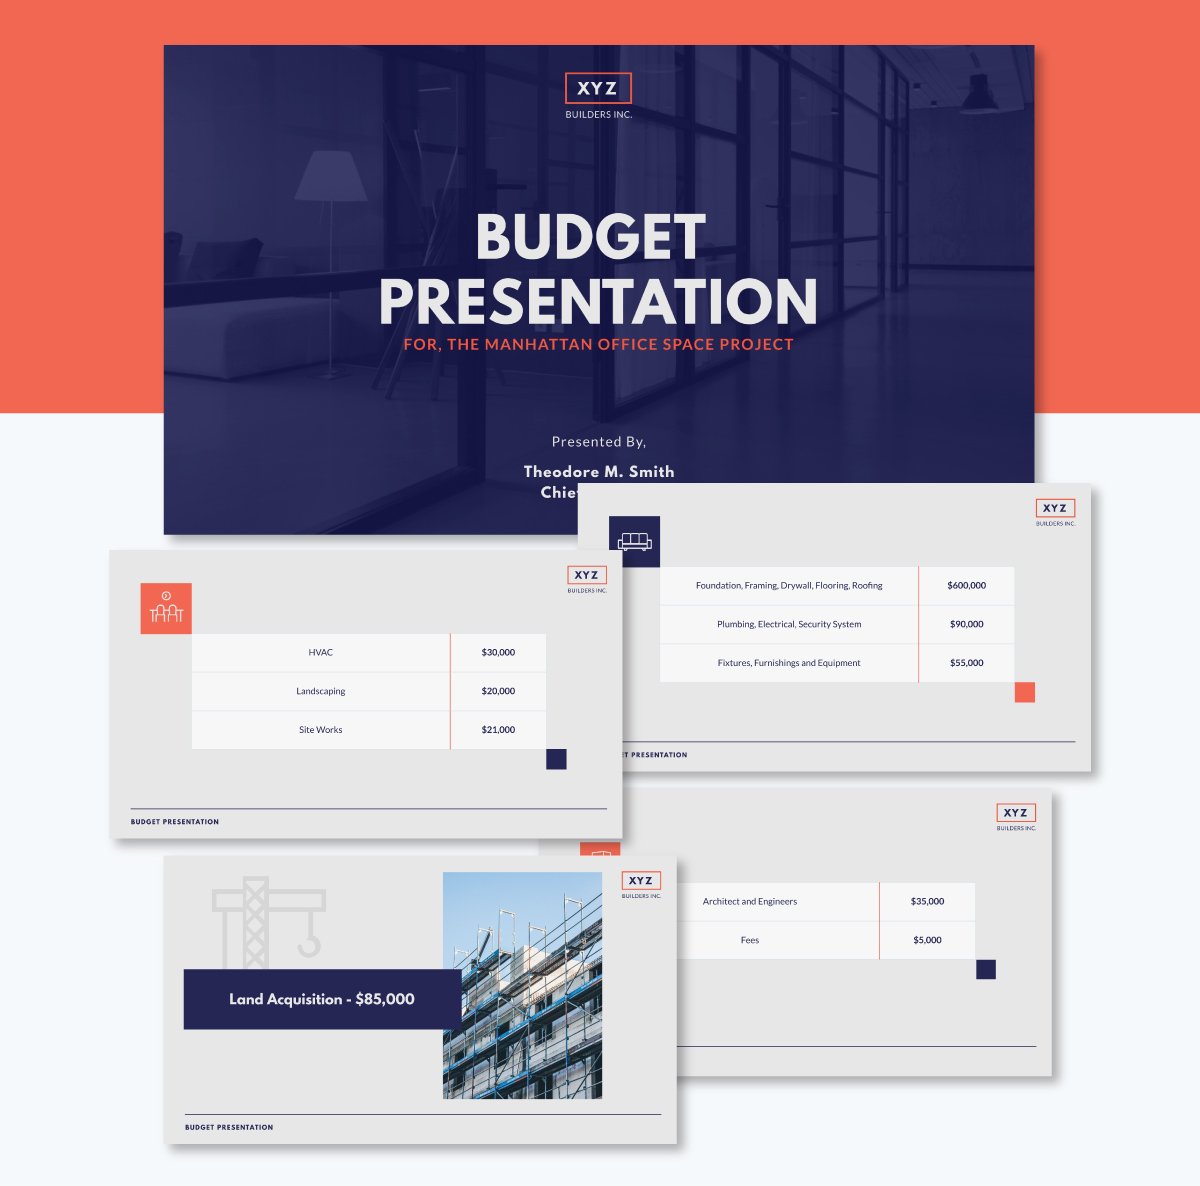
Want to build something similar for your own organization? This budget proposal template is a great starting point. It’s designed with a clear structure, visual storytelling and compelling charts.
Already populated data in Excel or Google Sheets? You don’t need to manually copy and paste it into your slide. Simply connect it to the live data and refresh it whenever changes occur in the source sheet.
Watch this video to learn how to update your data automatically with Visme.
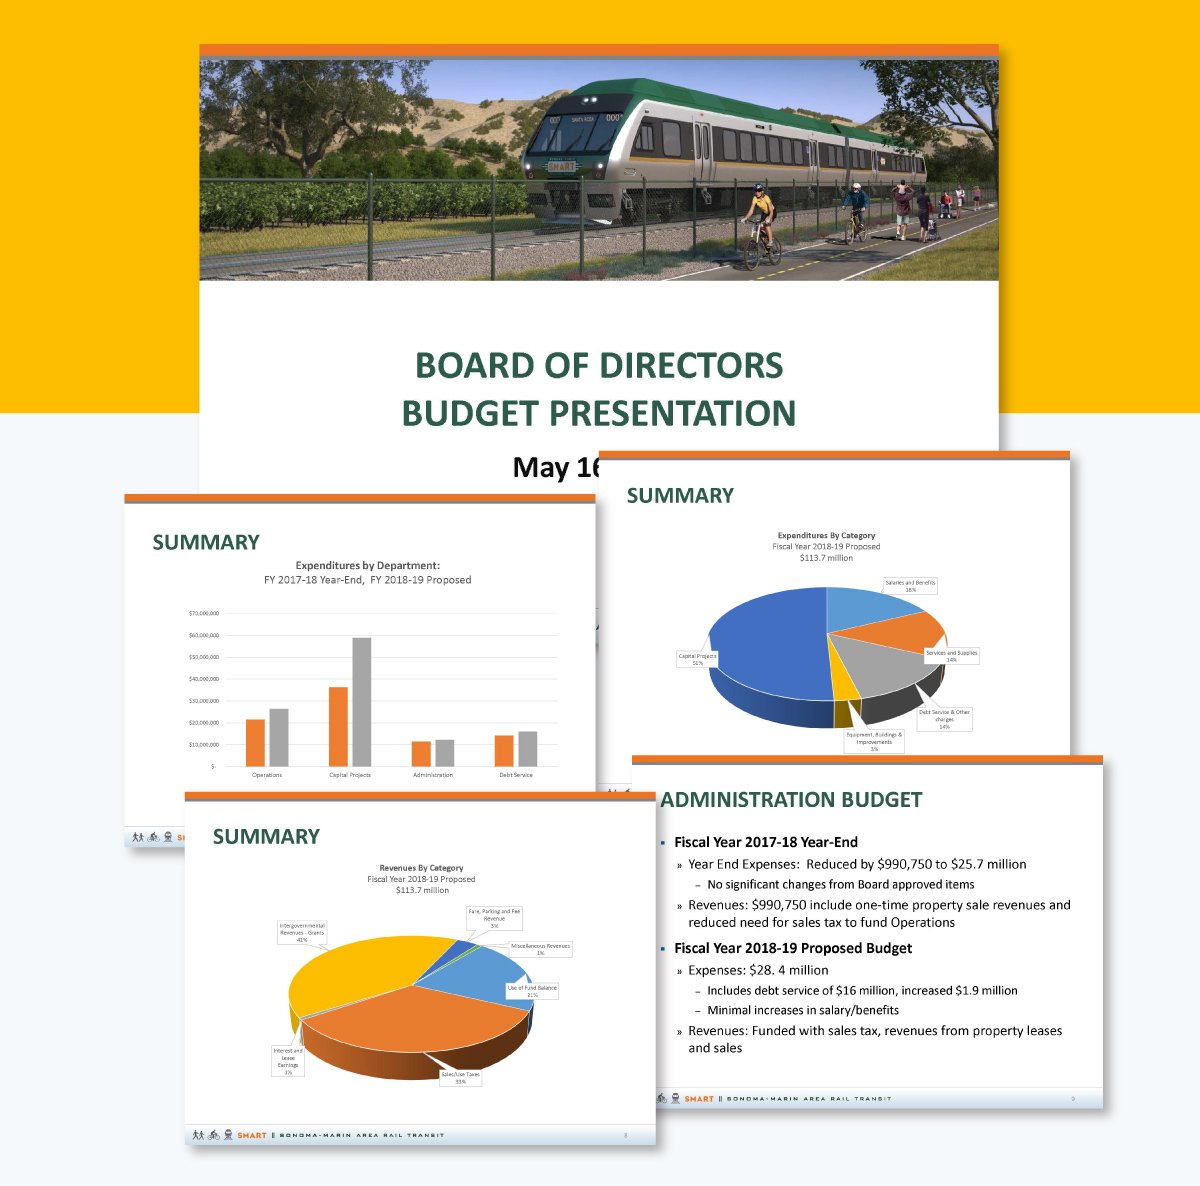
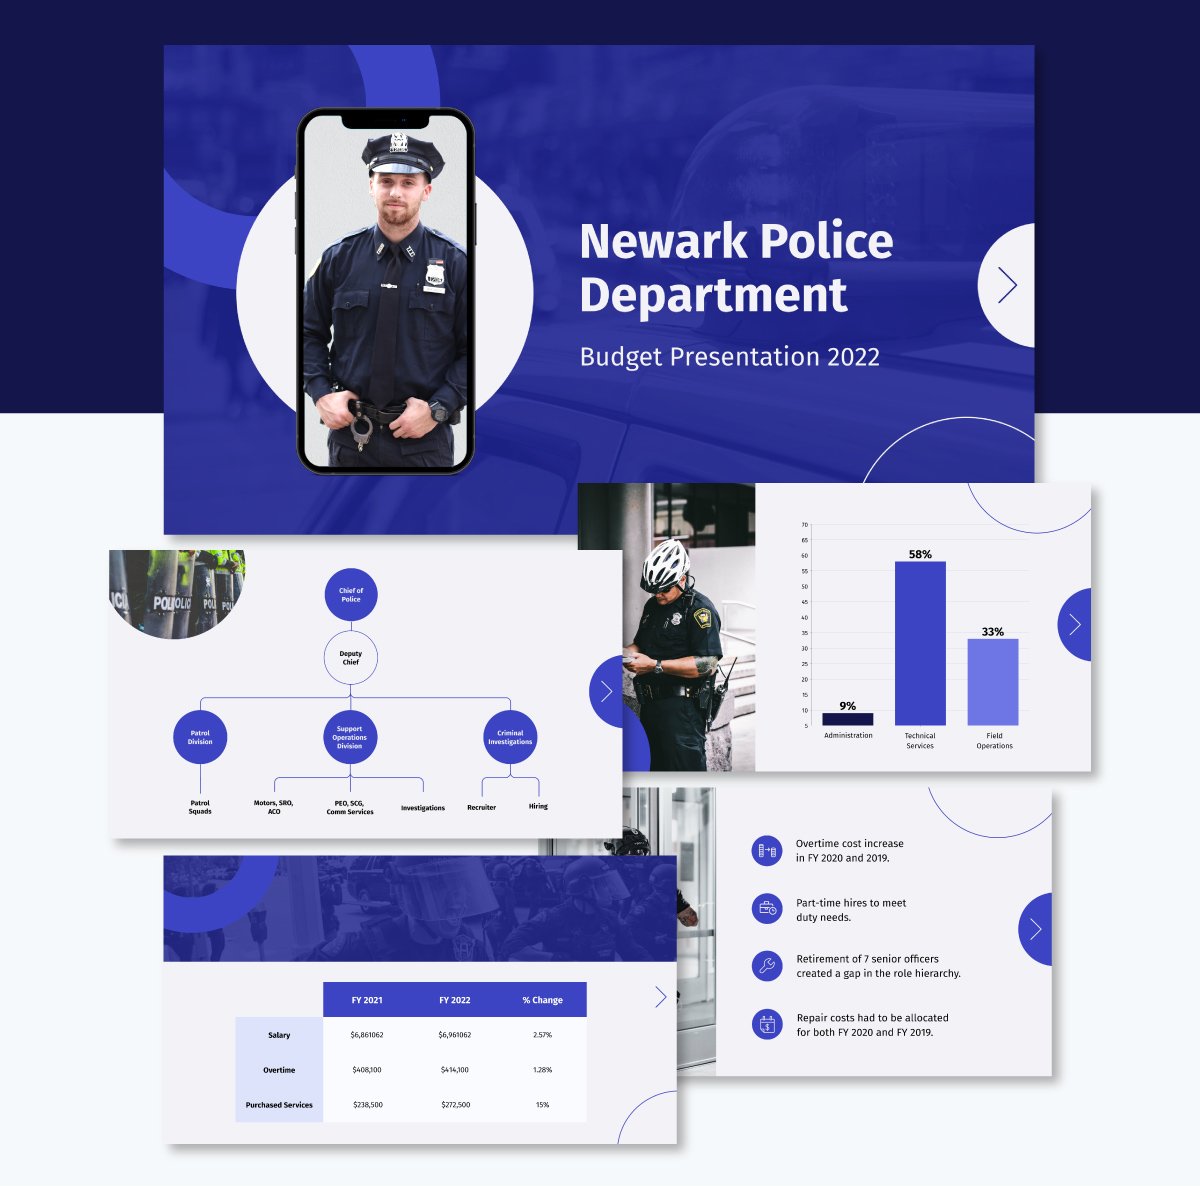
Our next budget slide deck example is pretty straightforward. It doubles as both a year-end report and a proposed budget for the new fiscal year. The opening slides deliver an executive summary of last year’s financial performance.
Then it moves into revenue and expenses. Bullet points show where the money came from and where it went, with short notes on trends. The exact structure repeats for the new budget, but this time it adds a forecast for what’s ahead.
Charts do the heavy lifting here. Bar and pie visuals break down revenue and spending by category and department. The budget is also split into three buckets—capital, operations and administration. That way, stakeholders see exactly how resources are spread.
The takeaway: Don’t present numbers in isolation. Tie past results, current allocations and future forecasts into one story. That continuity makes it simple for stakeholders to connect the dots and sign off.
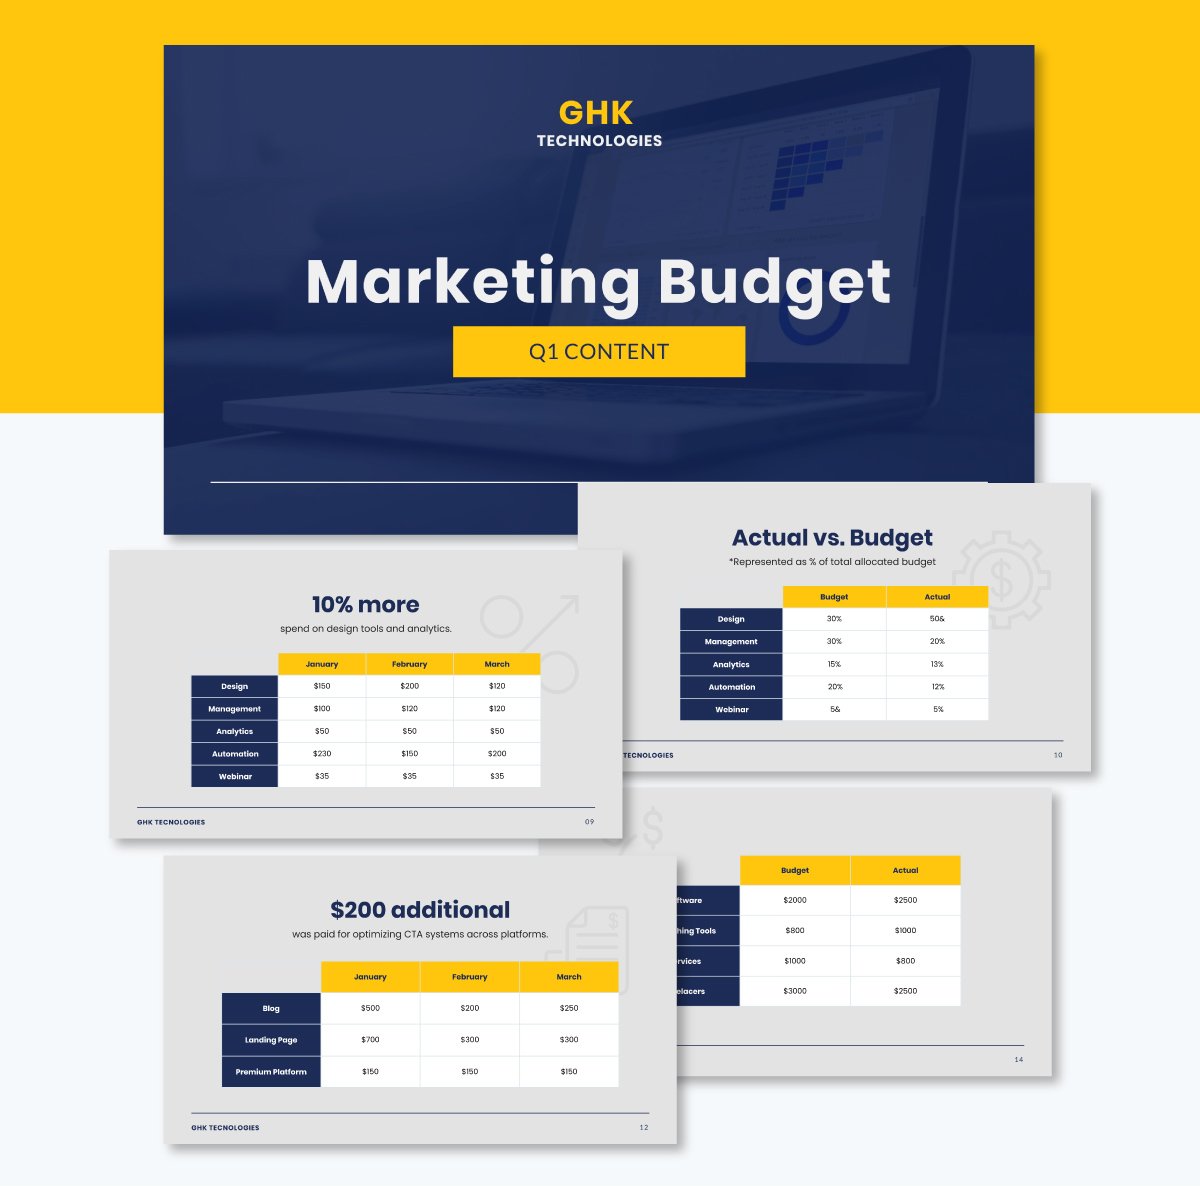
You don’t have to spend hours designing an engaging budget deck. Use this template to share past performance and future projections at annual, quarterly or even monthly report meetings. And it works just as well for other data presentations, such as investor pitches and board presentations.
Customizing this template is a breeze thanks to our intuitive and beginner-friendly editor. All you need to do is swap in your company’s fonts, colors and logos to create visual consistency.
With Visme’s Brand Design Tool, the process gets even faster. Enter your URL and it will pull your brand assets automatically and save them to your dashboard.
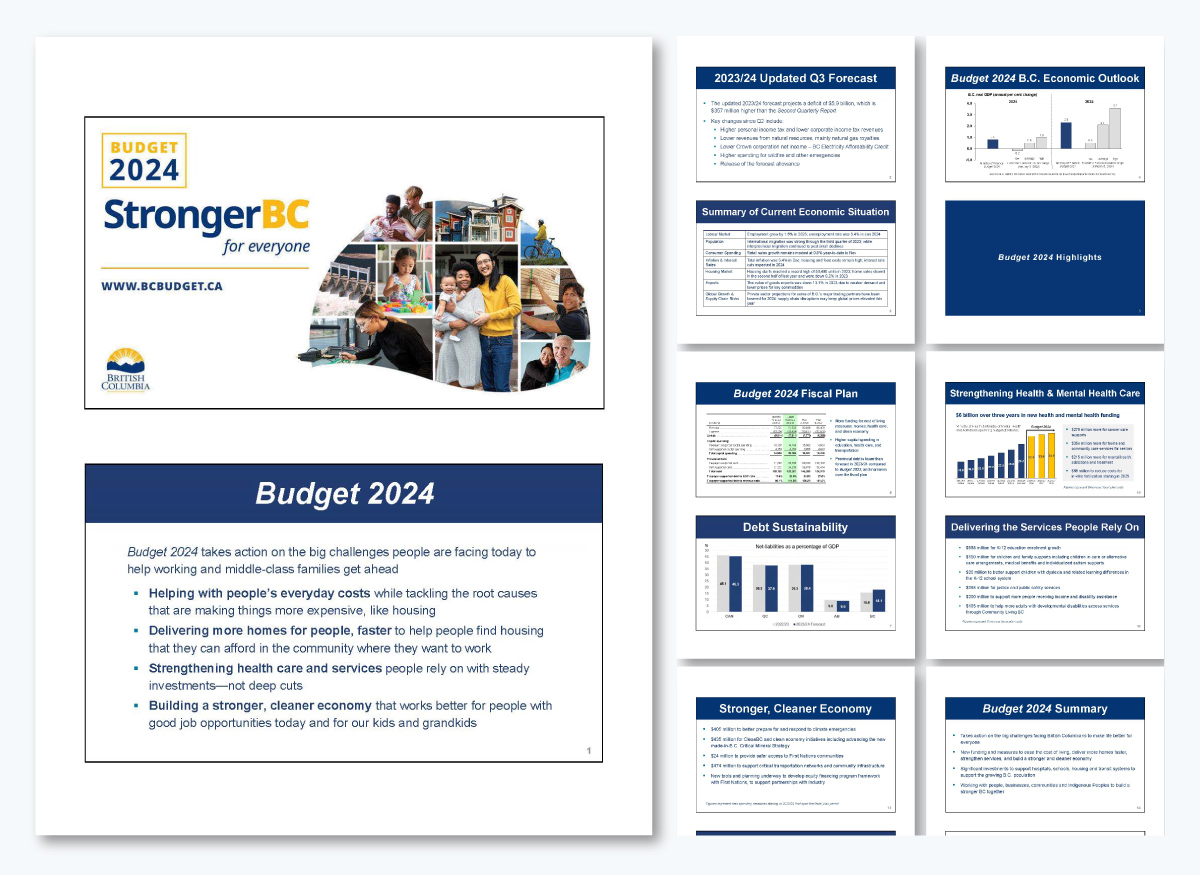
British Columbia’s 2024 budget deck opens with purpose. The intro spells out what the plan will tackle: rising costs, housing shortages, healthcare funding and long-term growth.
The 2023/24 Q3 forecast comes next. The slides show shifts in revenue, spending and deficit projections. A later section recaps the economic situation, followed by a chart showing GDP growth.
The Budget 2024 highlights section sharpens the focus. A clean table lays out the fiscal plan for four years. A debt sustainability chart shows how the province will handle long-term obligations.
Each priority comes with numbers and examples of where the money will go. The deck ends with a short budget summary that recaps the challenges, how the budget addresses them and what citizens can expect.
Key takeaway: This is how to frame a complex budget. Start with priorities. Back them with forecasts. Show a fiscal strategy in clean visuals. Close with a recap. That makes billions in spending easier to follow and harder to dispute.
When you present your own budget, you need slides that keep your audience engaged. This budget proposal presentation template gives you that edge.
Invite your team into your workspace and give them permission to view, comment and make changes in real time. Use the workflow feature to assign slides to different team members to work on, set deadlines and track their progress.
Once the design is ready, share it using a live link or download the presentation in multiple formats, including PDF, image and PPTX.
Creating a strong budget deck is only half the battle.
How you deliver it decides whether people buy into your numbers or push back. So how do you present financial slides in a way that wins stakeholders' confidence?
I’ve broken down what you should do before, during and after your presentation.
1. Test your setup. Don’t just load your deck once and assume it’s fine.
2. Prepare for interrogation. Proposal presentations invite questions; sometimes brutal ones. Anticipate pushback from people on both sides of the table. Build a backup section with deeper data, forecasts or departmental breakdowns. If someone asks why the headcount is up 12%, you should be ready to show exactly where that money is going.
3. Practice like it’s live. Don’t just flip through slides in your head. Rehearse out loud, time yourself and practice transitions. Even better, get a colleague to throw curveball questions. If you can handle them without fumbling, you’ll walk into the room with confidence.
4. Control the flow of information. Don’t dump numbers all at once. Set context before showing metrics. For example, explain the market condition driving revenue before revealing the quarterly breakdown. Use pauses after big figures to let them sink in—and to check if questions come up.
5. Read the room and adapt. If execs are glued to their phones, you’re losing them. Speed up, highlight the “so what,” or pivot to what they actually care about. If they light up during your margin analysis, double down there—even if it means skipping a less relevant section.
6. Turn the delivery into a two-way conversation. Earlier, we touched on building interactivity into your pitch deck. But interactivity during delivery is where you really win attention. Don’t just talk at the room, get them involved.
Ask pointed questions when you reveal a big cost shift. Run a quick show of hands or a live poll when debating priorities. Pause after key slides and invite reactions instead of plowing through. The more your audience feels part of the discussion, the more likely they are to own the decisions that come out of it.
7. Follow up. Don’t just send the full slide deck to everyone. Create two versions: a one-page summary with key insights for busy stakeholders and a detailed version for those who require in-depth analysis. Remember to keep sensitive data out of circulation unless it’s absolutely necessary.
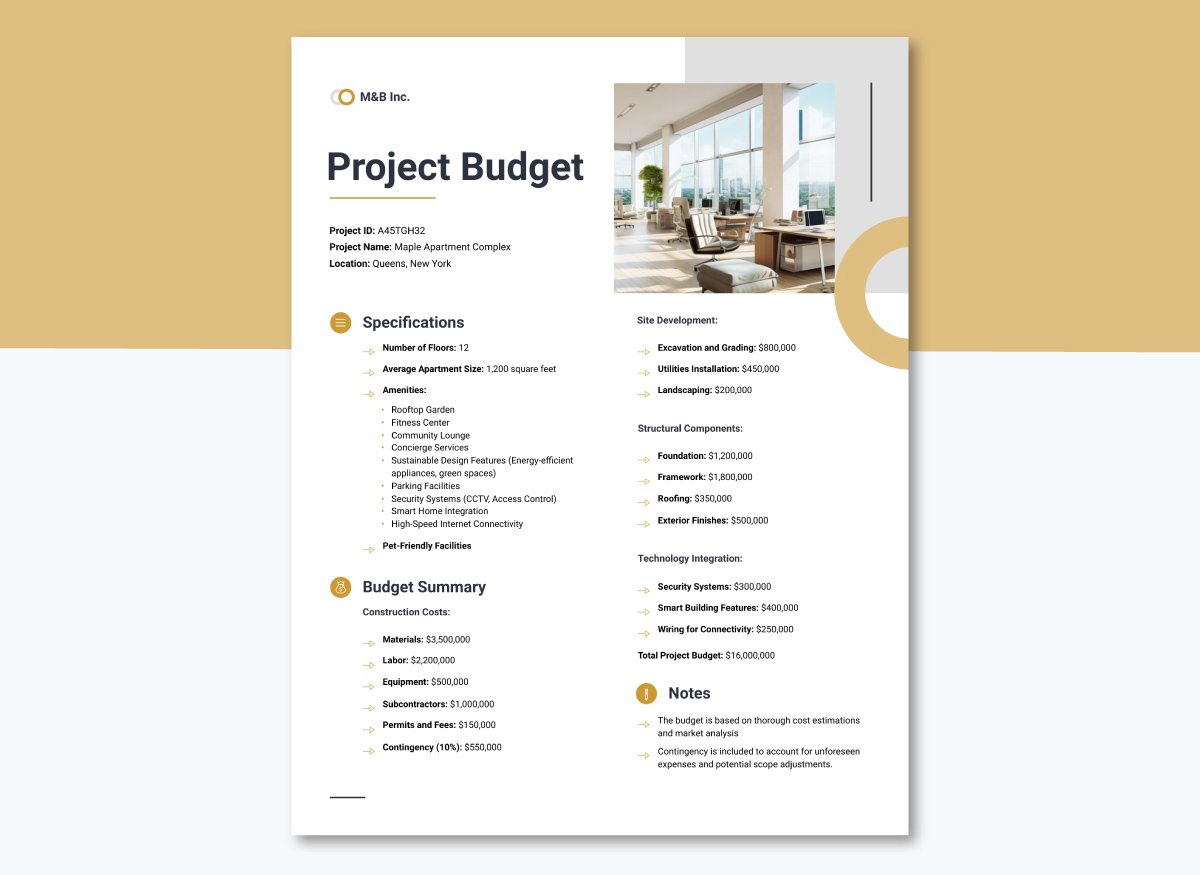
Here’s a project budget presentation template you can customize as a leave-behind.
8. Close the loop. Track what happens with your recommendations. If your presentation gets the green light or leads to a resource shift, follow up with early wins or progress updates. This shows stakeholders that your numbers y translated into measurable outcomes. .
9. Seek feedback. Ask a trusted colleague, stakeholder or higher-ups what worked and what didn’t. Did you move too fast on forecasts? Did you over-explain the basics? Their feedback will sharpen your next presentation.
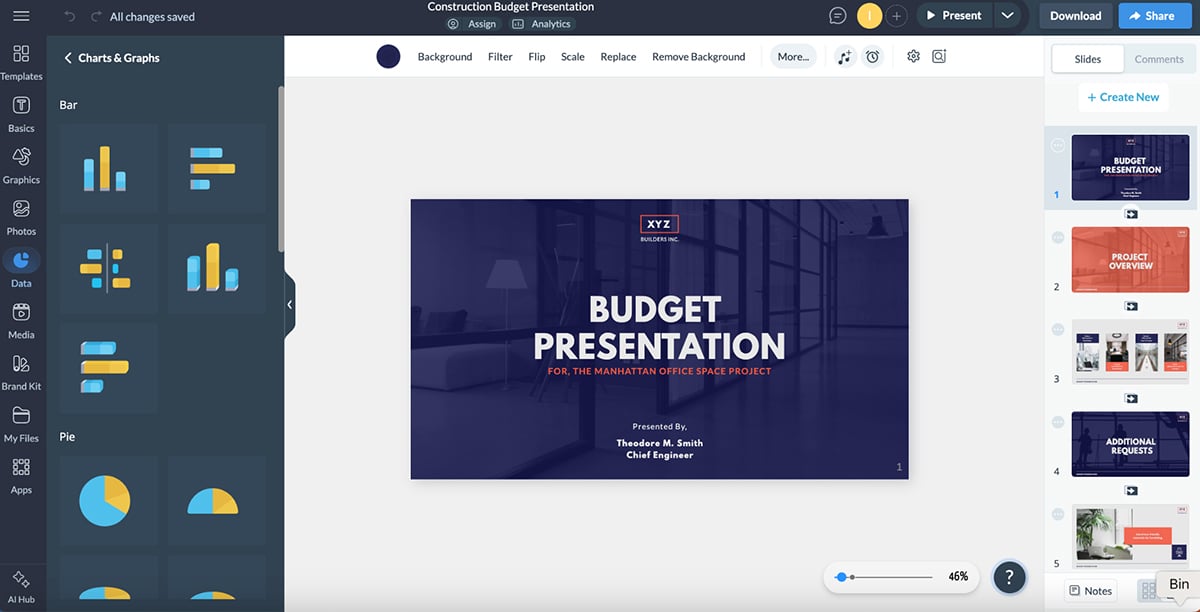
Below, we’ve rounded up some of the best presentation tools for creating budget slides, complete with key features, pricing, best uses and G2 ratings.
| Software | Key Features | Pricing | Best for | Core Uses | G2 Rating |
| Visme | Advanced data visualization, customizable templates, infinite canvas, AI tools, animations, analytics, collaboration and workflow management. | Free; Paid plans from $12.25/month | Businesses, startups, teams | Budget decks, financial dashboards, reports, marketing decks, infographics, interactive content | 4.5/5 (450+ reviews) |
| Beautiful.ai | Smart slide design, AI-powered formatting, templates for business decks, team collaboration. | Free trial; Paid from $12/month | Executives, business teams | Pitch decks, finance presentations, project updates | 4.7/5 (175+ reviews) |
| Pitch | Real-time collaboration, presentation analytics, customizable templates, workflows. | Free; Paid from $22/month | Startups, business leaders | slide decks, businesss presentations, pitches, project reporting | 4.4/5 (50+ reviews) |
| Canva | Presentation templates, drag-and-drop editor, brand kits, team collaboration, AI tools. | Free; Paid from $15/month | Small businesses, marketing teams | Financial slides, reports, social media graphics | 4.7/5 (5700+ reviews) |
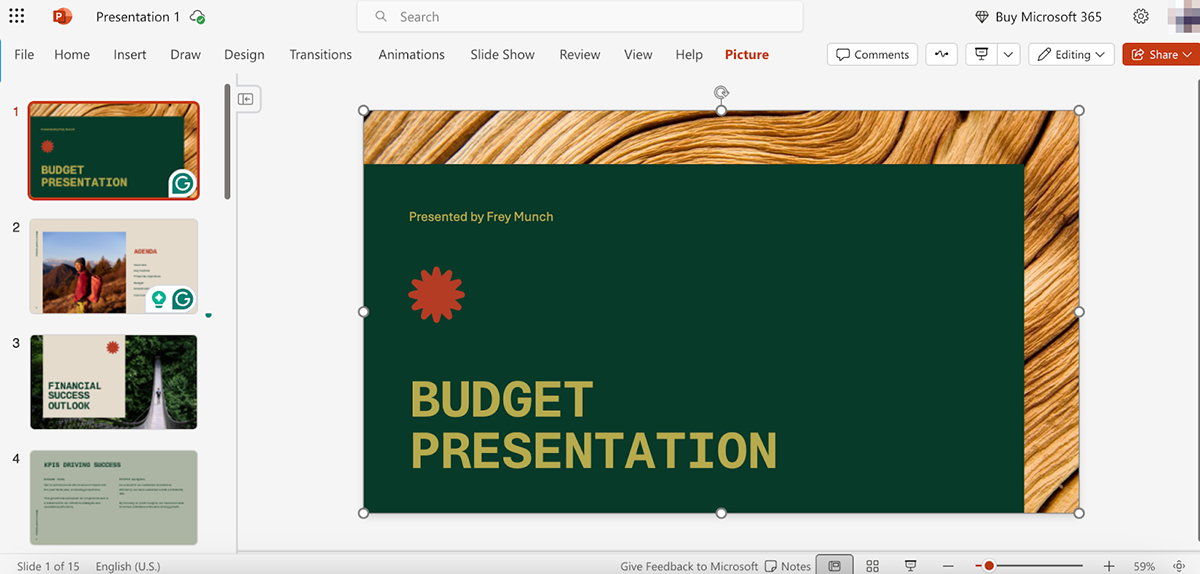
| PowerPoint (Microsoft 365) | Advanced templates, animations, real-time collaboration via Microsoft 365, integrations. | Paid from $9.99/month (personal); $12.50/user/month (business) | Enterprises, corporate teams | Financial presentations, training, project proposals | 4.6/5 (4200+ reviews) |
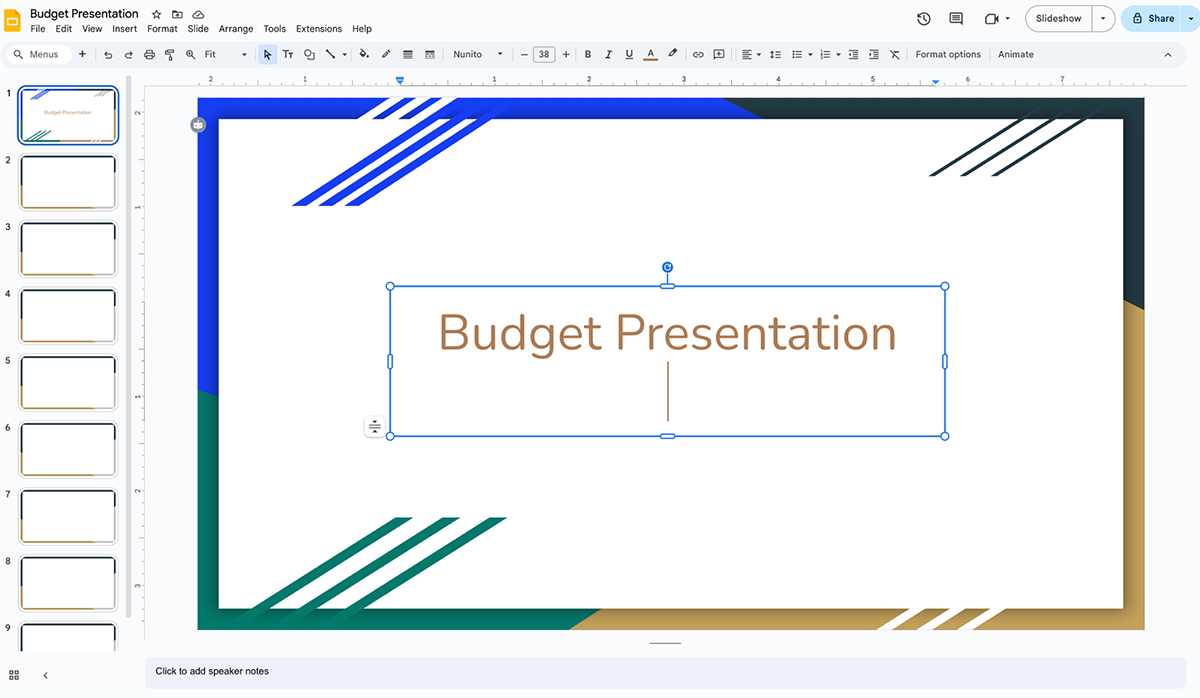
| Google Slides | Cloud-based presentations, real-time team collaboration, easy sharing, integrations with Google Workspace. | Free with a Google account | Remote teams, businesses, nonprofits | Business presentations, project updates, collaborative decks | 4.6/5 (43000+ reviews) |
| Prezi | Zooming dynamic format, non-linear storytelling, templates for business. | Free trial; Paid from $5/month | Educators, marketers, business presenters | Budget presentations, storytelling, interactive meetings | 4.2/5 (5000+ reviews) |
| Zoho Show | Cloud-based, team collaboration, wide range of templates, integration with Zoho Suite. | Free; Paid from $2.50/user/month | SMEs, remote teams | Presentations, team updates, marketing decks | 4.4/5 (70+ reviews) |
| Slides.com | Professional themes, live presenting, analytics, collaboration tools. | Free; Paid from $5/month | Developers, startups, tech teams | Presentations, conferences, webinars | 4.4/5 (20+ reviews) |
Here’s an in-depth review of our top four tools
G2 Rating: 4.5/5 (450+ reviews)
Visme is a powerful presentation software and unified content creation platform. The intuitive editor makes it easy for anyone to create compelling decks even without prior design experience. Plus, it’s packed with dozens of tools that make the slide design process a breeze.
You can build them from scratch using content blocks and themed slide libraries. Or, simply browse the presentation template library to find pre-designed slide decks that you can easily customize in minutes.
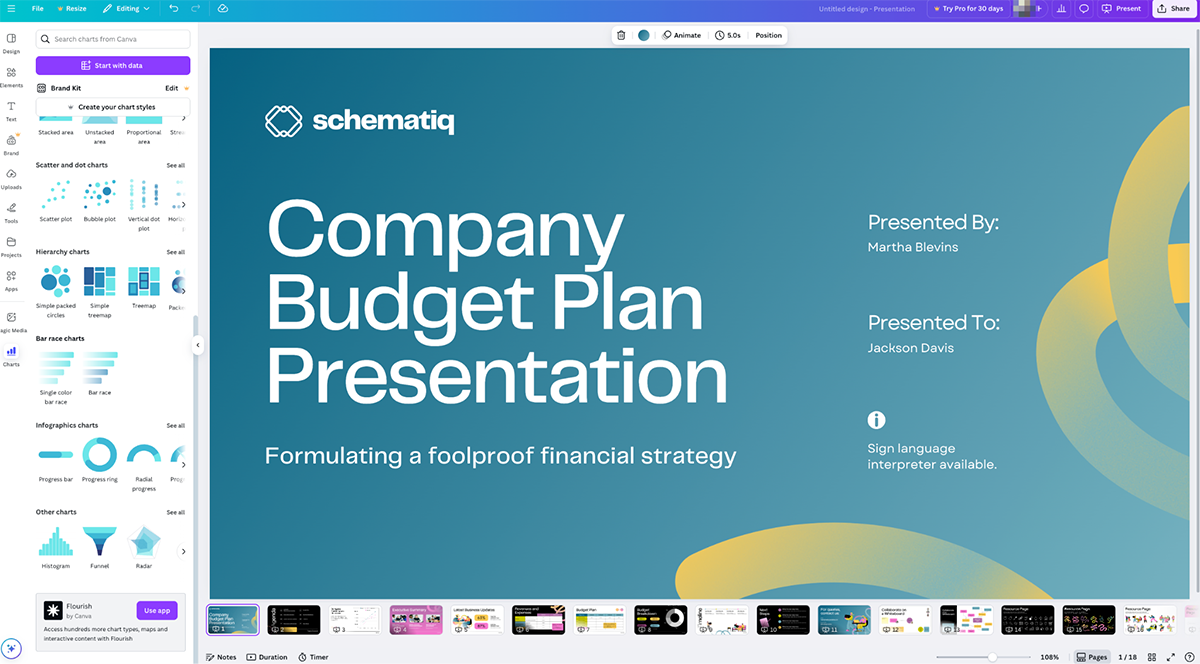
Budget presentations are usually chart-heavy. That’s why Visme is my top pick among other presentation tools. You get access to 20+ widgets and 30+ charts, graphs and other data visualization tools in both 2D and 3D formats.
If you want to elevate your deck, Visme lets you build interactive dashboards and clickable charts right inside your slides. Something most tools on this list can’t match.
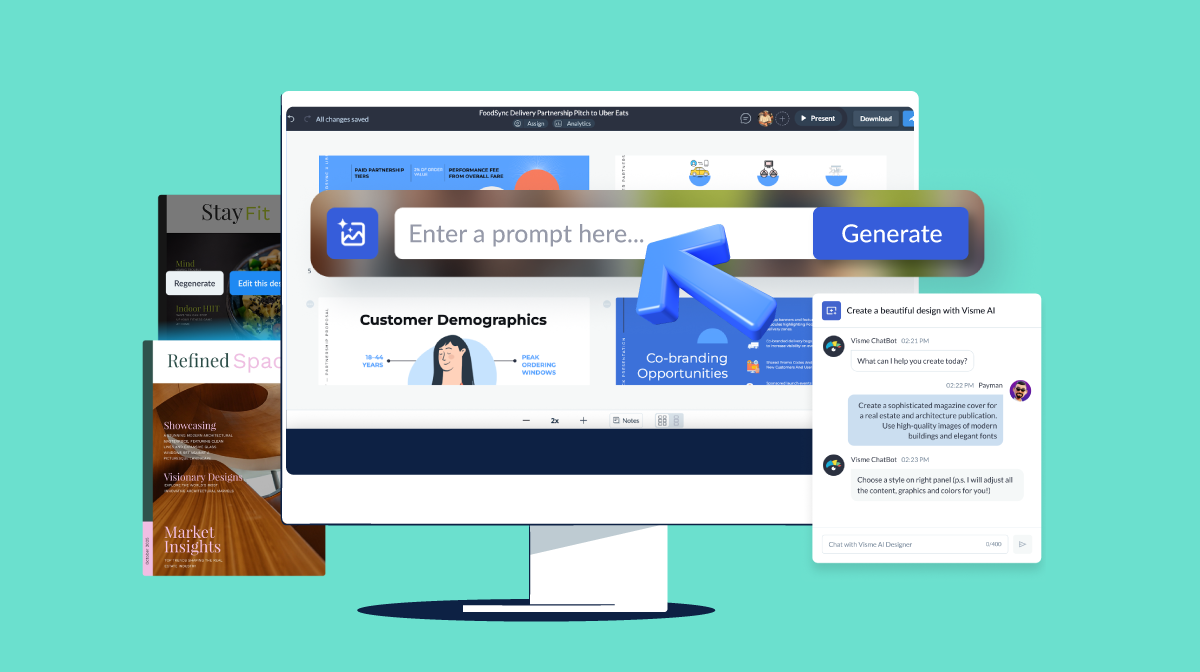
And if you’re racing against the clock, Visme’s AI presentation maker can generate a polished, data-ready deck from a simple text prompt.
Pricing: Free; Paid plans from $12.25/month
G2 Rating: 4.7/5 (5700+ reviews)
Canva has become a go-to tool for quick and attractive visual content, including presentations. It offers thousands of templates, drag-and-drop editing and an intuitive interface that even first-time users can pick up in minutes. Like Visme, Canva is also on the list of some of the best AI presentation makers you’d find in the market.
But for budget decks, Canva gives you access to basic charts and graphs that can be styled to fit your theme. It’s solid for simple financial visuals, though it lacks the depth of interactive data visualization you’d find in Visme.
Pricing: Free; Paid plans from $15/month
G2 Rating: 4.6/5 (43000+ reviews)
Google Slides is also an easy-to-use presentation creation tool. It’s cloud-based, free and integrates seamlessly with the rest of the Google Workspace ecosystem. You can co-edit in real time, leave comments and keep everything version-controlled without juggling files.
The trade-off, though, is in the design capabilities. When it comes to budget decks, you’ll hit limits fast. The template options in Google Slides are limited. It also has limited charting capabilities compared to some of the best presentation software available. Most teams end up embedding charts from Google Sheets.
Even with add-ons, the designs look basic and there’s no real interactivity built in. For a quick team update, it works. But for board-level budget reviews, it can come off as underwhelming.
Pricing: Free with Google Workspace
G2 Rating: 4.6/5 (4200+ reviews)
PowerPoint is still the corporate default. It’s packed with features, works offline and most finance pros already know it inside out. That makes it familiar and low-risk for teams who don’t want to change workflows.
For budget presentations, though, the cracks show. It offers plenty of chart options, but the templates are somewhat limited. And the ones available feel dated and basic. That means you’ll either spend hours tweaking slides or risk showing a deck that looks like every other corporate presentation.
For big-budget presentations, that lack of finesse can hurt your pitch. Visme cuts out that grind. You get dozens of modern, ready-made templates built for financial data storytelling, plus advanced data visualizations and interactivity baked right in. Instead of fighting with design, you can focus on telling the story that wins approval.
Pricing: Paid plans from $6.99/month (as part of Microsoft 365)
A budget presentation is a structured way of sharing your organization’s financial plan. It explains past performance, current allocation of resources and future projections. The goal is to justify how resources are being allocated and help stakeholders make funding or strategic decisions.
How to visually present a budget?
Numbers alone usually don’t do the trick when it comes to financial presentations. It’s better to use visuals to highlight what’s really important:
Keep the design clean, avoid text-heavy slides and make every chart share valuable insights. The audience should be able to grasp insights at a glance without getting lost in details.
Finance presentations have a reputation for being dry, but that’s avoidable. The key is interactivity and relevance. Here are a few presentation tips for budget managers.
When stakeholders feel part of the conversation, they start owning the decisions and that’s what moves budgets forward.
Always move from context → data → decision.
Start with the big picture: what’s driving your revenue, costs, or forecasts? Then show the supporting numbers with clear visuals. End by pointing to the implications: What needs approval? What risks or opportunities should the group act on?
For example: Instead of showing “Marketing spend = $4M,” frame it as: “Marketing investment increased by $4M to fuel a 20% pipeline growth target. Without this, we risk losing share to competitors in 2025.”
The bottom line is that your financials should not just inform but also direct the course of action.
And that’s a wrap. You now know how to structure and design a budget presentation that influences decisions. I’ve also shared how to present a budget to a board.
When you get this right, your audience grasps your strategy, priorities and expected outcome. That’s what wins approvals, secures resources and builds trust at the leadership table.
The good news? You don’t need to waste hours fighting with PowerPoint formatting or building charts from scratch. With Visme, you’ve got ready-to-use budget and financial templates, interactive charts, branded visuals and even AI tools that cut creation time in half.
Book a demo today to discover how Visme can help turn your data into meaningful stories.
Design visual brand experiences for your business whether you are a seasoned designer or a total novice.
Try Visme for free