Visme Forms Walkthrough: Build a Form That Routes, Syncs and Converts

![How to Write an Effective Monthly Report [+ Templates]](https://visme.co/blog/wp-content/uploads/2022/10/How-to-Write-an-Effective-Monthly-Report-Header.jpg)
Do you want to make better decisions as a manager or business owner and grow your business? Creating a monthly report is an excellent way to do that. But what does it take to write one? A good report should be clear and concise, with an overview of the month's activities and key findings.
Fortunately, a monthly report template and AI can help you write a report in minutes. In this guide, we will discuss how to write a monthly report, with and without AI.
Plus, we share several templates across multiple industries and use cases so you can find one that suits you best.
Before you dive in, watch this video to learn about the essential elements of effective business reports along with design templates you can use.
Here’s a short selection of 8 easy-to-edit monthly report templates you can edit, share and download with Visme. View more templates below:


A monthly report is a summary of your business activities during a specific month. It provides an overview of key statistics, information about the company's financial position and a review of the performance of critical business units.
This report is usually prepared at the end of each month, although some companies may produce annual or weekly reports.
Here is a great monthly report example:


Not sure if a monthly report is the right cadence for what you're tracking? Here's how it compares to the alternatives.
| Report Type | Frequency | Best For | Focus |
|---|---|---|---|
| Weekly Report | Every week | Fast-moving teams tracking sprint progress or short-term goals | Immediate wins, blockers and priorities for the following week |
| Monthly Report | Every month | Managers and business owners tracking performance trends | Metrics, KPIs, project status and plans for the following month |
| Quarterly Report | Every three months | Leadership teams reviewing strategic progress against goals | Multi-month trends, budget performance and strategic adjustments |
| Status Report | As needed, by project or milestone | Project managers updating stakeholders on a specific initiative | Task completion, deadlines, risks and next steps for one project |
If you need something more frequent than monthly, check out our guide on weekly reports. For a broader view across the year, see our annual report templates. If you're tracking one specific project rather than the whole business, a project status report is the better fit.
A monthly report isn’t the same format from team to team. Yours can be a document, spreadsheet, slide deck, digital document, dashboard or even a microsite.
Here's what each one is good at, and where it falls short.
| Format | Common Tools | Best For | Limitation |
|---|---|---|---|
| Document | Microsoft Word, Google Docs | Text-heavy reports intended for printing or emailing | Charts and visuals typically need to be created and inserted separately |
| Spreadsheet | Microsoft Excel, Google Sheets | Raw data, calculations and financial modeling | Provides limited narrative without supporting context |
| Slide Deck | PowerPoint, Google Slides | Presenting findings to leadership, clients or stakeholders | Can be difficult to understand without a presenter |
| Digital Document | Visme, Adobe Acrobat | Shareable, scrollable reports distributed through a link instead of a file | Requires a web-based publishing platform rather than a standard word processor |
| Dashboard | Visme, Looker Studio, Klipfolio | Real-time metrics stakeholders can monitor at any time | Works best alongside a written summary that explains the numbers |
| Microsite | Visme, Notion, Carrd | Standalone report pages shared through a public link without requiring login | Requires more setup than creating and sharing a single document |
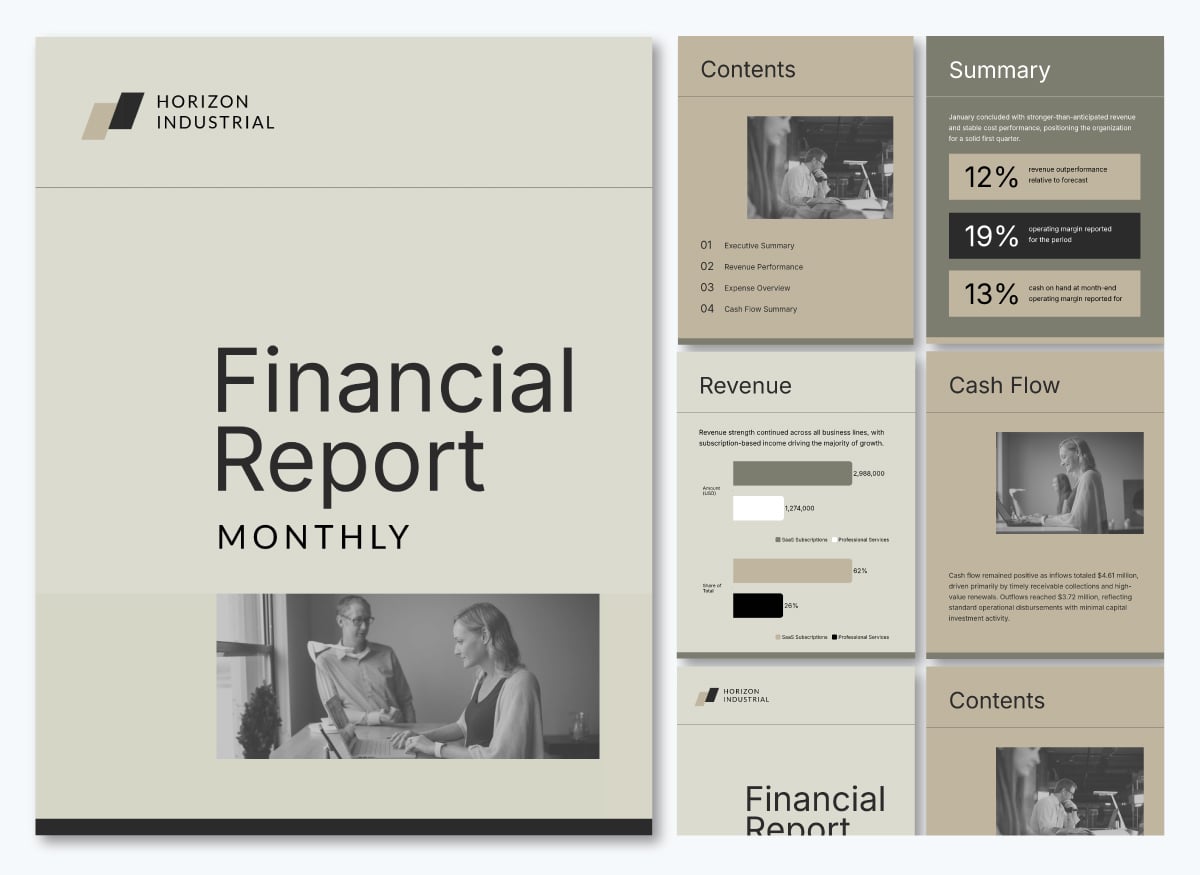
A document report is a written file used for text-heavy reports you'll print or attach to an email. You'll typically build one in Word or Google Docs. It's a familiar format that almost anyone can open without help. That familiarity comes at a cost: charts and visuals have to be pasted in from elsewhere, and long reports get hard to skim.
Got a report built on calculations and data? A spreadsheet will handle it best.
Formulas, pivot tables, and raw data make Excel and Google Sheets the natural choice for tracking numbers. On its own, though, a spreadsheet rarely tells a story, so most teams pair it with another visual format to present the findings.
Using a presentation deck format for your report is perfect for splitting your content into individual slides, ideally one point per slide. That flow works well in a live meeting where you walk people through them. Visme is great for this, but PowerPoint and Google Slides can also work.
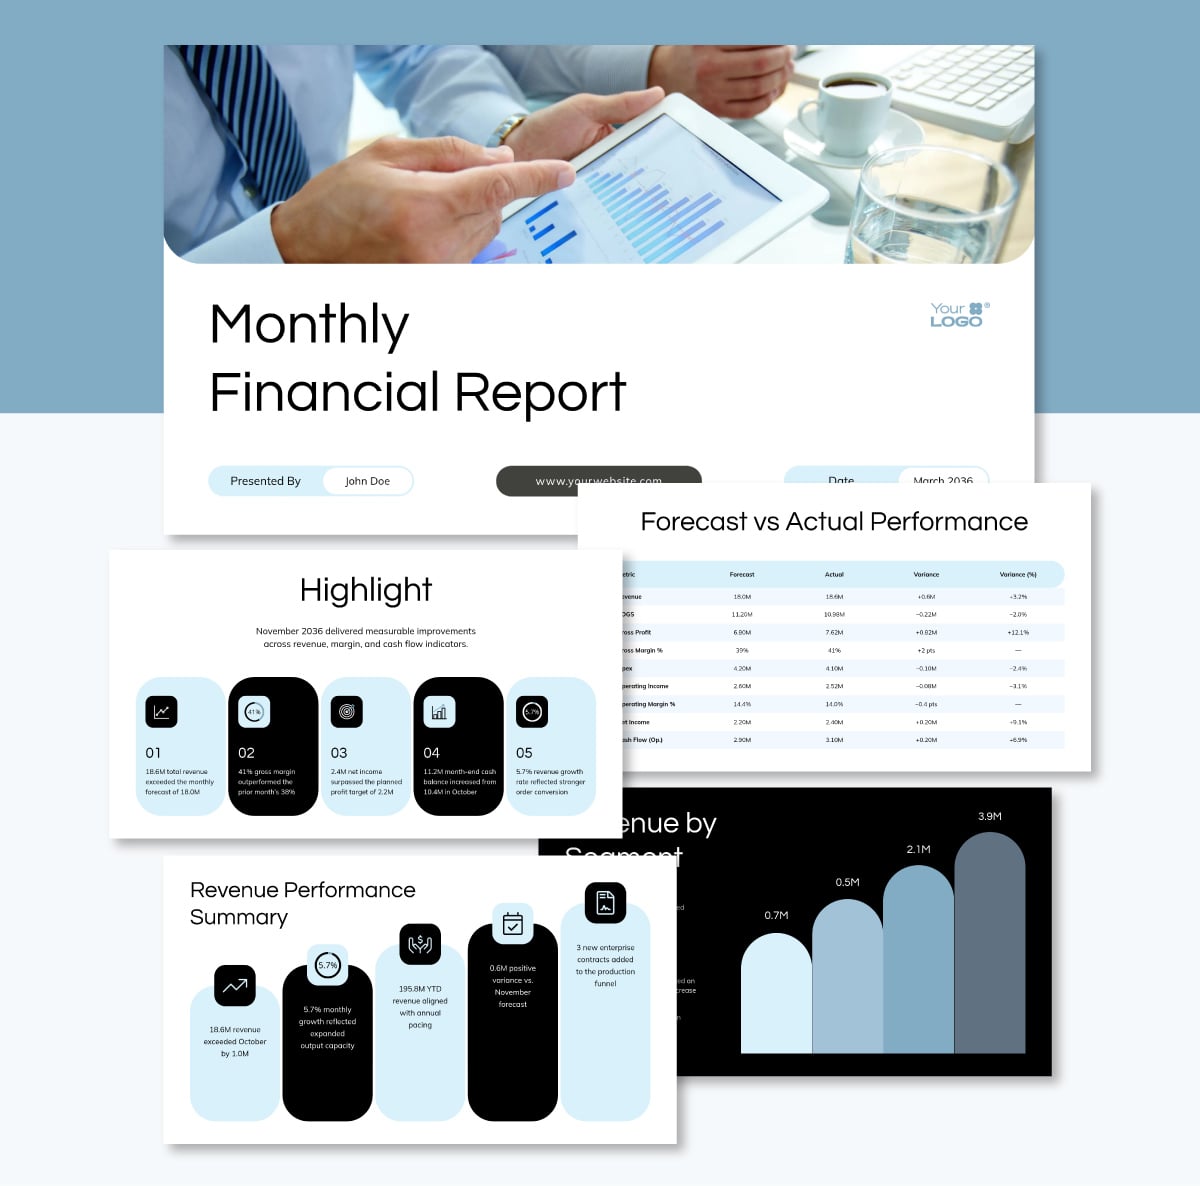
Share a digital document as a link for readers to view on their browser. No need to download. They’ll be able to scroll or flip through on any device. It sits between a plain Word doc and a full presentation: more polished than the first, less setup than the second. Visme and Adobe Acrobat will both handle this format well.
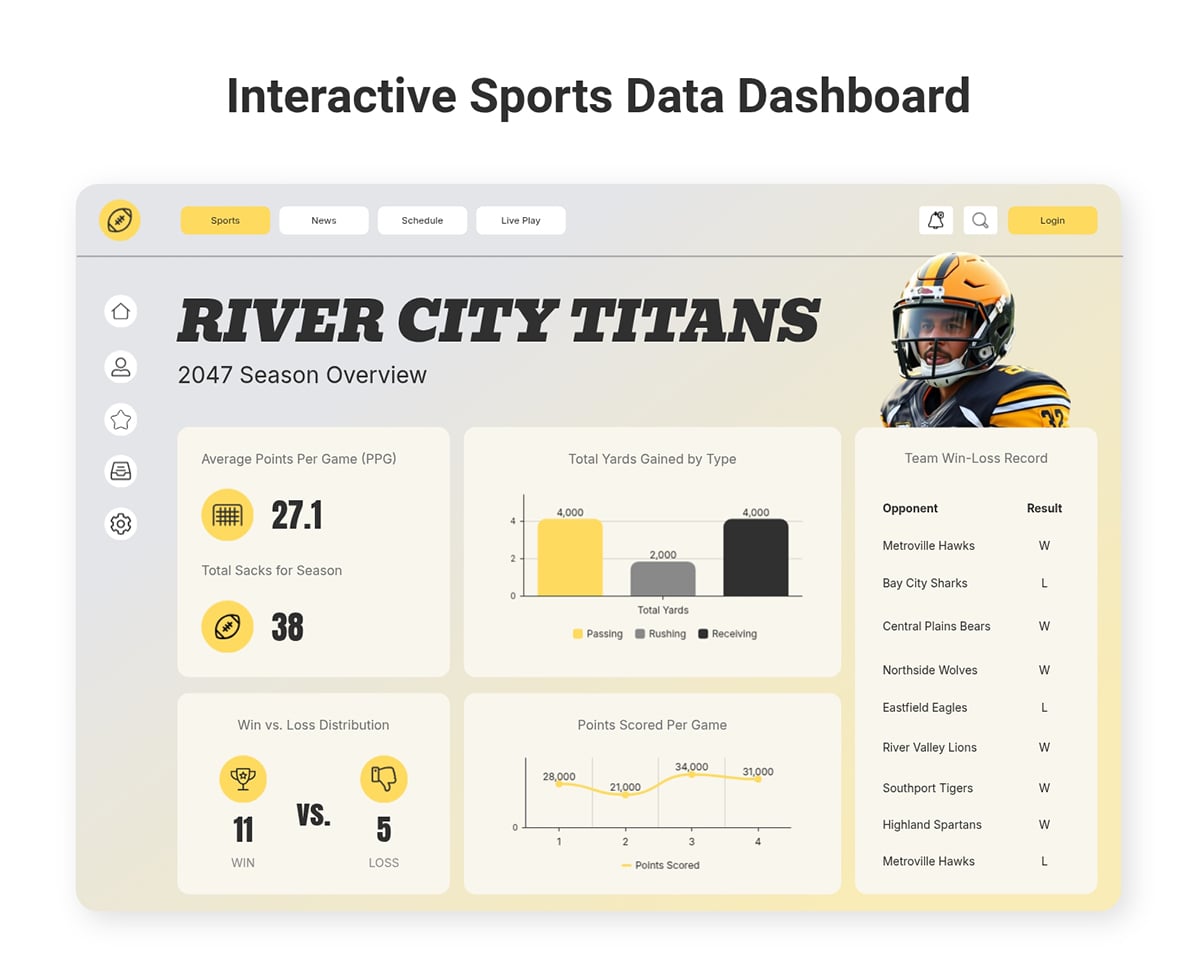
If you want to update a report regularly, your best choice is a live dashboard. They’re built for tracking performance in real time through highly visual charts and graphs. Plus, stakeholders can check performance anytime without waiting for the next report cycle. The trade-off is context: a dashboard shows what's happening, but not why, so it works best paired with a written summary. Use Visme, Looker Studio or Klipfolio to create your dashboard.
And finally, a report can also exist as a microsite hosted on the web. This format is ideal for sharing both internally and externally by using a URL. Microsites are easy to make with Visme, Notion and Carrd, each tool with its own pros and cons. The best part? Instead of someone having to download or open an app, all they need is a browser.
Now let's dive into 25 professionally made monthly report templates you can start to incorporate into your business, team or projects.
You can edit and customize these templates manually in the Visme editor, or use the Edit with AI feature to speed things up. Hover over a template, click Preview, then Edit with AI. Answer a few quick questions about your content and Visme generates a customized version of that template, ready for you to fine-tune in the editor.
Jump to: Sales | Marketing | HR | Customer Service | Operations | Industry-Specific | General


Are you looking for a sales or business monthly report that helps you showcase all your data while also giving a strong corporate feel?
Use this template to create your own right now. Show your budget allocation, revenue growth, quotas and deal sizes with professional-looking tables and with graphs and data widgets.
As you write your sales report to showcase data, propose next steps or pitch a project, narrow the analysis to where decisions actually get made.
Kalyn Lewis, Head of Sales & Customer Experience at Visme, breaks down her approach:
"When I'm creating a sales report and I have a scope of analysis and data that needs to be reviewed together to drive decisions and follow-up actions, I pull my data points and get things into Visme to present a better visual narrative. I keep the views simple with Visme's charts, graphs, and data widgets, then bring in call-out visuals and interactive pop-ups that drill down further from the simple views. The golden ticket is to try to predict the questions that will come up, and make sure you have data and visuals to answer those questions too."
Visme lets you create tables for any industry in a few clicks, with pre-filled options. You can also import data from Salesforce or an Excel spreadsheet directly into your report to build the kind of layered, interactive report Kalyn describes without switching between tools.


Next on the list is another sales report template that comes with a bold design with contrasting color schemes and a strong font combination.
This monthly report template comes with segments for highlights, metrics and target vs gains related to your monthly sales. When you're incorporating your data, be prepared for follow-up questions from stakeholders. Anticipate these questions or concerns by sharing some insight ahead of time or discussing them with your team beforehand.


Here's another monthly sales report template, but this time, it's specially designed for consumer goods businesses. The template will help you showcase your sales team's performance, challenges and opportunities, profit and loss (P&L) and many other metrics.
Customize it in Visme's drag-and-drop editor to replace the text, images, data sets and more.
Visme offers a wide variety of other report templates for annual reports and weekly reports. Check out the library of other report templates and customize them in the Visme editor.


When you need to have your monthly report ready by Friday afternoon and you're running out of time, a template can be your greatest ally. Put all your data together into the template using the pre-designed layouts and compositions. It takes the hassle out of report writing and designing from scratch.
Are your notes and analysis too long winded and complicated? Get help from the Visme AI Writer to condense and summarize your recommendations, metrics explanations and executive summary.
This template uses a clean design to help you optimize the way you share insights with your team. Keep it neat and tidy and let the data and information shine.


Impress your peers in the corporate meeting room with this clean-cut report template. Integrate a color gradient as the unifying factor across pages to frame tables and charts into attractive compositions.
Use the tables to visualize your company’s marketing metrics like financial performance, product/service performance, geographical and regional performance and customer metrics.
The tables in this report have a simple style with no column borders or row colors. But if you want a different style for your tables, the settings menu offers plenty of personalization options.
Here’s a video that shows you how to do it:


Present your sales performance in style with this visualization-rich report. Use a combination of half donut charts, data widgets, funnel charts, bar charts, pie charts and tables to highlight sales metrics like the best-performing sales funnel, monthly sales growth, sales volume by country, sales volume by age, competitor pricing and sales by contact method & channel.
In the suggestions page, use the laptop mockup to showcase a video with your suggested next steps. To add a video inside the mockup, simply drag it in from your uploads (media library). Share your report as a digital document via a live link so that your viewers can watch the video without issues.


Your monthly sales report doesn't have to be a boring document. With a template like this one you can create an attractive and engaging document that will wow your team. Use the photo editing settings to turn all images black and white. Add a red accent to create a beautiful contrast throughout the pages.
Use circular photo frames to highlight your team members and highlight their performance throughout the month. Share customer metrics like customer acquisition rate, customer lifetime value, churn rate and customer satisfaction score with a grayscale table.


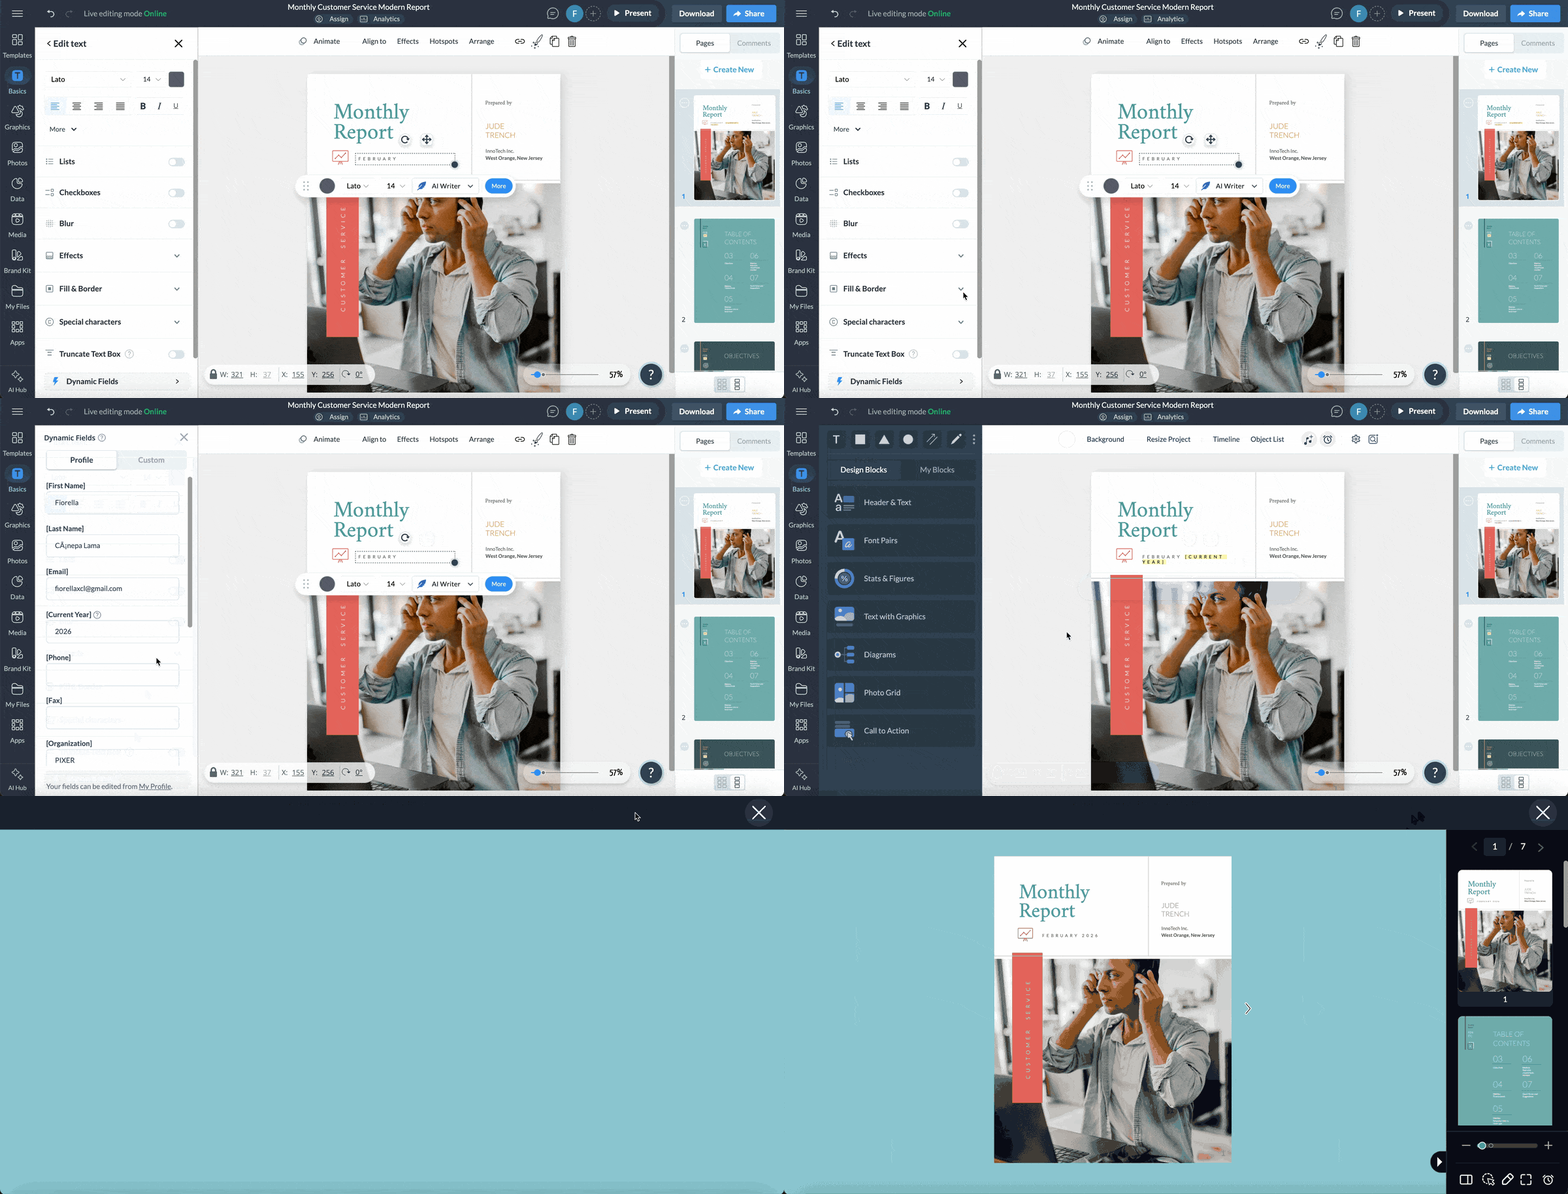
One monthly report template can be reused throughout the year thanks to Visme's dynamic fields. Use pre-set fields for dates and names and create custom fields for values and changing data.
In this template, the key KPIs are visualized with a list of icons and bold lettering, financial performance with a table and product sales with a bar chart.
To change the table data, you can import a sheet from multiple data sources like Google Sheets or upload a CSV sheet from Excel. If sharing the report as a digital link, you can add live data that updates on its own when the original data is manipulated.



This monthly marketing report template has a clean layout that keeps readers focused on the data. With the marketing strategies section, timelines, tables and line graphs, you can easily track your business progress and present it in an attractive way.
And when you're customizing this report or creating any type of marketing report for that matter, resist the urge to include every metric you have access to. As Doug Crooks, former Marketing Manager at Visme, advises:
“For most businesses, which are often lead-driven, monthly reports at a higher level should provide a bird’s-eye view of traffic across key properties. Include complex factors like paid campaign spend, CPM, reach, and objectives, whether it’s mid- or bottom-funnel focused.
Monthly reports should remain high-level to keep the focus on essential channels, assets, and the metrics that impact the business most.”


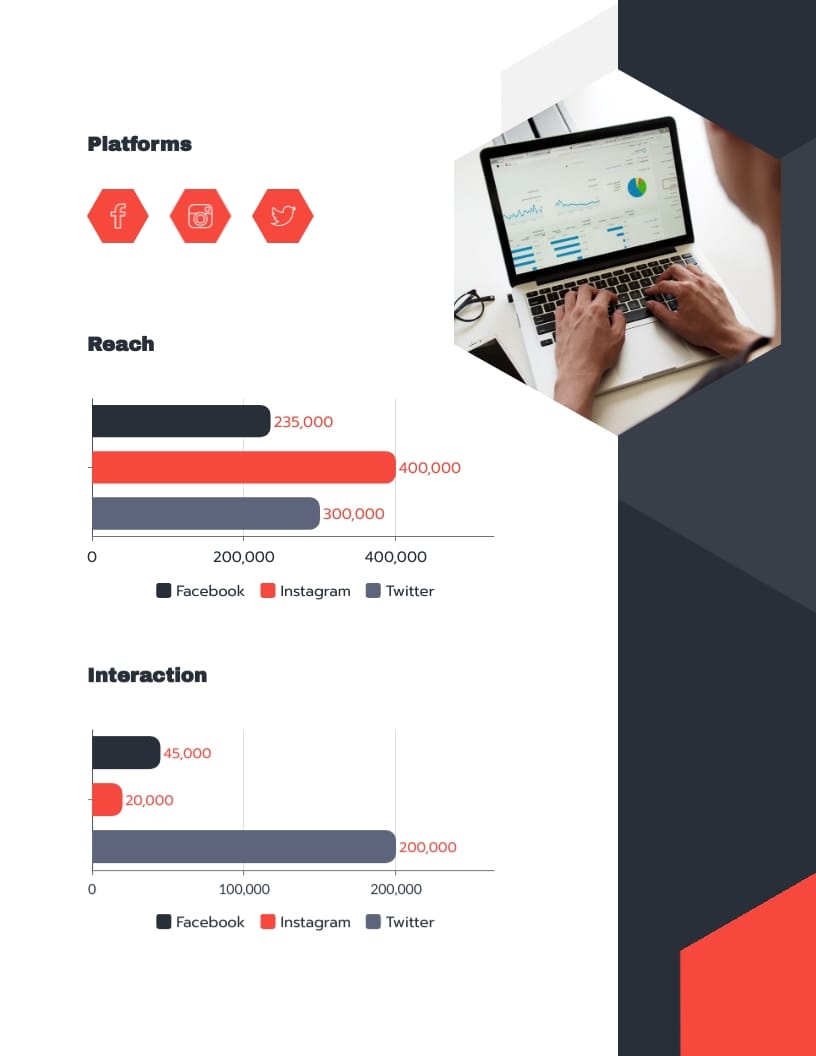


To present a social media analytics report, you need to collect and analyze data points that help you measure your social media performance. Chelse Hensley, Social Media Manager at Visme, believes that being selective is what separates a good report from a cluttered one:
Social Media Manager
One of the best components of a good social media report is brevity. There are so many intricate insights and analytics at our fingertips, but being a good Social Media Manager is knowing which to include. Then highlighting the most important insights using charts or design elements, making sure they impact the viewer.
Chelse Hensley
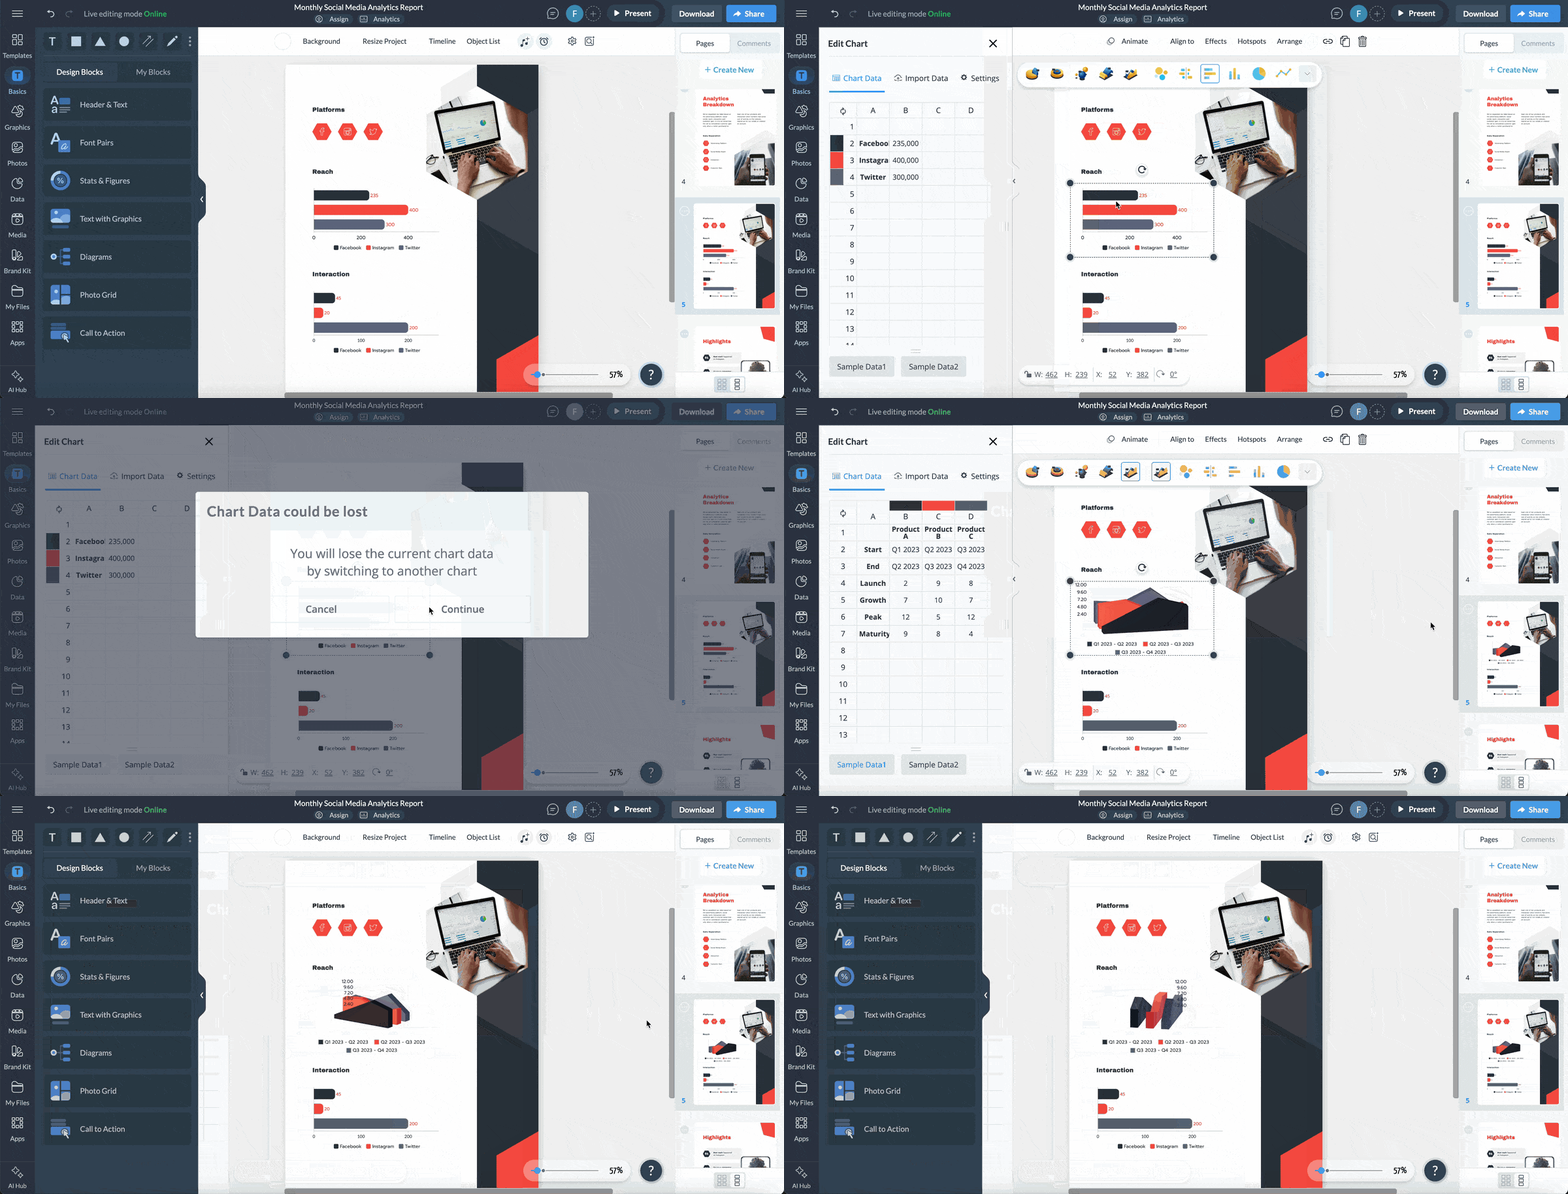
With the help of this social media analytics monthly report, you can incorporate unique data visualizations that transform your data into valuable insights. Add live data widgets to sections and snapshots from your most used social media apps to paint a clear picture of your wins and improvement areas.
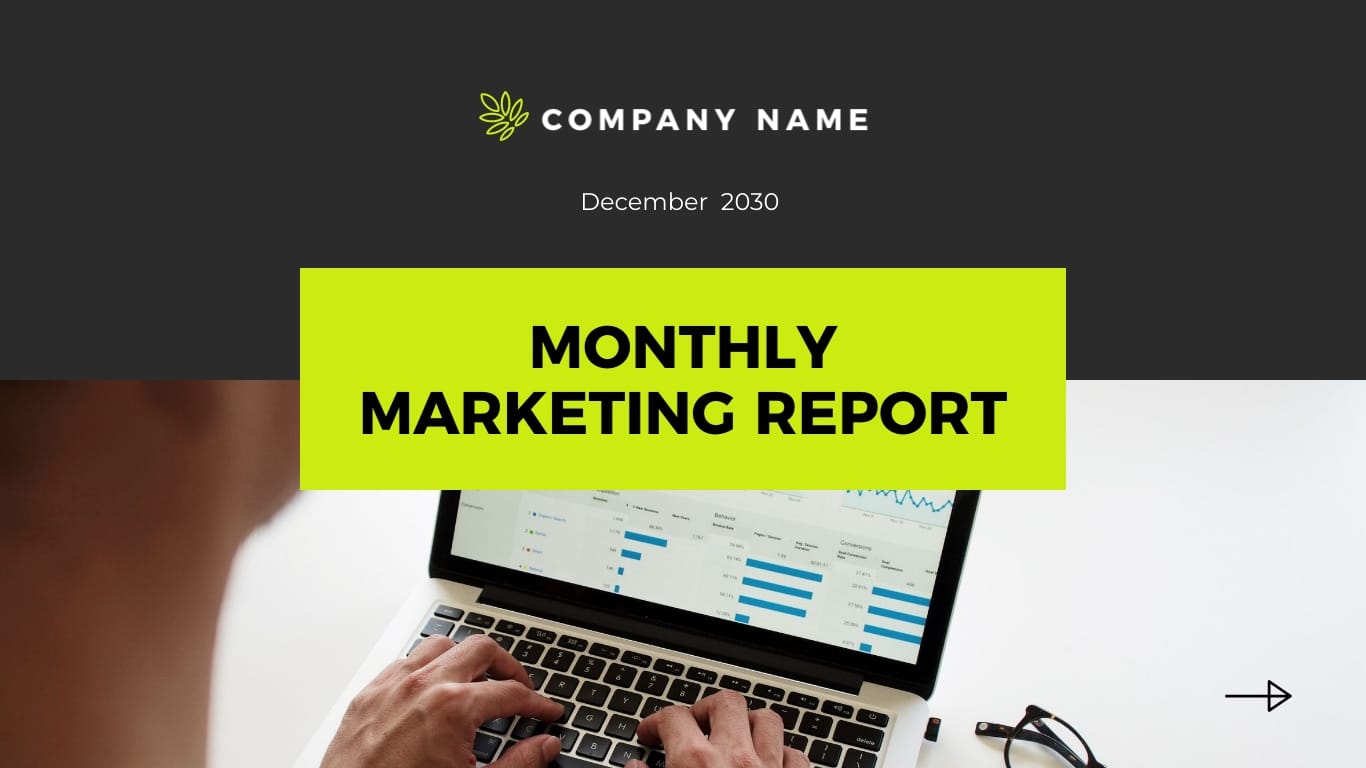
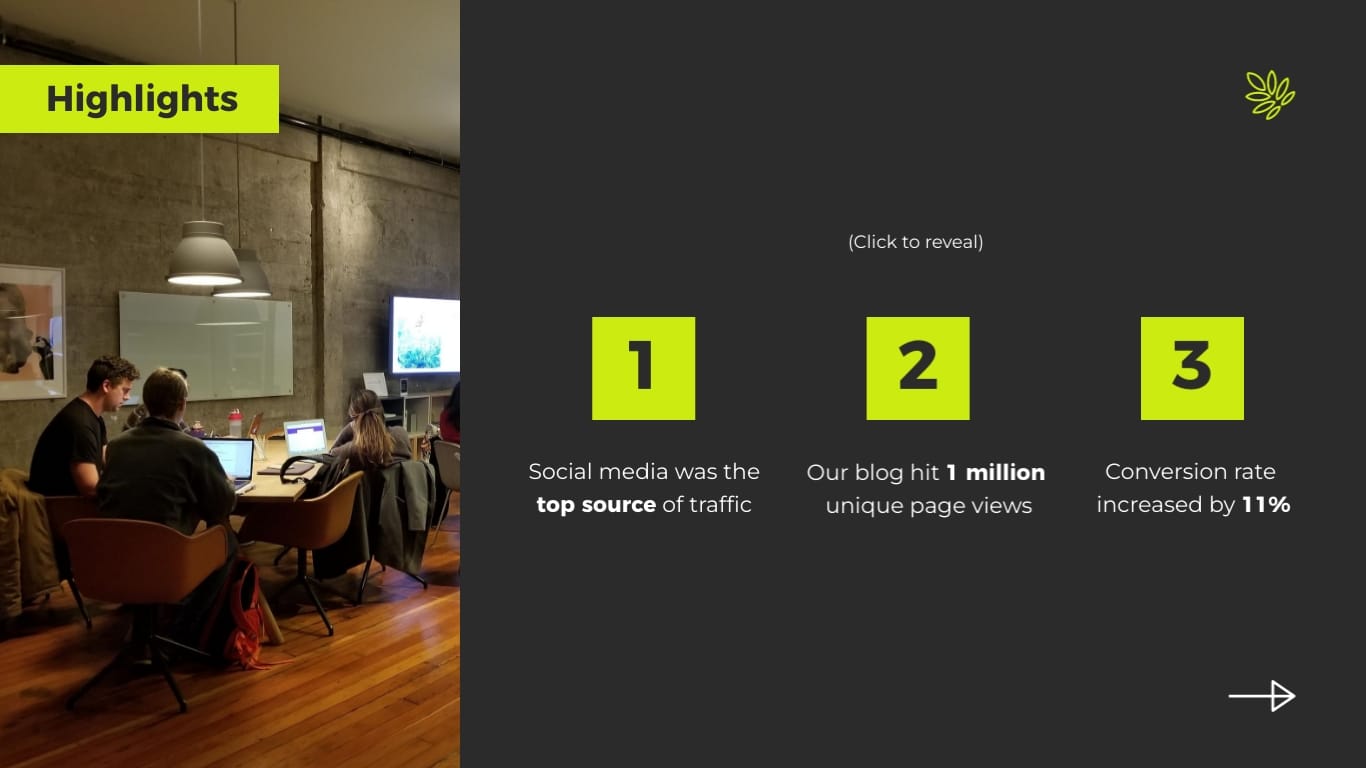


Make your monthly reports more engaging by using an interactive template like this one. The interactive properties of this monthly reporting presentation template make it the perfect visual aid for a live presentation.
Click on each section to reveal information as you progress through the slides with your team and managers. You can also repurpose it as an executive presentation to share with stakeholders and the leadership team.
This template is pre-designed for reporting on a website’s monthly performance. Slide five visualizes average visit time, bounce rate and site speed using colorful data widgets. You can customize the accent colors to match your style guide, brand or chosen color theme.
When analyzing the data that goes into it, Doug, Former Marketing Manager at Visme, recommends focusing on movement over time:
Marketing Manager


Take a creative graphic approach with your monthly report document and use this shape-based template design. Use repetition to create a monthly report that’s true to your brand aesthetics and keeps the viewers’ attention.
Unify the shape colors with the graphs, charts and tables to visualize marketing strategies, sales from online marketing and overall marketing performance. Share your monthly report as a digital document and add a password entry that only your team can access.


Present your company’s attendance rates for the month with this colorful report template. Highlight an attendance overview and leave vs attendance with a pie chart and a donut chart, respectively. But don’t be afraid to swap out charts to showcase metrics that matter the most to you.
Anastasiya Shen, HR Manager at Visme, recommends starting from your goals and working backward.
HR Manager
HR reporting is essential for any company, but an HR report for a remote, hybrid, or in-office team will differ. A best practice is to create an HR report tailored to your unique HR goals. Find what metrics matter most, then look for gaps, wins and ways to improve.
Anastasiya Furman
Use 3D graphics to visualize the information and make the report more engaging. Create a highlights page with data widgets, avatars and a small bar graph; all color-coded to your brand guidelines.
For a report that includes data from multiple teams, take advantage of Visme's workflow features and assign department heads to their part of the report. Ask them to fill in the data for their team directly into the report, eliminating any back-and-forth.


Presenting an effective KPI report relies on the right combination of charts, tables and visualizations. To kick things off, list the KPIs in an overview at the start of the report to give an idea of what’s inside.
Use the list of KPIs as a navigable table of contents so when you share the report as a digital document, the viewer can jump directly to the KPI they wish to see. Use animated icons to visualize textual data and create custom bullet lists.
Don’t forget when crafting a great HR report, you need to balance metrics with a people-centered approach.
HR Manager Anastasiya Shen sums up the right mindset for this kind of report:
HR Manager


As a customer service representative or manager, it's important to track your team's metrics, wins, and losses, especially when reporting to high-level management.
This customer service report helps you achieve this with a bold, colorful, and dynamic design. It highlights customer service metrics with bright colors and timeless fonts.
Like any other report, a customer service report should clearly outline and communicate customer success findings and terminology, making it easy for anyone in your company to understand, regardless of their customer service experience.
Lincoln Brooke, Customer Service Manager at Visme, says clarity matters above everything else:
Customer Service Manager
When creating a customer support report is to ensure that communication is clear and organized. Present information with clarity so that the reader feels confident in their next steps. Clearly outlining these steps ensures that each experience is investigated and resolved quickly.
Lincoln Brooke
The design of this template thrives on its unique color combination. Replace the images and edit the text and other information to fit your industry and brand personality.


When you’re creating a report, it can be easy for team members and management to glance over crucial numbers that affect the overall results of your customer service department.
You can repurpose this template as a monthly management report covering high-level data on customer service KPIs and ROI's. You can also highlight issues, bottlenecks, response times, requests closed and other key metrics.
When you're presenting your customer service report, don't just state numbers and results. Give a quick overview of why you're tracking these metrics and how they drive the department's efficiency.
Make your monthly analysis report more engaging using customizable vector icons, cool shapes and 3D animated graphics.
Learn more about how to take advantage of these animated illustrations in the video below:


Combine beautiful layouts with effective data viz in a monthly report like this template for a textile production company. Use data visualizations like the line charts on page 6 to show essential information about your company’s efforts during the last month. You can also use it to compare this and the previous year's exact month and date to provide a quick YoY growth analysis.
Visme's data visualization options are varied. Line charts, for example, can be customized to look like straight lines, wavy lines or steps with or without risers. On page 6, both visualizations are line graphs but with different type settings.


Monthly reports aren’t always documents; they can also be slide decks. In this case, a presentation with bold headlines and a unique color combination that evokes a modern business mood.
Present your monthly analytics, KPIs, click-through rates and cost per acquisition stats across several minimal-style slides. Complete the report with milestones, campaign updates, upcoming goals and next steps.
If you need more slides for your report, add them easily from the slide library. Choose from hundreds of slide types you can easily customize to match the rest of the presentation.


Create an aesthetic monthly report to present your team’s performance metrics, website analytics and upcoming projects.
This monthly performance report template features visually appealing photos throughout. You can search Visme's vast photo library for others you'd like to use and edit them using the AI Edit Tools. Some things you can achieve include removing unwanted objects or backgrounds and upscaling or deblurring any uploaded image.
Share your report internally with stakeholders by sharing a live link with a password-protected entry. Track who has seen your report by checking the analytics dashboard inside your Visme account.


Keep things simple but engaging, using a template that shares just enough to give an overview of your monthly operations. Add more visualization pages by duplicating a slide and customizing it to fit your needs.
This monthly report sample uses full-color backgrounds to highlight the information on its pages. The serif font offers a sense of elegance and order, and paired with a clean sans font, balances out effectively.
If you need a wider selection of operation-focused reports, check out our guide on Operational Reporting: 10 Best Templates & Practices to Use in Your Company.


Share invaluable information with stakeholders using a clean and attractive design that inspires conversation and gives clarity.
Unify the colors across the pages by using images that have the same colors as the design elements, accents and backgrounds. This template achieves that with whites, grays and blues; an ideal combination for a health brand.
Share the document with stakeholders as a printable PDF, a digital PDF, a digital file or a flipbook. Add a password-protected entry to ensure that only relevant stakeholders have access.
The data visualization options in Visme are vast. One of the best examples is the map maker. You can use it to visualize geographical data in a number of ways. In this monthly work report template, the map visualizes the locations in which the project has bases.
Other map options include showcasing where there are more events, sales, fundraisers, etc. You can choose to use a map that shows the entire world, continents, regions, countries or departments. Inputting the data is easy; the map maker has a settings panel where you can add it in.


Monthly reports don't have to be overcomplicated or elaborately designed; at the end of the day you want to make it as straight to the point and hassle-free as possible for anyone reading the report, including yourself.
The principle of "less is more" is epitomized in this simple monthly reporting template. The template reduces the number of visual elements that your readers need to take in. This lets them quickly absorb and digest all the information in a short amount of time.
The monthly project report template is designed for digital marketing teams to show their monthly performance. However, you can customize it for any business regardless of size or industry. Finance teams can use it to visualize the company's financial health.
Plus, if you want to simplify your monthly report even further, try creating a one-pager report or an Amazon six-pager instead. By opting for either the six-pager or one pager format, you can work smart and not hard when it's time to fill in the information.
When you're editing your report, be sure to use Visme's dynamic fields. It lets you insert your information and automatically assign any necessary value. The best part is that you can update all the values in the fields across multiple projects at once.


Are you looking for a template to create a report on how multiple departments across your organization perform?
Customize this creative report to match your brand, niche or industry with ease. You can swap out images and brand colors for your own or use them as inspiration for your next report. This template comes equipped with marketing and sales sections that speak on organic search performance, paid advertising performance, social media performance, ROI, and more.
Give your reports a more realistic feel using Visme's interactive Flipbook effect. Your readers will feel as if they are holding an actual document with this feature.
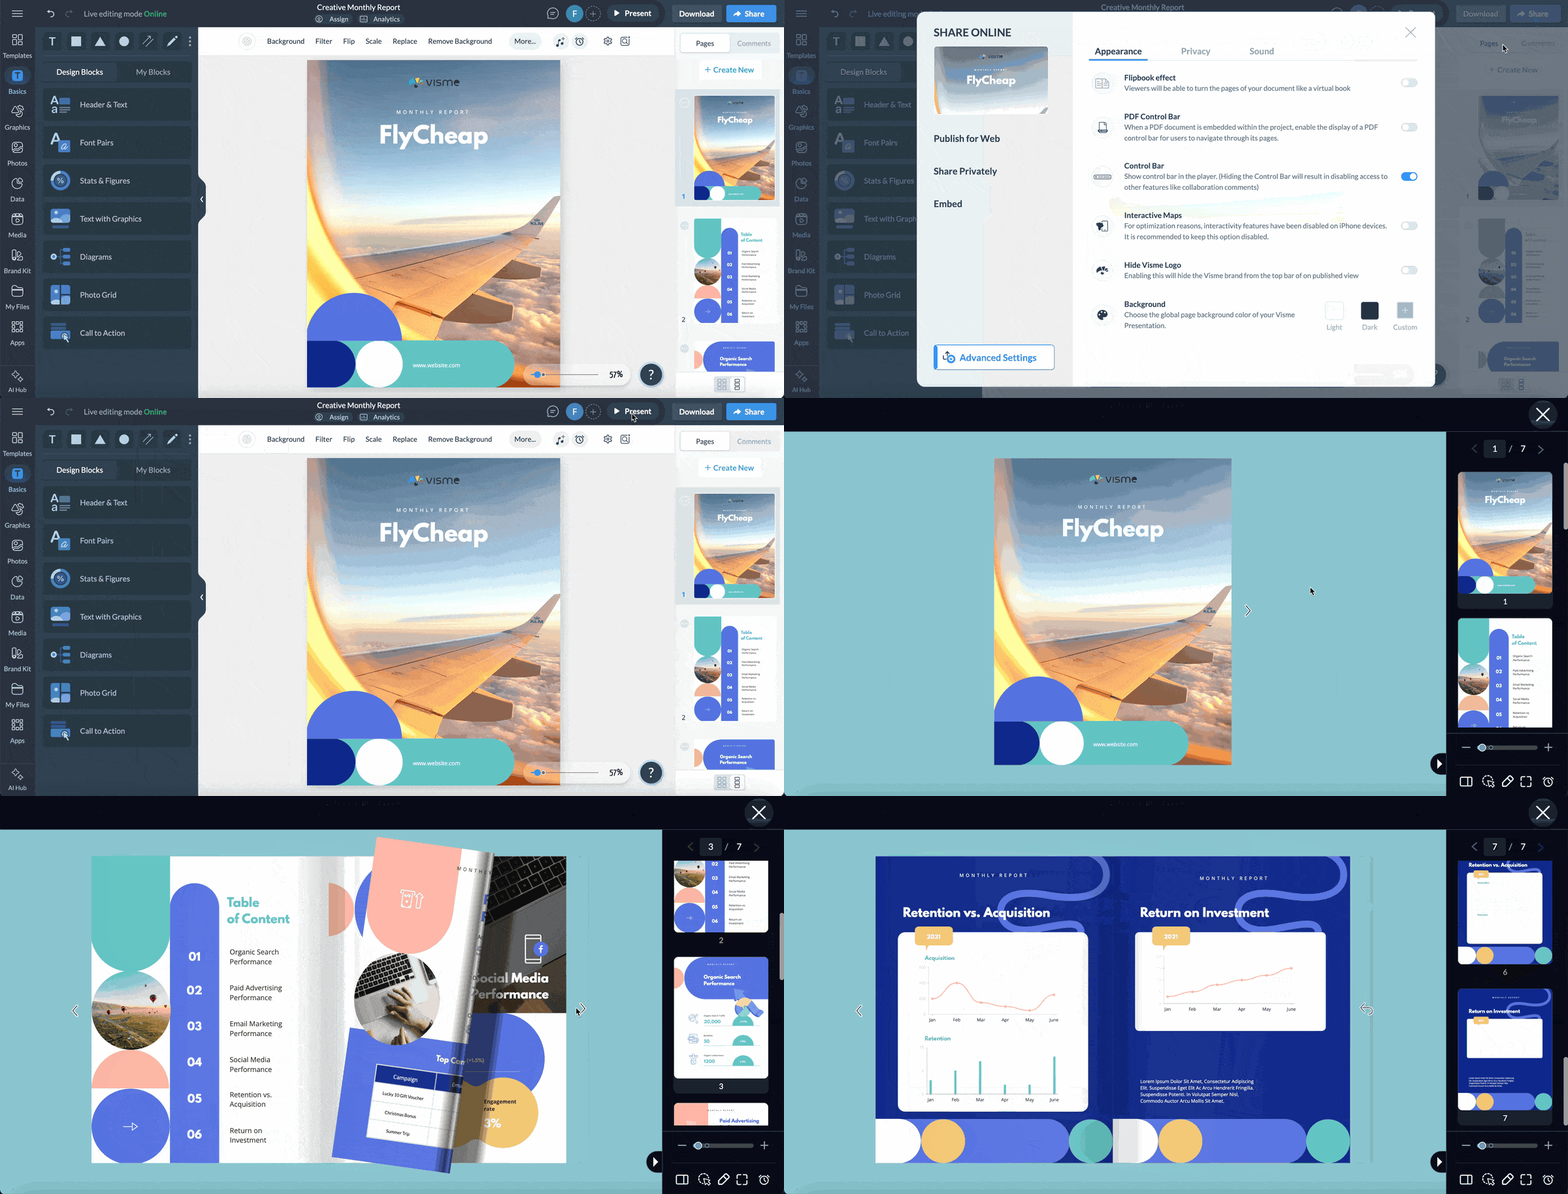


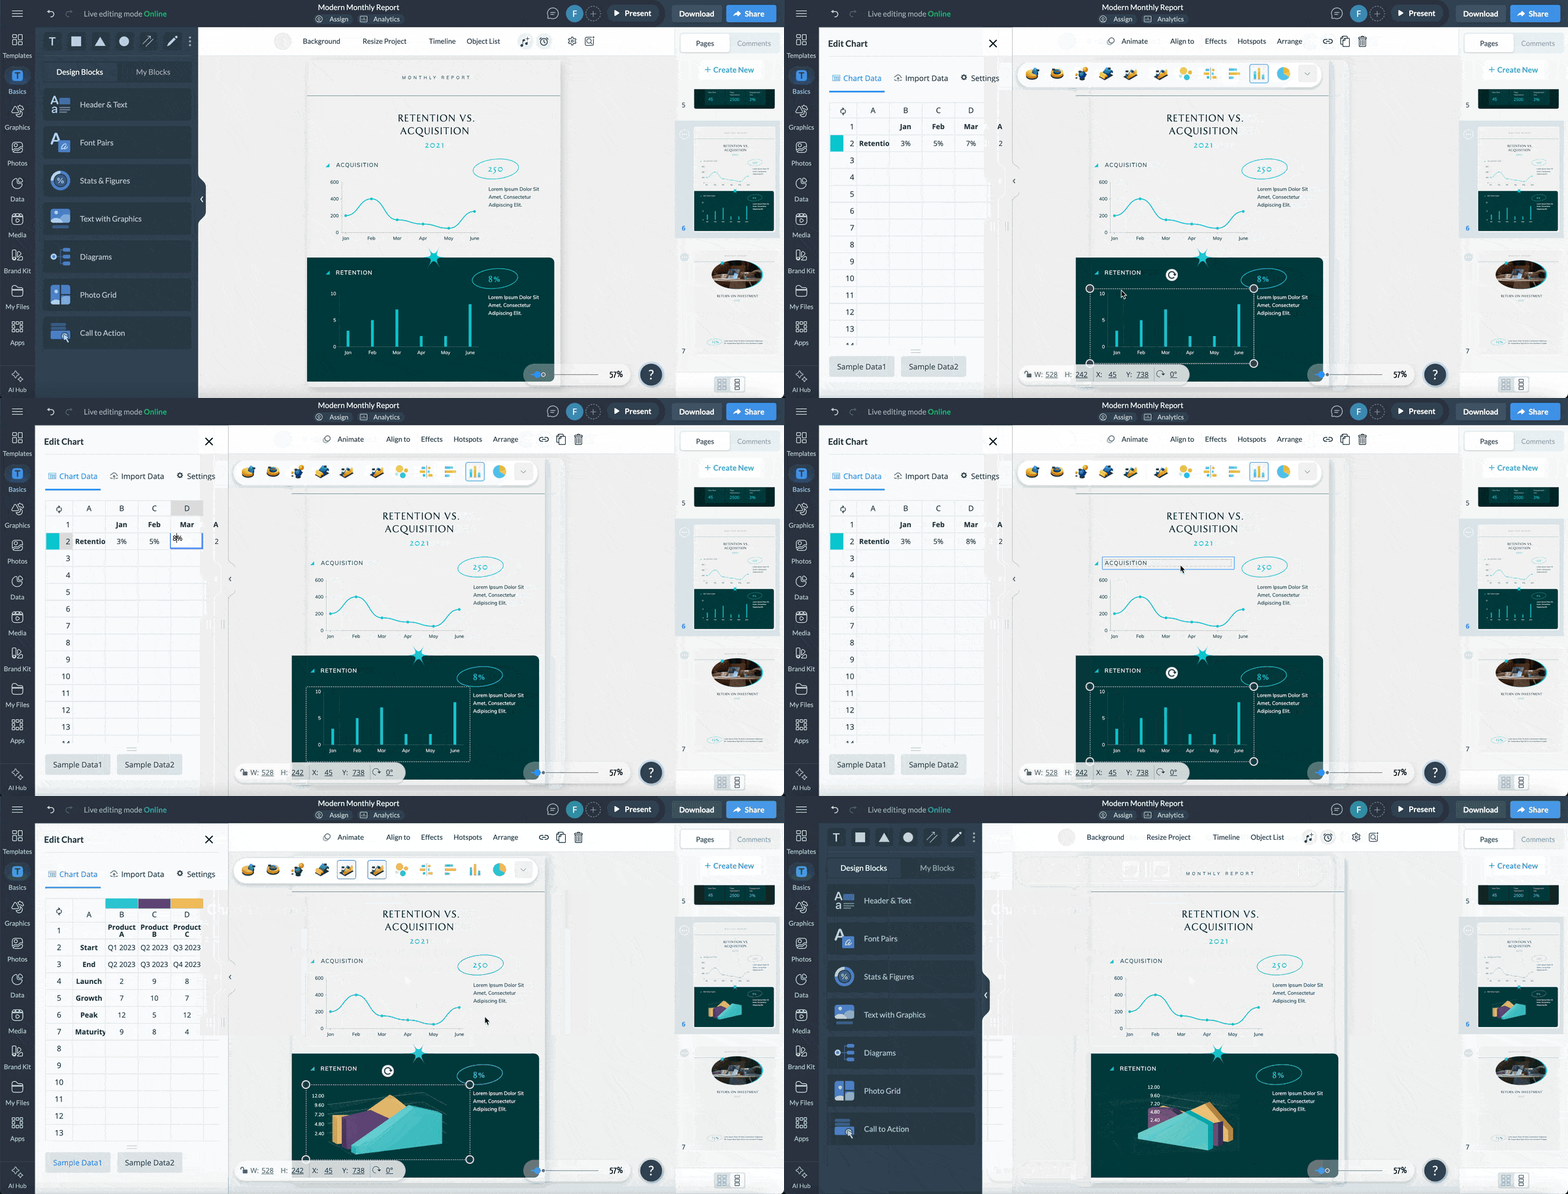
The bold colors, clean lines, bright hues and stunning images make this monthly client report template unique. Also, the vertical bar graph and line chart to show the retention, acquisition and ROI take it to another level.
Visme offers a wide range of charts and graphs templates you can use and replace the pre-existing ones in this template.
Now, let's discuss the purpose of a monthly report and why you should create one rather than just stick to a weekly or annual report.
The best part of creating a monthly report is that it helps you stay organized, focused and on top of business activities. Your business will grow in different ways every month. You may have more or fewer clients than last month. That's okay!
A monthly report keeps everyone aware of new opportunities as they emerge, so your team can act on them quickly.
At the end of the day, you want your team to make informed decisions. If you don't track your progress and learn from your data, it's impossible to know whether those decisions are working.
Creating a culture of data-driven decision-making is important because it will help improve the quality of ideas from each employee on your team. It's also an excellent way to measure their performance in their roles and what needs improvement.
A monthly report is an excellent way to track your company's performance over time. It shows you how your business is performing month after month and year after year. It can also serve as a monthly checklist to review tasks that need to be done or have been completed.
The report will help determine if you need to adjust your marketing strategy or sales approach. This will help you understand what works best for your business so you can keep doing it and make it even better.
The monthly report can help identify problems before they get out of hand and ensure that your team knows how to fix them if they arise. For example:
A bug in the code could be identified as soon as users or testers find it. A customer could bring up an issue with the documentation before they have time to complain down the road.
Without visibility into what actually moved the needle last month, it's hard to know what deserves your attention this month. A monthly report solves that by showing you which tasks drove results and which ones ate up time without much to show for it. That makes it easier to rank what's next based on impact, not just what feels urgent.
A monthly report helps you stay focused on productivity. It ensures you don't get distracted by unimportant tasks and that your tasks don't get out of hand. This will help ensure that you have time to work on the most important initiatives and complete them faster.
Before creating the monthly report, you must decide what to include. You can get to the point by reporting on your sales or revenue growth. However, if you want to do a complete analysis of your business and make adjustments accordingly, you need to dig deeper.
So what should be included in a monthly report? Here are the elements that a well-written monthly report should include:
Your monthly report should start with a branded cover page, as it's the first thing your readers will see. It's your opportunity to showcase what the report is all about and engage your readers right away.
It should include your company logo, the date (and month/year), the report's title, and who created it. Here is an example template that includes a stunning cover page.
The table of contents will show the reader where the various sections of the report are located. Write it on a separate page, and include the headings and page numbers for each section.
For a highly effective TOC page with many sections, add internal hyperlinks to each section name. This will instantly take the reader to that part of your report.
What are your objectives in creating and presenting the monthly report? Include them on a separate page, right after the table of contents. This will give readers a detailed overview of the report, similar to the template below.
Briefly explain the project status to help everyone understand what has been accomplished and what is yet to be accomplished.
Here, you can include the assigned tasks, hours spent, the project deadline and other project-related information. Even if you’re creating a monthly project report, a project status is still needed.
If you are planning to create a project status report, use our detailed guide on writing a project status report.
Metrics and key performance indicators (KPIs) are the most critical tools for evaluating the effectiveness of your team's efforts. To ensure your monthly report provides the most actionable insights into your performance, relate the metrics to your goals and strategies.
Planning for the next month is one of the primary goals of writing the monthly financial report. Provide information on what the team intends to achieve in the following month. This helps you prepare for any challenges and predict your team's workload.
Look at the ‘future considerations’ page of this monthly report template.
You can include your team members in the report to provide a clear picture of their responsibilities. An organizational chart can be the best way to show your team structure.
This customer service monthly report template is a great example. It includes a separate page that displays requests closed by the team members.
Use Visme's organizational chart maker to edit the free templates and create a professional org chart in minutes. Then add the organizational chart to your report using the Visme editor.

Now let’s break this into two parts: organizing your content and creating the report.
Before you start writing, ensure you know what you want to achieve with your monthly report. The rest of the process will depend on your goals. Here are some example goals of creating monthly reports:
If you are struggling to achieve your goals, it’s possible you’re not setting them correctly. Learn how to create SMART goals and reach them.
Use the template below or any of these 11 goal-setting worksheet templates to set achievable goals.
The data and information you gather from the previous month are the building blocks of your report. You need at least a few pieces of information to write your report, but if you can get more, even better! To gather this information:
Once you have gathered all the data you need from the various departments, it's time to analyze them. It will help you determine what led to specific outcomes and what caused errors. Then create an official statement explaining specific causes, consequences and the actions taken.
Your report should offer solutions to problems identified in the previous month. These solutions should be measurable and time-bound so that you can track their progress. For example, if your company has been experiencing slow sales growth lately, you might want to strengthen your marketing strategies to boost sales.
If you don't have any specific action items in your report, try writing down some ideas for future reports. It will help improve business operations or make them more efficient over time.
Follow these steps to create your report in an ideal monthly report format. You have two ways to start: build from a template, or generate the whole report with AI. Here's how each works.
Pro Tip: Once you've built your first report, save it as a custom template. Open the project menu, select Save as Template, and it lands in your workspace for next month. You rebuild the structure once, then reuse it every reporting cycle with fresh data.
Use Visme's AI Report Writer to generate a fully customizable draft of the entire report. Describe the report you need and upload any existing copy or content you might have. The AI will ask if you have a brand kit and, if so, if you want to apply it. Make your choice and then pick one of the suggested styles.
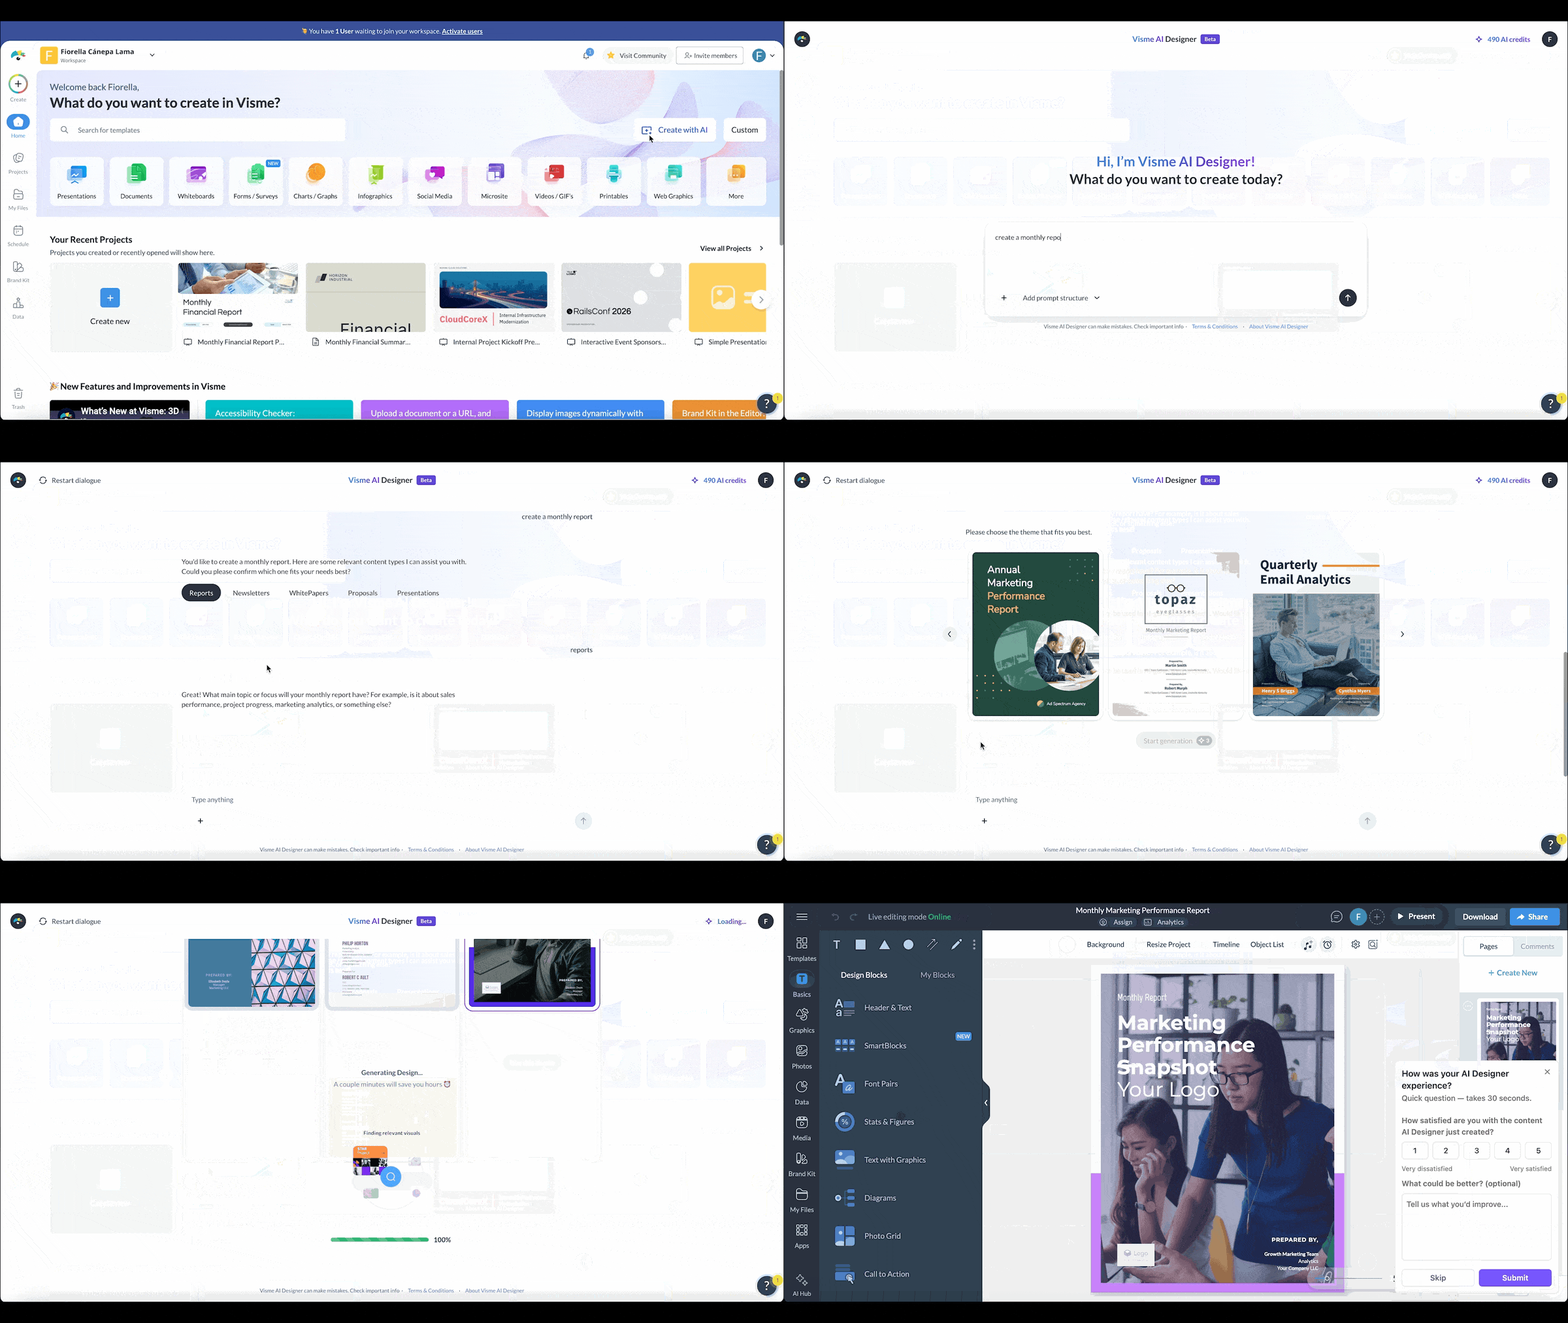
Open the generated report draft in the editor and move to step two.
A good template gives you the full structure up front, so all you have to do is add in your content. Choose a monthly report template from Visme's library and customize it to fit your needs. You can also choose to edit it with AI and upload your copy.
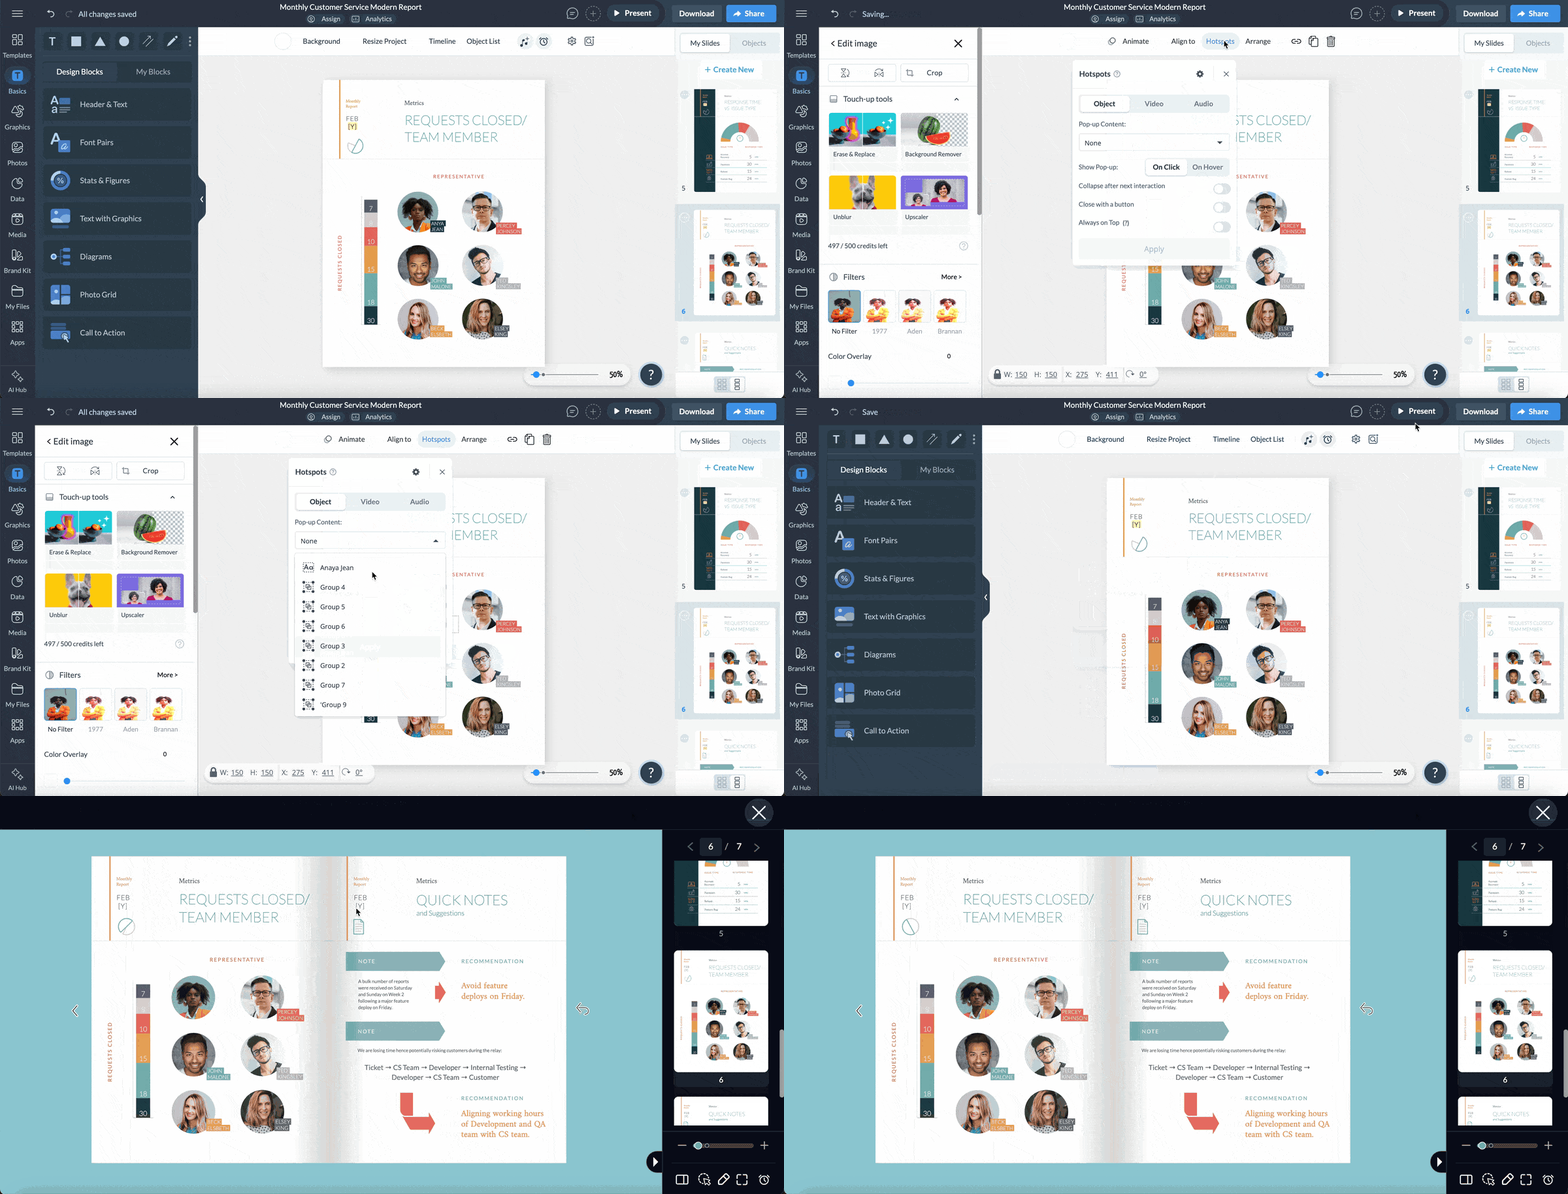
If you prefer to do it manually, replace the text, swap the background, images, fonts, colors and icons, and adjust the layout to match your brand. Make your report interactive by adding a clickable menu, an interactive table of contents, hover effects or pop-ups.
Create an eye-catching cover page to ensure your report looks as professional as possible. It grabs your readers' attention and invites them to keep reading.
All the monthly report templates in Visme's library include a stunning cover page. Customize them according to your brand guidelines to make them more engaging.
Use the brand guidelines infographic template below to organize your company’s brand assets in an easy-to-reference format for your team.
Watch the video below to learn how to create an amazing report cover page.
You might want to present some statistics and figures to show your business growth from the previous month. Visme's data visualization tools will help you turn complex data into stunning visuals.
The data visualization tools include 30+ widgets such as radial gauges, progress bars, population arrays and more.
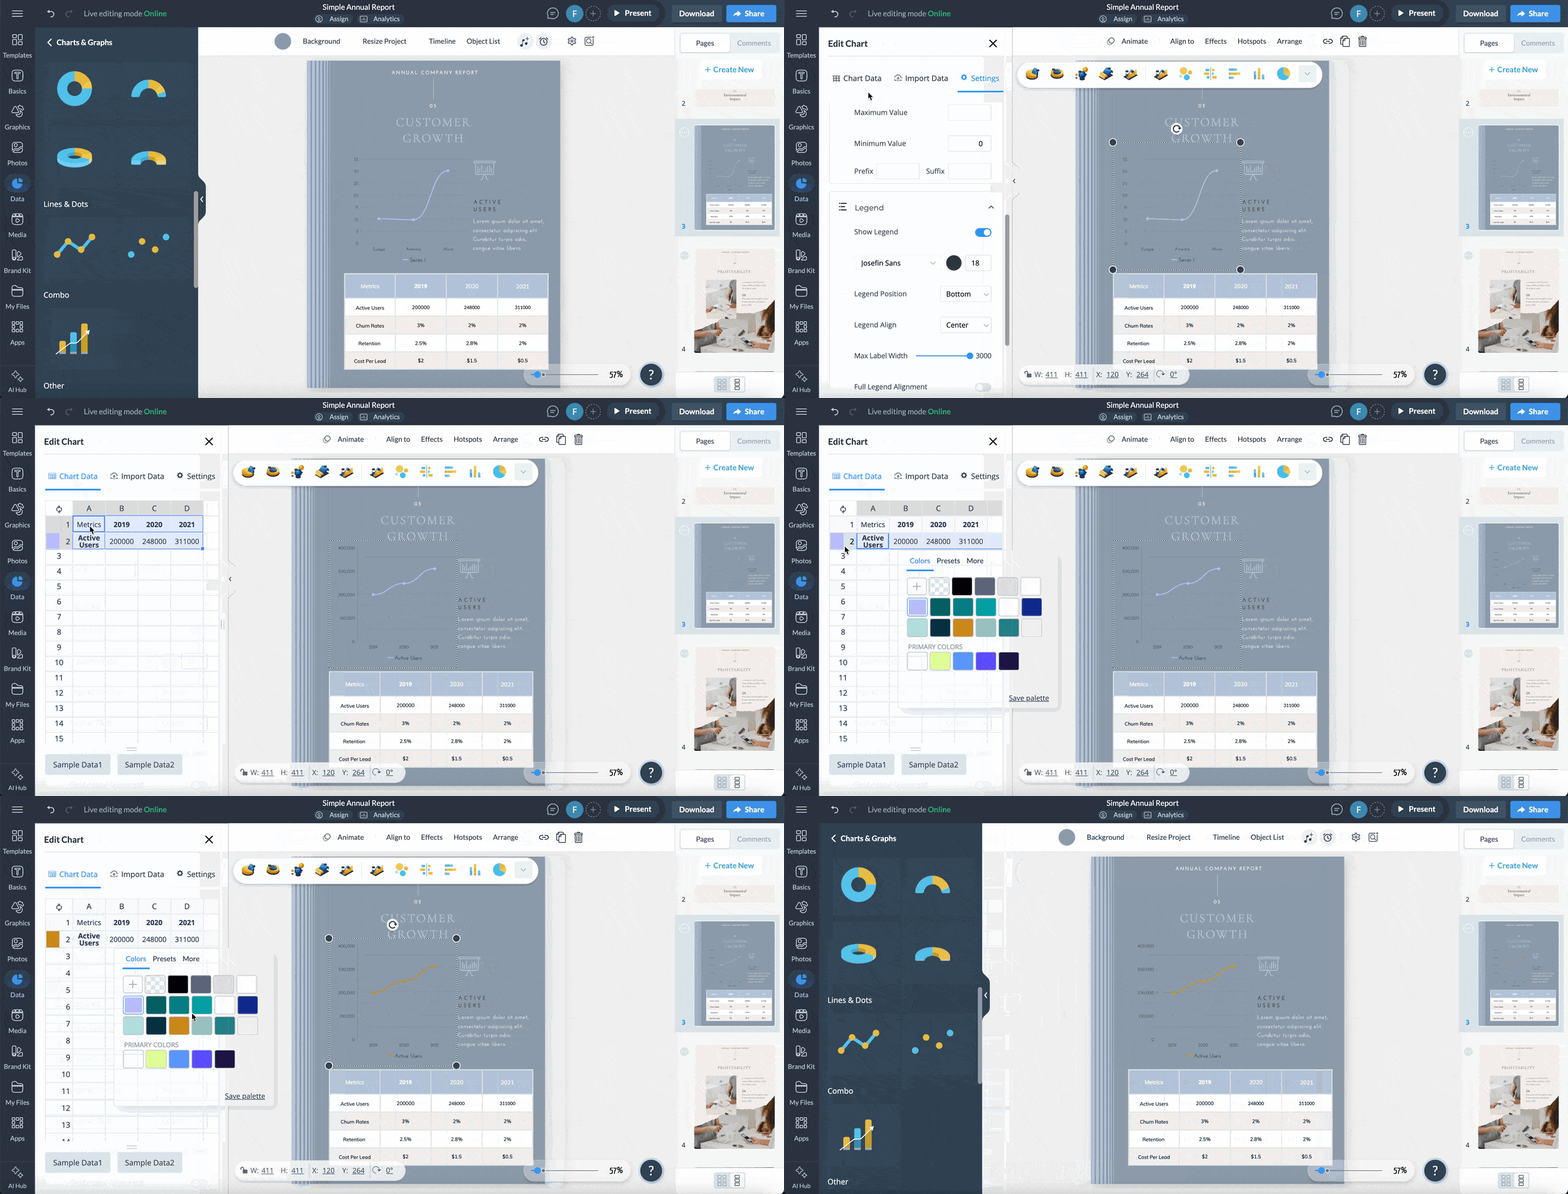
Additionally, if you want to present larger data sets, Visme offers 20+ charts, graphs and even interactive maps.
While creating your monthly report, keep your brand identity in mind. Your monthly report should be consistent with your branding regardless of its type. Use your company logo, brand colors, brand fonts and other branding elements.
Visme's brand design tool will allow you to save your branding elements and automatically add them to your report. Learn how to create a branding kit for your business in Visme.
Here is a detailed video to help you do that.
Creating the monthly report requires input from various stakeholders across the organization. You will need to collect data, feedback and other information to write the report. So, include your key stakeholders in the process.
With Visme's collaboration features, you and your team can work together on the same project in real-time. Ask your team to collaborate by sending email invitations or via a link. They can leave comments or make changes to the document and the changes will appear live.
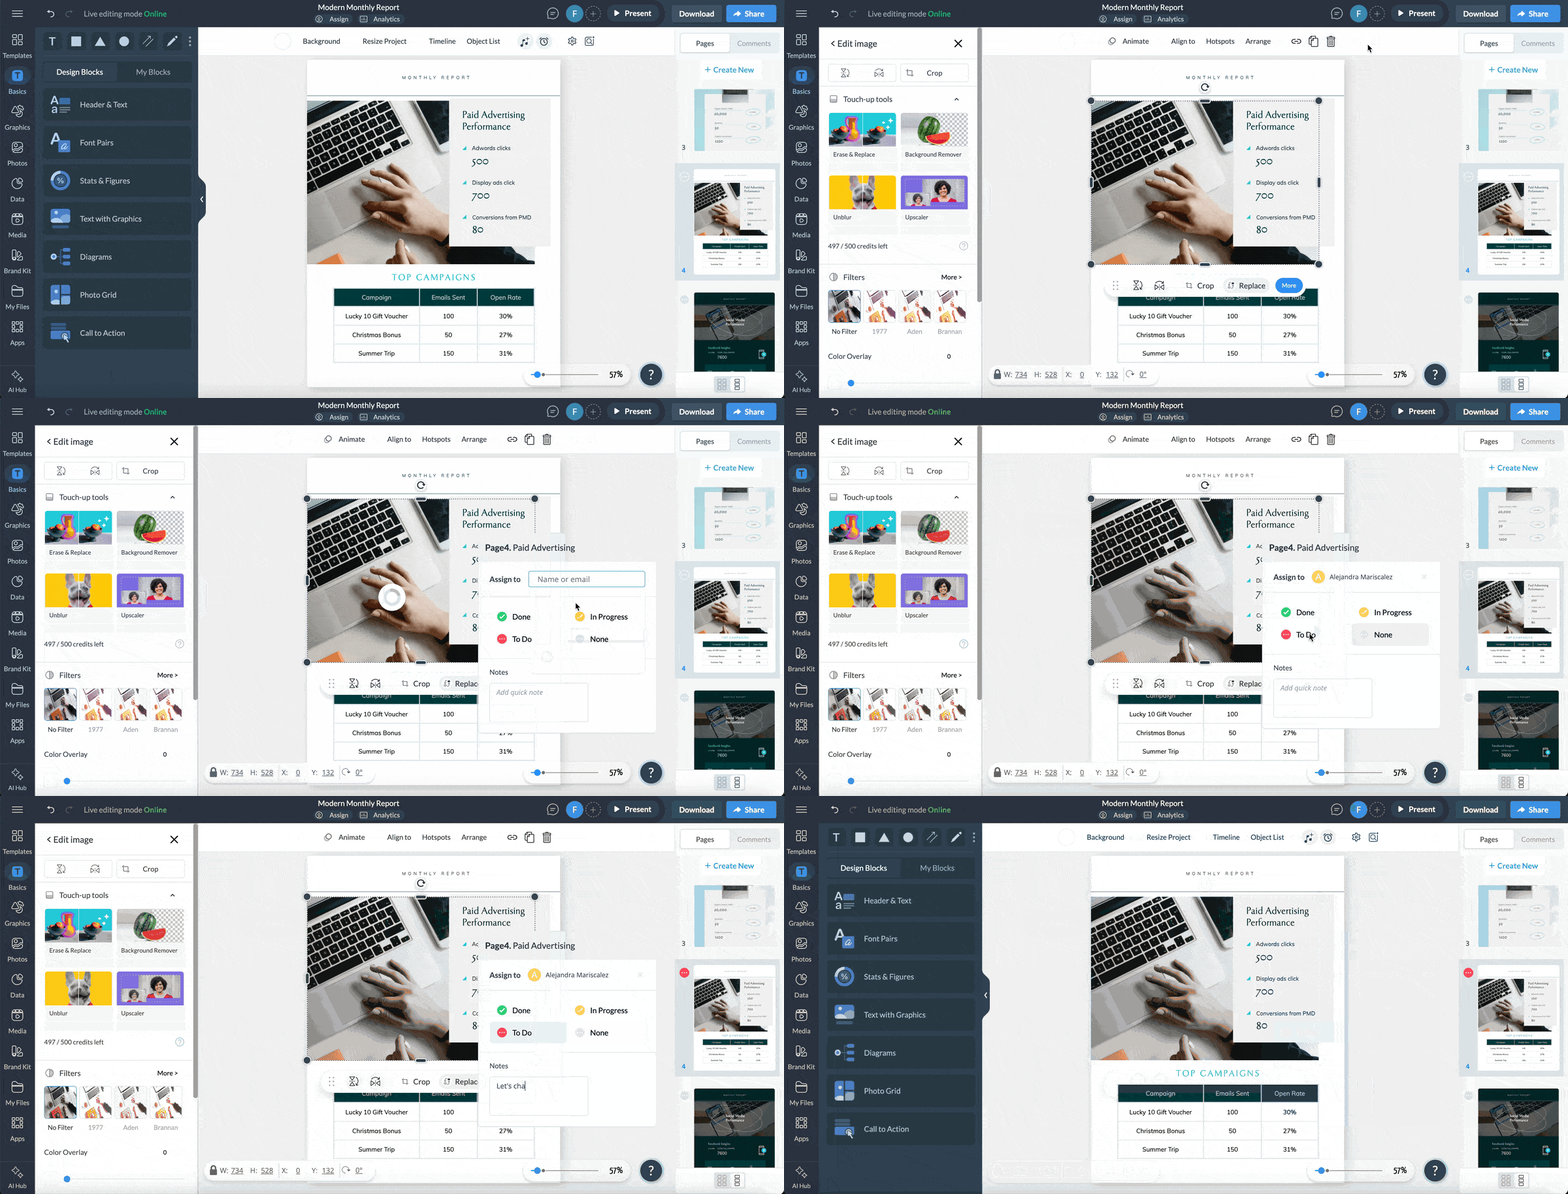
You can also assign tasks to people on your team so they know they’re in charge of updating a section of the report each month. This video shows you how it works:
Watch the video below to learn more about Visme's collaboration features.
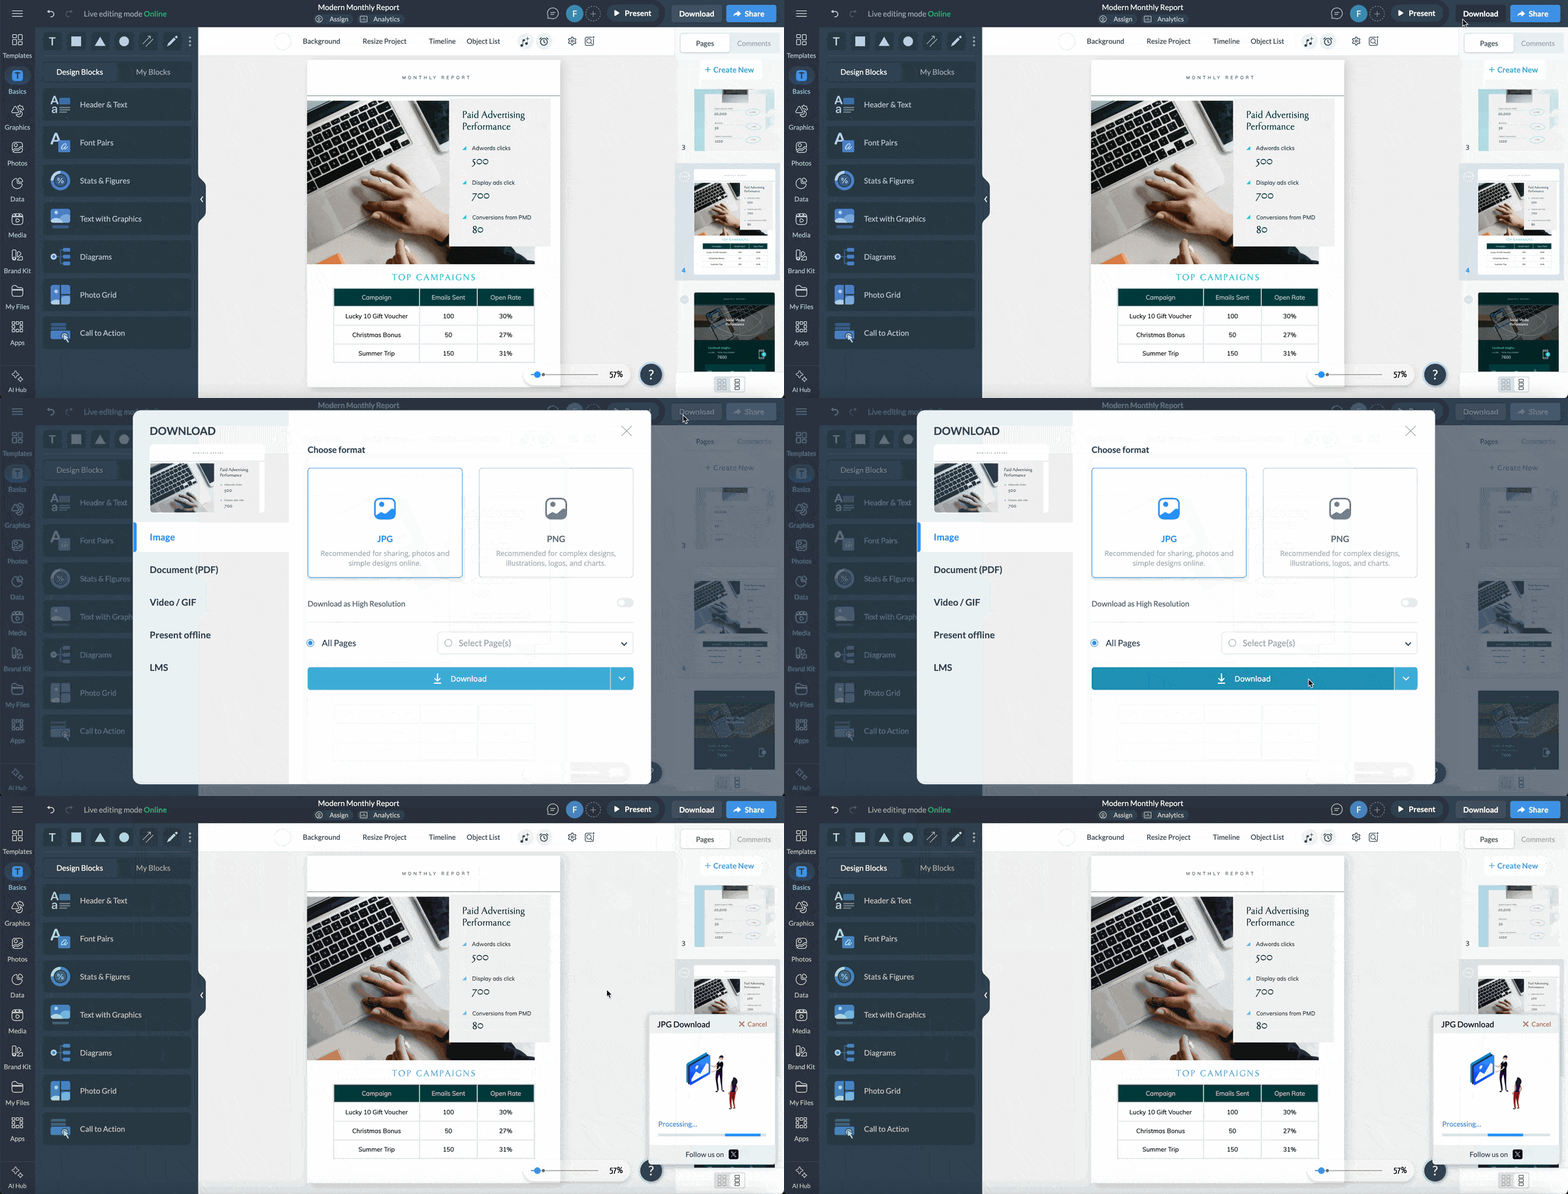
Once you are done editing your monthly report, it's time to download or share it.
In Visme, you can download your report in various formats, such as JPG, PNG, PDF, HTML5 and more. Alternatively, you can share your report online via a link or embed it on a web page with a snippet of code.
Use an AI report generator, such as Visme’s AI Report Writer, to build a report from a text prompt. Describe the sections you need, pick a suggested style, and the tool generates a ready-to-edit report with layouts, charts and placeholder copy. From there, you refine the content and swap in your own data.
A good report is clear, accurate, concise, well-structured and relevant to its audience.
Clarity keeps readers from misreading the findings, accuracy makes the data trustworthy, and a logical structure helps people find what they need fast. Relevance ties every section back to the decision the report is meant to support.
The five basic parts are the title page, table of contents, introduction, body and conclusion. The title page and contents help readers navigate; the introduction sets up the purpose; the body presents the data and analysis; and the conclusion summarizes findings and next steps. Longer reports often add an executive summary and appendices.
Start by setting the report’s goal, then gather the past month’s data, analyze it, and organize your findings into clear sections. Cover your objectives, project status, key metrics and plans for next month, and lead each section with the takeaway before the detail. A template speeds this up by giving you the structure before you fill in your numbers.
Set up a spreadsheet with your key metrics in columns, enter each month’s data in rows, then use formulas and pivot tables to summarize the numbers. Add charts to visualize trends and a summary tab that pulls the highlights together.
For a more presentable version, export the data and drop it into a report template built for sharing.
Visme is the fastest option, combining written analysis, live charts and a shareable link in one report maker. Choose a template, customize it in the editor or with AI, then share it as a link, PDF or presentation.
Other tools include Word or Google Docs for text-heavy reports, Excel or Google Sheets for data, and PowerPoint for slide presentations.
A monthly report can help you track your business's health and make changes to further strengthen it. But creating a monthly report shouldn't be difficult and time-consuming.
Use this guide’s step-by-step instructions, along with the monthly report best practices we share, to create monthly reports quickly and confidently.
Sign up for Visme's online report maker today to get started!
Design visual brand experiences for your business whether you are a seasoned designer or a total novice.
Try Visme for free