


Typography Infographics: 12 Inspiring Examples & Techniques

Last Updated: 9/25/2019
The main difference between Visme and Venngage is that Visme is a well-rounded visual content creation tool for infographics, presentations, documents, videos and more, while Venngage has a primary focus on infographics while other types of content are more of an afterthought.
To help you decide whether Visme or Venngage is the best infographic design tool—or content creation tool in general—we’ve put together a full comparison of these two software and their features.
Before we dive into our full analysis, it’s important to note that Venngage is an infographic maker before anything else. The tool was created to simply make infographics online.
They’ve started to add other features after the fact, but their sole purpose remains: it’s an infographic maker, and trying to create other designs is a bit clunky.
For example, there’s no way to see all of your slides at once or easily navigate between them when creating a presentation, and editing background patterns and colors in your social media graphics is confusing and not very intuitive.
Visme, however, was created as an all-in-one design tool.
Whether you want to create interactive presentations that go beyond static slides, custom reports, infographics, on-demand webinars, or social graphics, Visme will allow you to do all of that with full granular control.
In addition, the editor experience adheres to the type of content you’re creating. Working on a presentation? You’re easily able to add new slide layouts, animations and transitions.
Creating a new infographic? You can quickly add new blocks to the end of your design to add more and more content. And the list goes on.
You can continue scrolling to check out our full comparison of these two infographic designers, or you can scan the infographic that we created right in Visme to catch the comparison at a glance.

Let’s start at the very beginning, shall we? Before you even start your design, you need to choose an infographics template to help you outline your content.
The homepage of Venngage’s website states they have about 100+ infographic templates to choose from to help its users get a head start on their new design.

Venngage’s template categories include Informational, Statistical, Process, Geographic, Timeline, Comparison, List, Fun Data, Tutorial, Nonprofit, Human Resources and Real Estate.
You can preview the template in a popup before deciding if you want to edit it and use it for your infographic or not.
Venngage’s template library also allows you to search for keywords similar to your topic and filter out results based on your plan type and your preferred page size.
Visme offers well over 500 different infographic templates in the following categories:
Anatomical, Art, Bar Graphs, Business, Comparison, Concept Maps, Education, Environment, Fashion, Flowchart, Food, Health, Hierarchical, How to, Informational, Line Graphs, Location, Maps, Marketing, Nature, Non-Profit, Organizational Charts, Pie Charts, Process, Report, Resume, Scatter Plots, Science, Sport, Timelines, Venn Diagrams.

Edit and Download NowCustomize one of these infographic templates and make it your own!
Visme’s template library also allows you to search based on keyword and seamlessly browse through each category and type of infographic design to find what you’re looking for.
If you find a template you like, you can view it and read all about its specs in a new tab before deciding to edit it and make it your own.
After you choose your template, you move into the design dashboard to start editing the design and adding your own content into your infographic.
The ease of use of the dashboard as well as the features that you have available is important in being able to come away with a visually appealing design that helps your audience quickly learn more about your topic.
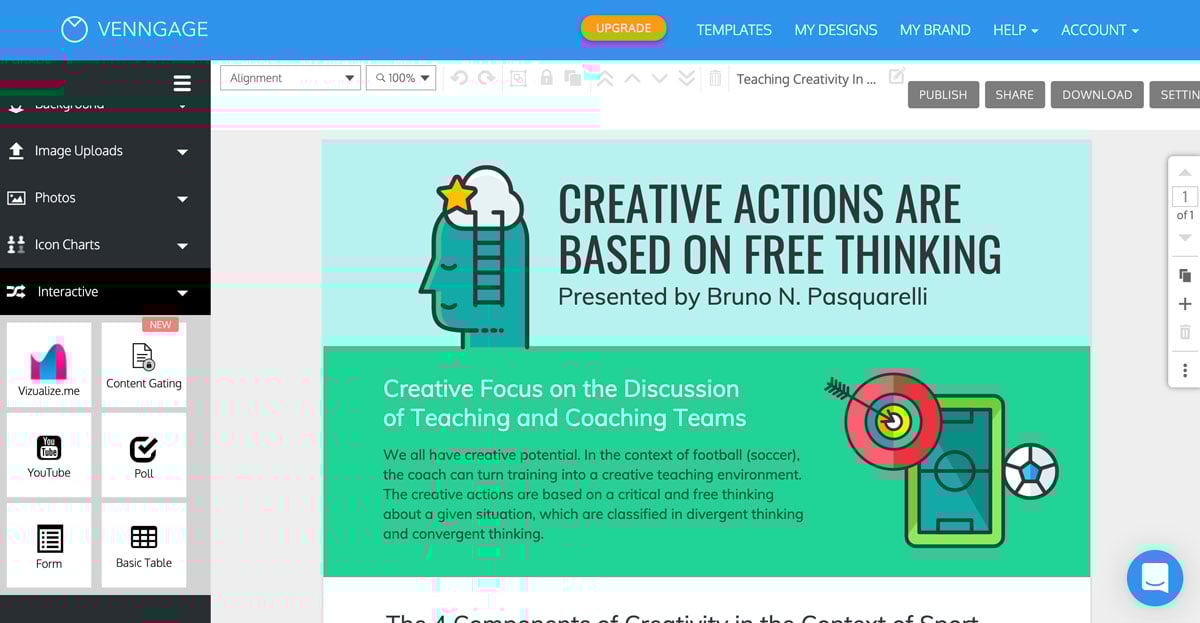
While Venngage’s design dashboard may look pretty on the surface, it’s hard to find the tools you need to get the job done.

The sidebar and top toolbar aren’t very intuitive and it takes a lot of digging around to find what you’re looking for. And anytime you hit “Undo,” the entire design takes a few seconds to refresh instead of quickly reverting your last edit.
Venngage has a drag-and-drop tool editor that’s a lot like Visme’s. You’re able to move your design elements anywhere on the screen, which is a must-have for an infographic designer.
One great feature Venngage has is its text blocks that allow you to easily insert already designed snippets of text.

These can help to spice up your infographic design so you’re not using regular text boxes or having to worry about designing your own text blocks. Content blocks make it much easier to design an infographic quickly.
Visme’s design dashboard is extremely intuitive and does not take several seconds to undo your latest edits, which is a breath of fresh air.

Once you click on an item, a top toolbar will appear with each of the feature you’re able to edit. Visme also offers several text content blocks in its right sidebar as well as dozens of infographic content blocks to easily update, extend and build out your infographic.
When you scroll to the bottom of your current infographic design, there’s a button that allows you to add a new block. If you click it, a blank slate will be added to the bottom for you to continue building out your content.
But if you hover over the Add Block button then click From Template on the side, you’ll be able to choose from one of our many premade infographic content blocks to easily drop in and edit.

There are several categories of content blocks to choose from based on the type of information and format you need to add into your infographic.
You can easily drag the end of your canvas up and down to adjust the amount of space in your existing content blocks.
And if you break your infographic sections into blocks, you can even add more space in the middle of your infographic without messing up the rest of your design.
Having a brand kit allows you to easily create designs in your company’s colors. While there are many different ways to choose a color scheme for your infographic – i.e., based on its topic, using a color theme – infographics relevant to your brand should match your brand.
In Venngage, users can add in their own logos, fonts and colors to their brand kit.

They also have a neat feature that allows you to input your business’s URL and it pulls your logos and brand colors automatically, but through all of the times we’ve tested it, it’s more inaccurate than accurate.
It tends to do a great job of pulling the logo, but it has a hard time pulling all of the colors or even the right colors sometimes.
There were a couple of times it even gave us an error that it couldn’t pull the branding and we needed to set up the brand kit manually.

Users can upload their logos, add their color palette by inputting each hue’s hex code and choose or upload their brand fonts.
Visme’s dashboard also allows its users to add in a brand kit. There are sections for fonts, colors and logos, but users can also save branded templates to its brand kit and create branded links.

You can add multiple color palettes and even indicate which is a primary color scheme and which is secondary. However, you’re still able to add as many color palettes as you’d like.
Furthermore, users are also able to add color themes, giving them the ability to match their design’s color scheme to their brand with just a single click.

Although many infographics are saved as image or PDF files and uploaded onto a website or social media, there are still many great benefits to adding interactivity.
If you embed an infographic, interactivity allows you to create clickable sections that lead to sources, other pages of your website, pop-up elements and more.
Venngage offers a few different ways to create interactive content with their infographic designer.
Users are able to add polls, YouTube videos and forms to their content, as well as link elements in your infographic to webpages.
They can also add a link to a YouTube video to embed it into their content, but there are no other embed code options, and no audio options available either.
In Visme, users can link elements to a webpage, another block in your infographic which is extremely helpful for long infographics or to pop up another element within the infographic. The latter can create a fun Q&A or hide and seek component.

Visme users can also embed any type of content as well as upload or record audio to add into their infographic.
Next, let’s talk about animation.
Again, this isn’t necessarily seen if infographics are saved as images or PDFs, but embedding animated infographics on your website or within a blog post can be a great way to stand out from the crowd.
Venngage doesn’t offer any type of animation options in its software, just another indicator of why it isn’t ideal for other types of visual content like presentations.
So if you want to add animation to your infographic, you’ll have to use Visme.
In Visme, users have six different animation options to choose from when animating elements.

Plus, Visme has a built-in embed option with any of its content types to help make it even easier to share unique interactive and animated infographics.
Charts and graphs are also automatically animated with a bounce effect to grab users’ attention. Just be sure to stick to a single animation style throughout your infographic so it doesn’t get too cluttered.
Plus, each time you create an infographic in Visme, it’s automatically parallax, meaning your design elements appear on the screen as you scroll down the length of your infographic. Cool, right?
Icons are a great way to spice up a design or provide visual context for a blurb of copy within an infographic. Because infographics are all about finding that balance between text and visuals, icons are going to be your best friend.
So you want an infographic designer that has plenty of icons and graphics for you to choose from.
Well, you’re in luck here. Because both Venngage and Visme have over 10,000 different icons for you to choose from and a search bar to make finding them easy.
When you click the Icons section of Venngage’s sidebar, you’re met with a list of categories to browse. Click on a category to find flat, outline and multicolor icons.
Many of the multicolor icon options are for premium account holders only. The multicolor icons also do not give users the ability to customize the colors.
Users are able to change the single color of a flat or outline icon, but multicolor icons are not editable.
In Visme, icons are also broken down by category. Once users choose which category they want to browse, they get to choose which type of icon they want to use in their design before browsing all icons of that style.
Visme has four distinct icon styles available for all users: flat, multicolor, outline and isometric. And users can customize most multicolor and isometric icons to match their design by clicking it and adjusting the available colors.
Another great resource to have while designing is photography. You can use photos in many different ways to enhance your infographic and visualize your topic in a more realistic manner than icons and graphics.
Venngage has another section in their sidebar that allows users to search for stock photography to use within their designs.

The platform includes various photos from stock photo sites Pixabay and Unsplash.
If you want to upload your own photos, you can do so from their Image Upload tab. Users are able to upload up to 500 of their own images.
Visme also has a massive stock photo library for its users to browse through. You can find it in the Graphics tab in the left sidebar where you can choose to search through icons (like in the last point) or photos.

Visme also partners with Unsplash to offer its users hundreds of thousands of stock photos to choose from, but you can also search just for cutouts.
Cutouts allow you to add a photo embellishment to your design without any type of background. For example, if you’re designing an educational infographic, you can easily add a couple of pencil cutouts as an accent without disrupting the background or colors of your design.
One of the most prominent tools to use in an infographic is a data visualization. This could be a chart, graph or data widget that takes numbers or statistics and represents it with a visual layout.
While not every infographic needs to include these (text-only infographics are also extremely powerful in marketing and helping your audience digest information), they’re still a must-have tool in an infographic designer.
Venngage has 35 different types of data widgets, from line graphs to pie charts, bar graphs to radials and more.

Choose your chart type or data widget, add it to your design then click Edit Chart to input your own data. For large amounts of data, you can also add a link to a Google spreadsheet to import the numbers.
Visme has about 60 different charts, graphs and data widgets to help you visualize your data and statistics.

Edit and Download NowCustomize your own data visualizations!
You can import a Google sheet or an Excel sheet, depending on where you have your data. Or you can simply type it in manually, if you only have a few numbers to add in.
Visme’s charts and graphs are also automatically animated to grab your audience’s attention. You can choose from four different animation types in your Graph Engine’s settings, or you can choose to turn the animation off.
The data widgets are dynamic as well so that embedded infographics will update accordingly if the numbers are changed and you can add interactive effects so your viewers can click on them to see more information.
Once you’ve added in your icons, photos, data visualizations and more, you want to share your infographic with your audience.
When you finish your infographic design in Venngage, you’re able to download it as a PNG, PNG HD, PDF, or Interactive PDF – a PDF that includes hyperlinks. The Interactive PDF option is only available in their Business plan.
Free account holders can publish their infographics online and embed them onto a website, but must upgrade to a Premium account to download the infographic and share it on social media. Premium account holders are also able to create private links to share with others.
Free Visme customers can download their infographic as a JPEG as well as publish and embed their work. Standard plan users are given more download options, like PNG and PDF – and our regular PDF downloads automatically include hyperlinks.
Users can also create both public and private links to decide who is able to see their content. Visme also offers password protection so that only select users can access certain infographics.
Visme also offers HTML5 download, which gives users the ability to completely take their infographic offline while still maintaining all interactivity including audio, clickable areas, etc.
When you publish your infographics on Visme, you’re also given access to analytics to view their performance and track how many people are looking at your content.

This is not a feature that Venngage offers, so if you’re hoping to track views, visits and time spent on your designs, you’ll need to sign up for an account with Visme.
As we mentioned at the beginning of this article, both infographic designers have the capabilities for non-infographic design.
However, Venngage is first and foremost an infographic design tool, simply adding in other templates as a way to offer more options for its customers.
They offer 31 other types of templates including business cards, social media graphics, flyers, schedules and newsletters.
Visme, on the other hand, was created as an all-in-one graphic design tool from the start. Its purpose is to allow non-designers a way to quickly and easily put together essential graphics, presentations, infographics and more.
There are 38 other types of templates to choose from, like wallpapers, resumes, postcards, ad graphics, presentations and more.
Ready to start creating? Sign up for a new Visme account today and publish your first infographic in less than an hour.
Design visual brand experiences for your business whether you are a seasoned designer or a total novice.
Try Visme for free


![How to Make an Interactive Infographic [+Templates]](https://visme.co/blog/wp-content/uploads/2023/11/How-to-Make-an-Interactive-Infographic-Quick-Guide-8-Customizable-Templates-Thumbnail.jpg)


