Proven Product Specification Examples That Give You Clear Decisions

Managing a project is tough work. With lots of tasks to oversee, it can be daunting for you to keep up and provide updates on project status.
That's where project management reports come in handy. They provide clear direction, help you make the right decisions and increase your chances of success.
Not sure how to create a project management report? You've come to the right place.
This article will show you everything you need to know about writing a project management report and report templates to help you create one right away.
Or, if you want a quick and easy tool to get your report done, our AI report generator can help simplify the process.
Let's get to it.
Here's a short selection of 8 easy-to-edit project management report templates you can edit, share and download with Visme. View more templates below:


What Is a Project Management Report?
Why Is Project Reporting Important?
Project Management Report Use Cases
What To Include in a Project Management Report
How To Create a Project Management Report in 6 Steps
10 Project Management Templates to Use Now
Project Reporting Tips & Best Practices
Your Turn: Create Stunning Project Management Reports With Visme
Made with Visme Infographic Maker
A project management report is a document that provides information on the project's progress, performance and overall status. It serves as a key instrument for projects of all types and is used by key stakeholders, including:
The report visualizes your project's realities, peculiarities and performance during the project life cycle. Depending on the project size and complexity, you submit it weekly, monthly or quarterly.
Your report could be a one-page document with links and appendices. You can also decide to make your report more detailed. It's entirely up to how much your stakeholders want to see.

Project reports increase visibility and give you a complete insight into how your project is performing. But that's the tip of the iceberg regarding the benefits of creating one.
Let's take a look at the benefits of creating project management reports.
Project management involves many different layers and activities. As a result, there are many use cases for project management reports.
There's no one-size-fits-all structure and content for project management reports. The report content may vary depending on your company, project type and project management requirements.
However, no matter the business, industry, project type, your report should contain these key elements listed below.
This section should include special identifiers like:
This section should summarize the project's purpose, scope, activities, timelines and milestones, anticipated obstacles and more.
Create a detailed list of project activities, and tasks (pending, completed and upcoming). Also, visualize task dependencies to enable readers to track the relationship between different tasks.
Record timelines for each activity and the project start and end dates. If you're in the middle of a project, include data about the milestones completed and what's left.
The reader should understand who's responsible for certain deliverables and which aspects are being outsourced. Describe the tools, staffing and other resources used to achieve the project goals.
Mention which people or departments are in charge of various aspects of the project and the equipment, systems and programs they use.
Your project may run into anticipated risks or unexpected setbacks. These challenges may include scope creep, delays, technical failure, equipment breakdown, or insufficient funding.
Describe how you plan to mitigate these risks or remedy these challenges.
Discuss whether or not a client, internal team or department has requested a change to the processes or deliverables. Provide updates on pending and approved project change requests.
Discuss the actions taken to ensure the project results are error-free or meet the expected requirements and standards.
Provide details about the projected or allotted budget and how funds are spent. Explain whether the projected budget covers the project resources. Also, mention whether or not the project will be completed within the allocated budget.
Give a brief overview of the project's overall health. You can either write it or use visual aids like stoplight charts.
The goal of project reporting is to compile and present relevant information in a clear and concise format. You want stakeholders to glean valuable insights and use them to achieve success.
Here's how to create effective project management reports.
This step is paramount for every successful project management report. Consider the purpose of your project report.
Are you creating new tasks or dependencies? Have you identified new risks or do you want to explain project delays? Are you creating project change requests or updating the project scope? Or are you looking to convince sponsors to pump additional funds into the project?
Why is it critical to clearly state your objective? The answer is simple. It provides clear direction for the rest of the report, making it easy for readers to understand.
The next step is to identify who will be reading the report and what they want to learn from it. Identifying your audience from the outset will give direction for your content.
Some details may be irrelevant to some audiences. Others might require more specific information. For example, top executives and investors may not have time to dive into the finer details. For this type of audience, visual aids like the one below are your best bet.
On the flip side, team members may be unable to get much out of a report showing only charts, numbers and notes.
Meet with your client or supervisor to understand what they expect from the report. They may have a specific report writing format, length, details and areas of interest they want you to include. Try to gather as much information as possible to make your report useful.
Some audiences may be unfamiliar with your profession's language, terms and jargon. Avoid using industry jargon that’s hard to explain. Instead, write in a tone that clearly explains your project information. Tailor your content, tone, language, structure, communication style and graphics to your reader.
Solidify your reports with accurate data and facts from stakeholders and departments involved in the project.
Looking for financial data? Your accounting software is a great place to start. Or you can get information about resource utilization from your project management tool.
If you're looking to capture the true situation of things, don't just rely on qualitative data alone. Double down on qualitative data like ideas, behaviors and opinions as well. They provide more context and explain the stories behind the quantitative data.
For example, let's say quantitative data shows project delays and missed deadlines. You can gather qualitative data to uncover the root cause and how to mitigate it.
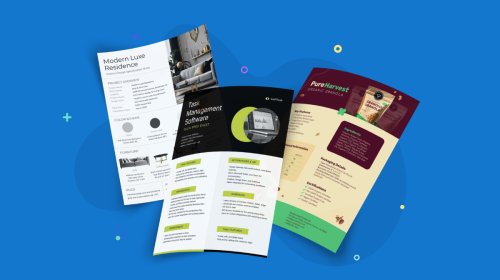
We have already shared what needs to be in your project management report. Now It's time to write it. Use pre-made templates with an organized structure like the one below to make it visually appealing.
Why does it matter? Well, no one wants to read reports in a jumbled and disorganized format. So you want to organize data and facts to make them easily digestible.
Start with a stunning cover page followed by a table of contents. Then move on to the executive summary and the body, which includes the key details. Finally, you can round off your report with a summary.
To make your report actionable, summarize it with key takeaways, action points and expectations.
Not sure how to get started? Visme has you covered. Our report maker is intuitive and easy to use, making report writing a breeze. You can start from scratch or use professionally-designed templates to create reports like:
In the latter part of this article, we'll discuss how to make the most of Visme templates.
Proofread and revise your content to make it worth the read. Don't be tempted to leave out this step no matter what happens.
Look out for spelling, punctuation and grammar errors, inconsistent data, cluttered designs and other flaws. Eliminate irrelevant details, replace missing data and revise the report until it is error-free. Otherwise, your report will look sloppy and unprofessional.
Check with your team to ensure you aren't missing out on extra updates or last-minute changes. They also offer an extra pair of eyes to spot errors and ensure nothing falls through the cracks.
With Visme, you can collaborate and revise your project with team members. Simply share your report with a link and password. You can set permissions to allow your team members to view, comment and edit the report. When anyone edits the file, you can track changes and anyone with the link will see the changes too.
Once you've incorporated contributions from team members, you can share the report with your readers.
From your Visme dashboard, you can invite people via email to view, comment or edit the report. Or copy and share the report link with your audience. You can also download the report in PDF format and share it via email or the cloud.
Remember to ask your readers to confirm they've received the report and can view it.
Crafting a project management report worth reading can be challenging. But there's no doubt that Visme's report maker can make the process a breeze.
The software has an easy-to-use design editor, a rich library of templates, icons, stock images, videos and much more. Feel free to tailor these templates to your unique needs. You can replace the content, add or remove pages, upload logos and images, change fonts, colors and other elements.
Here are ten stunning Visme templates to help you get started.
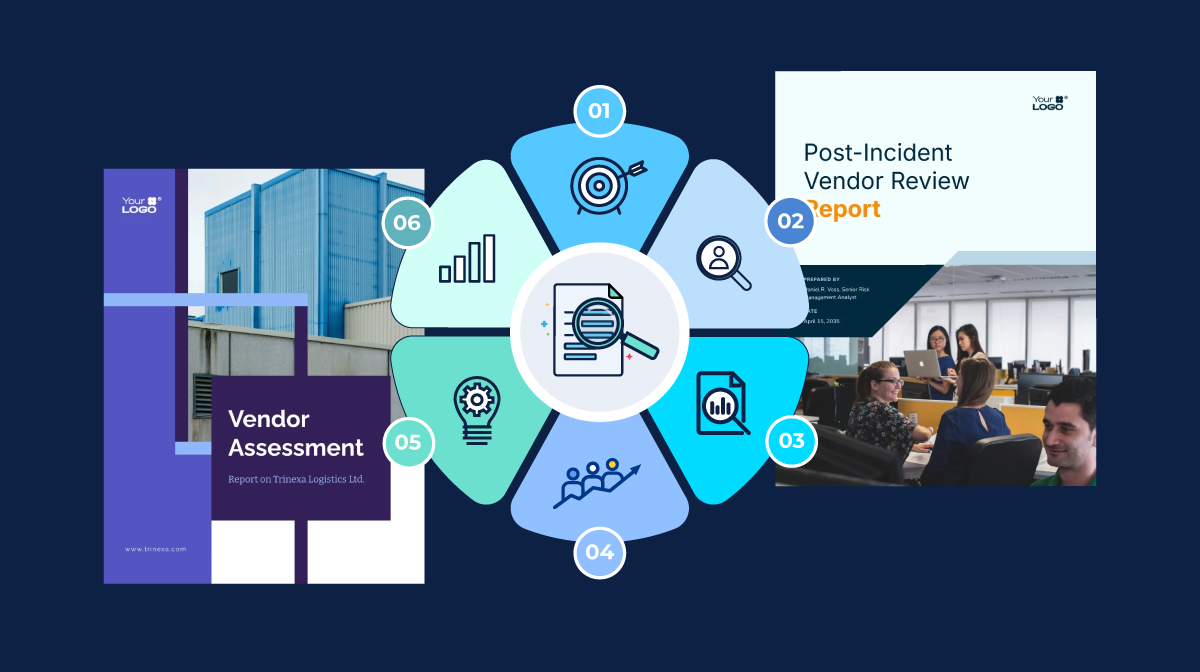
Get stakeholders’ attention on your project management reports with this sleek, visually appealing template. The cover and inner pages feature a refined design and thoughtful elements that make a strong first impression.
This template includes everything you need to report your project’s progress effectively — from an executive summary and key figures to timelines, target-versus-outcome comparisons, and a clear breakdown of budget and expenditures. For major stakeholders, you can also incorporate SOW templates to make your report even more comprehensive.
Notice how this report uses charts, graphs, icons, and images to visualize key project data. You can find and customize all these elements and more in Visme.


If you're struggling to communicate your project status, this template is a life-saver. This vibrant template has an elegant design and elements that attract the reader's attention.
You can easily capture project goals and status, inter-department KPIs, contributor APIs, upcoming tasks and more. Go ahead and add or edit the content, upload your logo and images to make this template your own.


With this template, you can keep budgets and expenditures in check. The template uses data visualization features ( charts, graphs and widgets) to reflect financial data.
In Visme, you'll find different visual aids and interactive elements to bring your information to life. At a glance, your stakeholders can also understand how much various items and projects cost and how profitable they may be in the future. You can customize this report for any unique business and project needs.
Are you looking to show investors how your business has performed in the past year? This annual report template is the best tool to help you get cracking.
The template is characterized by a minimalistic design and a cool color scheme. You'll find beautiful images, charts, icons and other design elements that make it stand out.
Once you're done customizing your report, you can easily share it online via a link. You can also embed it on your website or blog or download it for offline use in various formats, like PDF and HTML5.


This template is perfect for updating stakeholders about project progress, business processes and activities. Notice how the design utilizes whitespace, classy typography and cool colors to produce an alluring design.
The table of content design shifts from the conventional list format. And the rest of the pages contain images, tables, charts and icons that increase visual impact. Feel free to add or subtract pages and replace the content with yours.


You've invested time, effort and resources into different marketing projects during the year. How do you convince the board that you're smashing your goals?
You need a template like this to show what you've been up to. It captures key aspects of your marketing project, like:
The template has a captivating theme with customized content blocks, borders, icons, images and vector icons. You can get all of these design assets and more in Visme.


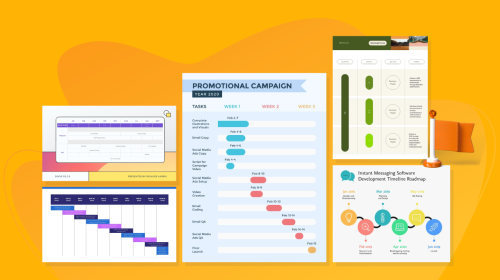
Not sure how to present timely updates about your project's overall progress? This professionally-designed status report template is the perfect tool to jumpstart your creativity.
It details each step of the project's execution and the most critical task in progress. The project's budget, milestones, upcoming tasks, potential risks and roadblocks and overall project health are also included.
This template uses a pie chart to capture team performance (KPIs), while the progress bar visualizes the project's health. No matter your business size, scope or niche, you can tweak this template to fit your business or project needs.


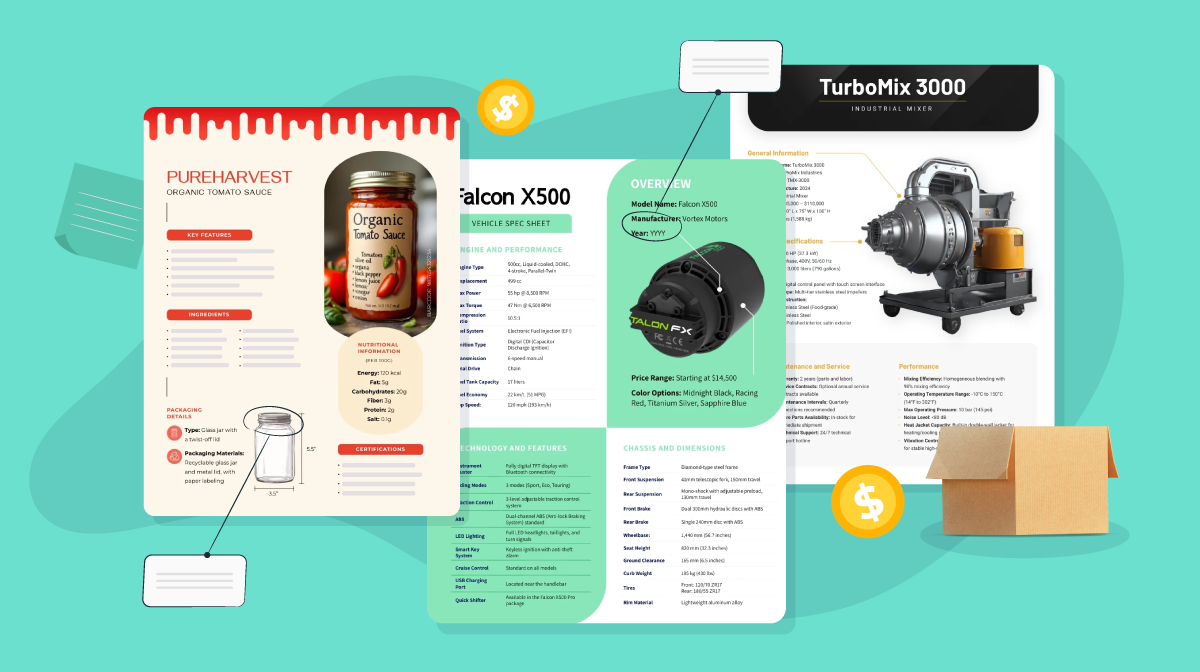
Use this template to clearly depict how various aspects of your business or project are performing. It gives you a closer look at what's working and what's not.
You can customize it to include the key elements that make up a project management report, including:
Jazz up your reports and draw attention to key data points using pie charts, bar graphs, timelines and interactive maps.


This project management report template is suitable for businesses that want to gauge their progress against specific goals.
It has sections listing pending and completed tasks and how they impact the overall plan. Search through our vast library of vibrant, isometric, flat and outline images to find the best fit for your report.


Our last pick is a visual-rich report template that focuses on the bigger picture. Gauge your company or project's health with this annual report template.
We recommend using this template for top management and stakeholders who may be unable to dive into finer details. To grab their attention, spice up your report with data and visual aids that communicate these things:
To get started, input your project data and change the fonts, color and logo to reflect your brand.


Ready to create project management reports that boost stakeholders' confidence in your project? Here are some tips and best practices you should have up your sleeve.
When writing a project management report, be concise. Make sure every word counts. Don't dwell on details your readers don't need to know. Otherwise, you'll lose your reader's attention.
Readers want to look through the report and grasp the action points and next steps as quickly as possible. Keep sentences short and to the point. Rather than long paragraphs, use bullet points to present information.
For example, you can list tasks or deliverables rather than describe them in detail.
Write your report in a way that makes the reader understand the true situation of things. Stakeholders need to know how significant the problem truly is.
For example, don't just say the deliverable is behind schedule or there's an urgent risk to be addressed. Instead, start by establishing the root causes of the delay. Is it due to scope creep, equipment failure, labor or financial shortages or acts of God?
Discuss how the situation will impact the entire project. Will you require additional resources, a supplementary budget or an adjustment in timelines? Do you need approval for a change request?
Be upfront about the solution or steps being taken to address it? If you need clients or other stakeholders to take action, clearly state who is responsible. Highlight what they are responsible for and when to do it.
Top executives and project sponsors receive different types of reports daily. Hence the need to incorporate visuals like charts, graphs, maps, tables, diagrams, pictures, animations and video.
Visual aids break up text and make even lengthy reports easy to digest. But there's a caveat!
Don't just slam your audience with dull and pixelated visuals that don't add value to your report. Rather, make it eye-catching and visually pleasing to capture readers' attention.
Tables are perfect for communicating numbers like budget, timelines, percentage completed and more. Kanban boards give a general overview of the projects and help spot potential bottlenecks.
Use stoplight color-coded charts to indicate project health. Green shows the activities are on schedule and yellow indicates the project has risks or bottlenecks. Red shows the project has veered off track.
You can use infographics, flowcharts and process diagrams to depict the flow of work or document processes.


Graphs, bar charts and pie charts work magic for visualizing data like budgets, expenditures and income.
Animations, photos, videos, screenshots, samples, models and prototypes are suitable for showing your project in progress. For example, suppose you're building a website or app. In that case, you can share a demo video of the project at different phases.
You're probably wondering how to get your hands on all the visual aids mentioned above. Keep calm; Visme has got you. We have a rich library of 10,000+ images, videos, charts, vector icons and any other visual aid you can think of. You can pick and customize your visuals within minutes without professional help.
You need to do more than just add visuals to make your report shine. We recommend customizing your report to showcase your brand identity. The goal is to leave a solid impression on your audience.
With Visme, keeping your report on brand is a piece of cake, even if you're new to report design. After picking a template, you can add fonts and colors to different elements of your report. Feel free to add icons, illustrations and animations to make your report interactive.
Visme's Brand Design Tool helps you maintain design consistency. With a few clicks, you can customize and save your design elements and apply them to future projects.

Want to learn more about choosing the right color theme for your document? Read our article on color psychology in marketing or watch the video below.

After submitting your message project management report, your job isn't done just yet. Don't be in a hurry to close the communication channel with stakeholders. Go ahead and invite further questions and feedback on your reports.
We get it. This might be daunting considering the time spent on putting together your report. But try to be receptive to critique and suggestions.
The good part is that it ensures everyone is on the same page regarding the project collaboration. Also, acting on the feedback and suggestions can help steer the project in the right direction.
Project management reports provide a high-level overview of what's happening with your project. And having one that ticks all the right boxes plays a pivotal role in the project's success.
With Visme's report maker, you no longer have to outsource your design project. The tool makes it easy for anyone, regardless of skill level, to create documents they can be proud of. Browse our library of project report templates to find the right fit for your project.
Design visual brand experiences for your business whether you are a seasoned designer or a total novice.
Try Visme for free