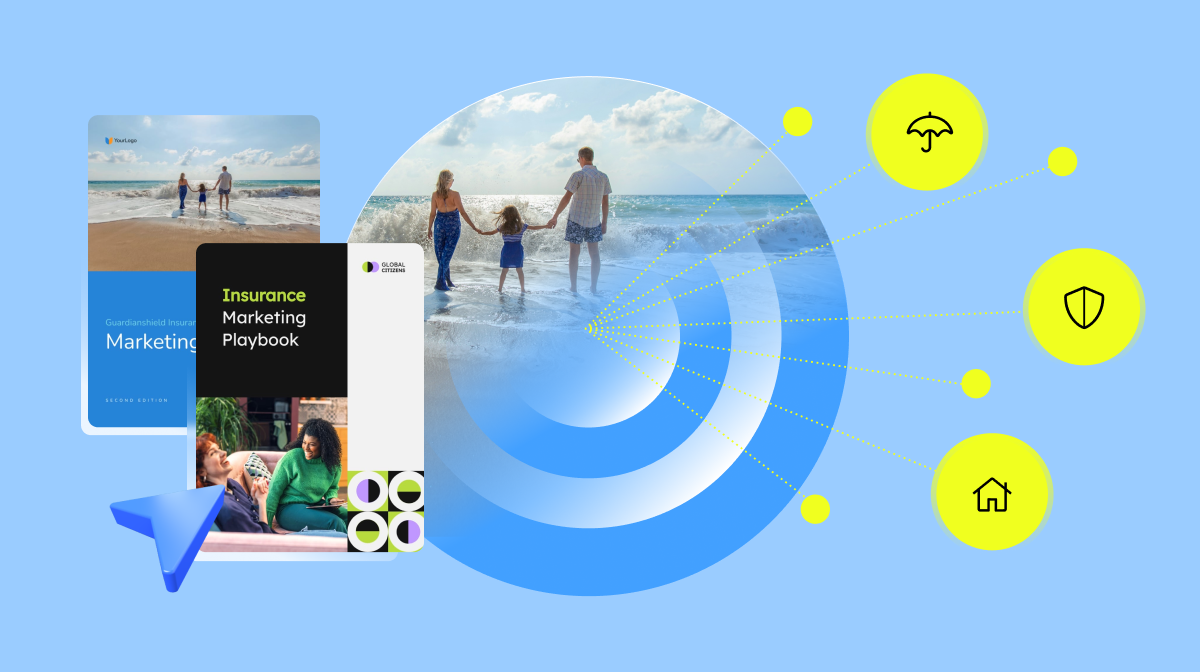
AI Healthcare Marketing: Strategy, Tools & Real Examples for 2026


Marketing operations involve many moving parts.
For your marketing campaigns to succeed, it's essential to keep an eye on the details for data-driven decision making.
This is where marketing dashboards shine. It gives you a bird's-eye view of all your marketing efforts in a centralized location and allows you to make informed decisions every step of the way.
The challenge is that most marketing dashboard tools come with a steep learning curve and hefty price tags. If you're looking for an affordable, highly customizable and user-friendly marketing dashboard tool, you're in the right place.
In this article, we'll introduce you to 12 marketing dashboard templates you can tailor to your needs using Visme, allowing you to craft your own personalized marketing dashboard.
Here are the 12 marketing dashboard templates from Visme’s library. You’ll find templates for all your marketing campaigns, including PPC, SEO, social media and more. Customize your favorite templates using our drag-and-drop editor to make them your own.
Are you looking to streamline your PPC campaigns? This template provides an overview of your pay-per-click advertising campaigns. It allows you to track key metrics such as click-through rates, costs per click, conversion rates and overall ad spend.
Moreover, its aesthetically pleasing and user-friendly layout allows you to track, monitor, analyze and optimize your PPC campaigns. Evaluate your PPC performance and ROI with ease.
This template is all about tracking all of your brand's social media channels in one place. It's a visual treat with neatly separated data sections for likes, comments, shares and followers growth across various platforms. The clean design with distinguishable sections allows for a seamless understanding of complex data.
Also, you can customize it to add, edit or change the data sections to fit your social media marketing campaigns.
Use Visme's Dynamic Fields that allow you to personalize elements such as the name of team members responsible for each platform, campaign names or dates. This can help keep your dashboard updated and tailored to your specific needs.
All you have to do is save the information you want just once in the dynamic fields section and then it will automatically be updated on your dashboard whenever you make changes.
Watch the video below to learn how this amazing feature works.
This modern and sleek template provides a comprehensive look at your multi-channel marketing metrics. Beautifully pieced together with a tech-inspired design, it integrates data from the various expense categories in your overall marketing efforts to help you formulate effective strategies.
Customize this template to see all your marketing spending in one place and strategize your marketing efforts more accurately.
To run an e-commerce business successfully, you'll need insights into various aspects of your business, such as daily sales, monthly revenue, customer feedback, ad revenue, referrals and more.
This e-commerce dashboard template gives you a complete picture of those critical factors in the form of an easy-to-use monitoring tool.
Packed in a visually pleasing interface with color-coded sections and easy-to-read charts, you get a comprehensive snapshot of your online store's performance.
Personalize your dashboard to match your brand personality. You can do this by adding your brand colors, brand fonts and your company's logo to your dashboard.
Visme makes it super easy with its brand design tool. With just one click, you can create and save your branding assets. Just paste your URL into the tool, and it will automatically capture and save those assets for you.

This template helps manage and measure your social media activities. Capture essential metrics like follower count, post engagement, audience demographics, and more across different social platforms.
Its interactive design with rich colors makes data interpretation effortless and engaging. Customize this template to fit your social media strategy and streamline the management process efficiently.
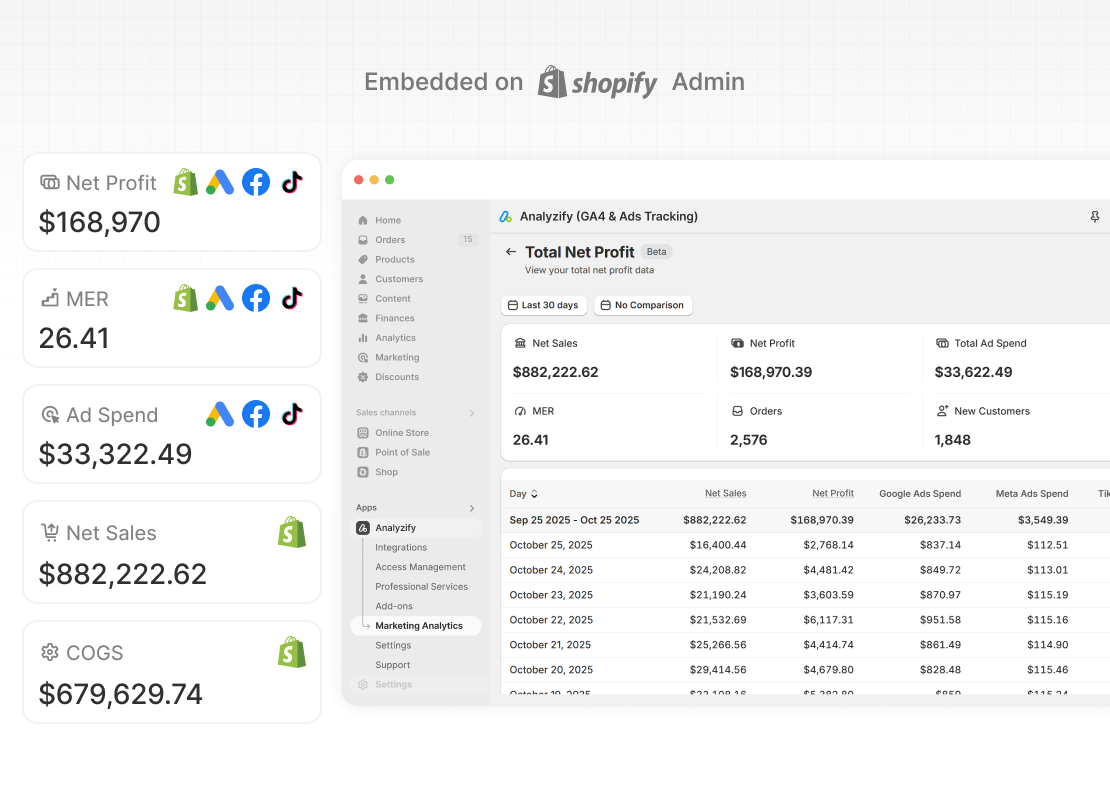
If you run a Shopify store, understanding marketing performance usually means checking Google Analytics 4 (GA4), Google Ads, Meta Ads, TikTok Ads, and Shopify reports separately. This makes it hard to see how ad spend, costs, and revenue connect.
Analyzify’s Marketing Analytics Dashboard brings all these data sources into your Shopify admin and combines performance metrics with profitability data. You can go beyond ROAS and revenue by tracking Cost of Goods Sold (COGS), refunds, net profit, and Marketing Efficiency Ratio (MER) alongside your marketing results.
Use this dashboard to track:
Analyzify’s Marketing Analytics Dashboard helps you clearly see which channels and campaigns drive profitable growth, so you can make better decisions without switching between platforms.
Are you looking for a simple dashboard without compromising data accuracy? Use our simple marketing KPI dashboard template to maximize your campaign impact without getting overwhelmed by data.
This is one of the best marketing dashboard examples. Despite its minimalist design and straightforward interface, it encompasses all the essential metrics for evaluating your marketing performance.
From ad spends and web conversions to social media engagement and branded searches, this template has everything you need to make informed decisions and optimize your marketing strategy.
Marketing is all about collaboration. Visme understands the need for effective teamwork in marketing and offers robust design collaboration features.
These features enable you to create, edit and refine your marketing dashboards collaboratively in real time, fostering creativity and efficiency within the team.
With features like live editing, commenting, annotating, version control and more, the process becomes much more manageable.
Read this article about how to do collaborative design right with Visme or watch the video below.
For the search engine optimizers among us, keeping track of the shifts in the ever-changing search landscape becomes much easier with specialized tools. The SEO dashboard template is designed to monitor crucial SEO metrics like organic traffic, monthly views, new leads and keyword rankings.
Its design incorporates modern graphics and color-coded segments to provide a comprehensive view of your site's SEO health. Evaluating and optimizing your effort becomes easier with this intuitive template.
Visme's tools and templates make it a breeze for businesses to craft impressive dashboards quickly, even faster than many other tools out there.
Don't just take our word for it; let's hear from one of our satisfied customers.
Internal communications, Housecalls, Optum, United Healthcare
Our CRM Tool Dashboard Template is designed to help you manage your customer relationships precisely and efficiently. It provides a detailed view of your customer interactions, recent leads, revenue generated and more, all in one place.
This exceptional template stands out due to its sleek, easy-to-understand design and high degree of customization. Customize the template to focus precisely on the metrics that matter most to your business.
Building an effective ad analytics tool starts with a powerful wireframe. A well-structured wireframe lays the foundation for a comprehensive and visual overview of key advertising metrics.
The Ad analytics dashboard wireframe template helps to seize control over the design process by laying out exactly where each piece of crucial data fits into the broader picture, from click-through rates to impressions and much more.
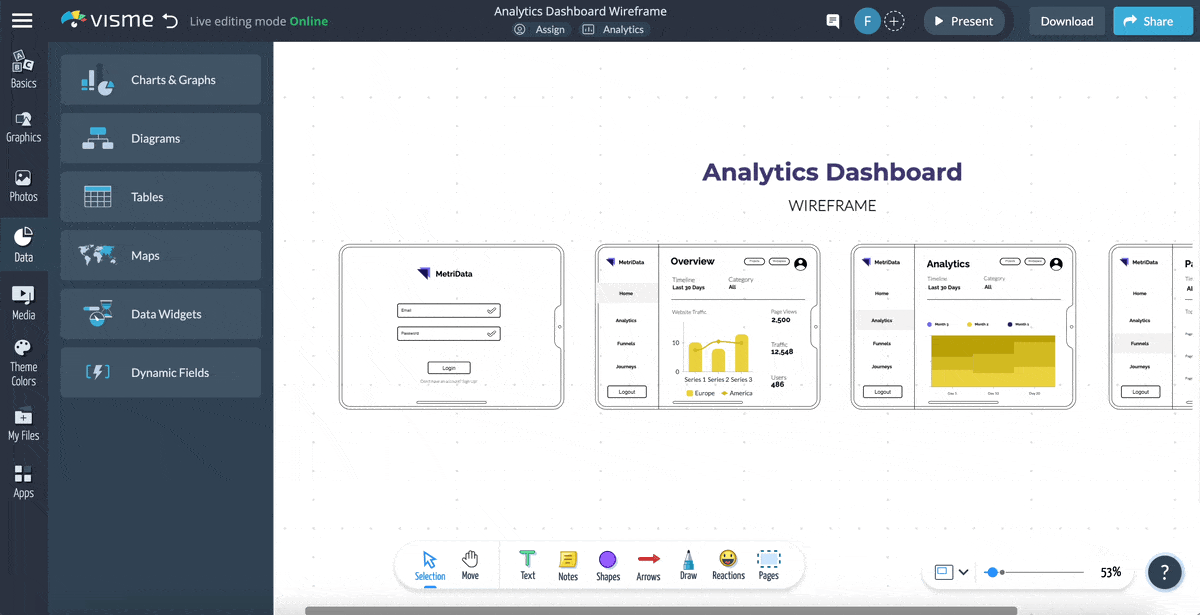
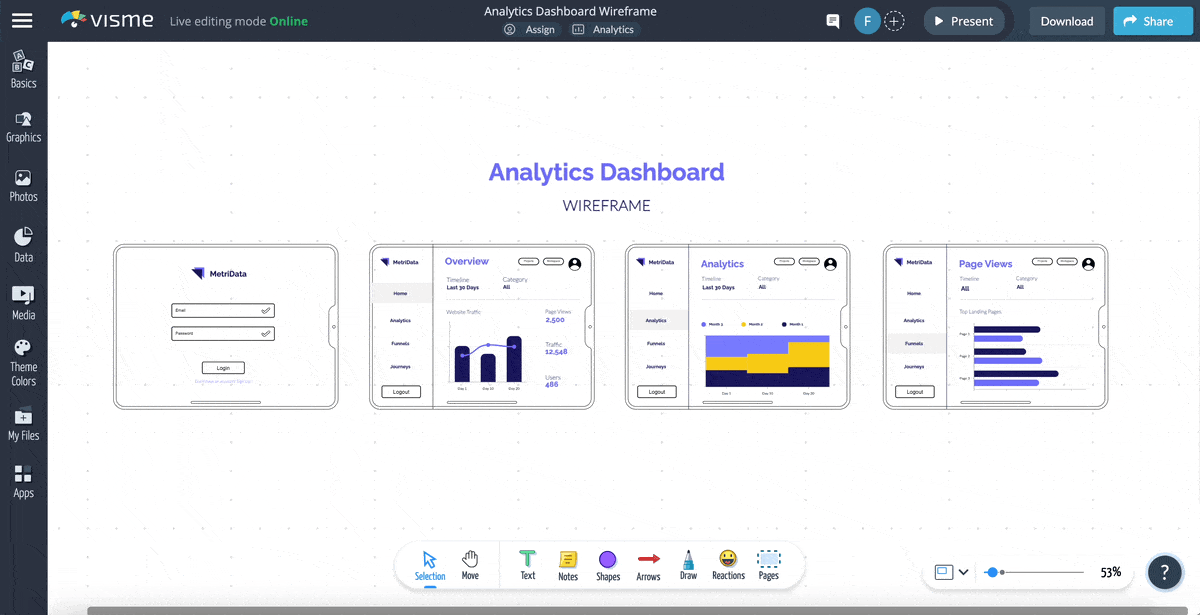
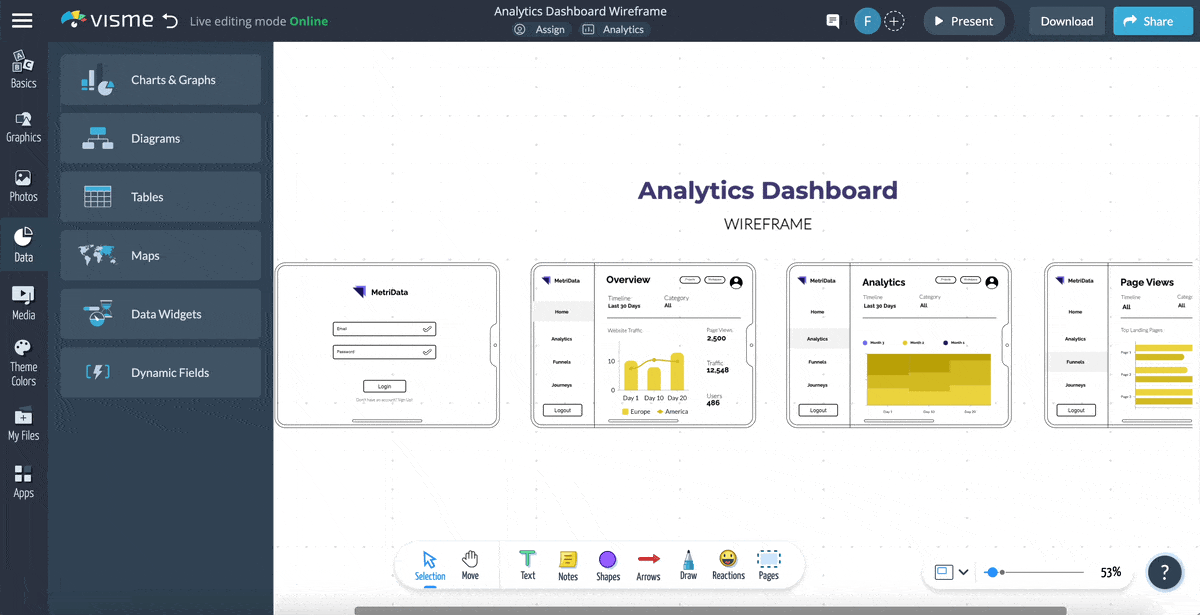
Similar to the ad analytics wireframe template, this analytics dashboard wireframe template gives you an overarching view of business data. It's a blueprint for handling complex data sets across various business functions like website traffic, landing pages, marketing funnel, customer journey and more.
Effective digital marketing relies on the ability to track performance data and derive actionable insights. A central view of all functional metrics helps measure the success of your marketing campaigns.
This creative digital marketing reporting dashboard captures all the crucial KPIs for your digital marketing strategy. The visually striking layout presents metrics, including bounce rate, new sessions, sales, marketing qualified leads and cost per action. Its detailed yet easy-to-understand graphics help you assess your digital footprint quickly.
Use Visme's AI writer to generate content for your marketing dashboard. This feature is designed to help you craft better copy and enhance your data visualizations.
The AI writer is a powerful tool that can generate drafts, structures, outlines, overviews and even help proofread and finalize your text. It's a perfect tool to create more engaging marketing dashboards.
Creating a marketing dashboard may seem a daunting task, especially if you have no prior experience with it. But with
With Visme’s customizable dashboard templates and drag-and-drop editor, anyone can create a beautiful-looking dashboard in minutes.
Follow these simple steps to create your own dashboard:
First, you'll need to log in to your Visme account. If you don't have one, creating an account is simple. Click on the login button from the upper right corner of Visme's home page.
Then, you can sign up either using your email ID and password or by using your Gmail or Facebook account.
Once you're logged in, select a suitable marketing dashboard template from Visme's template library. You can do this in two ways:
Go to Visme's template library, type "dashboard" in the search bar, hover over your preferred template, and simply click "Use template" to open it in the Visme editor.
Alternatively, click the "Create New" button, go to "Project," and choose "More" from the dropdown menu. Next, type "dashboard" in the search bar, hit "Enter," and select the template you want to edit. It's that straightforward!
Customizing your template is the most important part of the process. In this step, you’ll make the dashboard your own by including all the data sets you want the dashboard to display. So, to make the process easier, here are some ideas for you.
This is where you can decide what data you want on your dashboard. Remember, it should align with your marketing goals.
To add your content, click on the text box in the template and begin typing. You can also add new text boxes if needed. Use the left sidebar to drag and drop your text boxes.
Adding data widgets is how you illustrate your numbers visually in Visme. Click on the "Data" tab on the left sidebar and choose from options like Charts & Graphs, Tables and more. Then, customize these widgets with your specific data.
Visme has an easy drag-and-drop interface. You can move, resize and rearrange elements on your dashboard to design an intuitive layout that tells your marketing story best.
Visme is all about making data beautiful. Click on any element in your template, be it a chart or a simple text box and use the toolbar at the top to customize colors, fonts and sizes to match your brand.
You can also use the "Graphics" and "Photos" options in the left sidebar to add more visual elements.
Choose from millions of stock images, vector icons, 3D animated illustrations, shapes and lines and more.
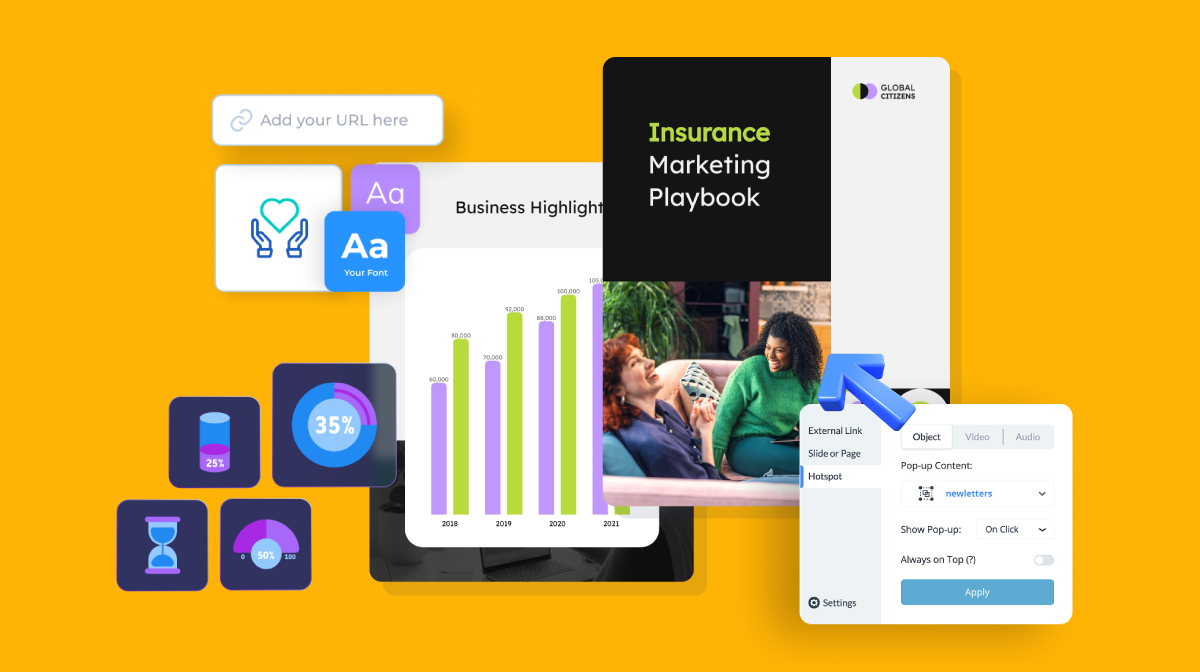
Want your dashboard to be even more engaging? Add interactivity! You can add pop-ups, clickable buttons or external links to elements on your dashboard.
Click on the element, and a top bar will appear with options like "Animate," "Actions," and "Effects."
Then, select what the element should do: Go to a webpage. Show a pop-up? You decide!
Visme allows you to seamlessly integrate with popular apps like Google Sheets, Excel, Google Analytics, and Survey Monkey.
This means your dashboard can automatically update to reflect the latest numbers. No manual input, no outdated information; it's all real-time and accurate.
Select the Chart, Graph or Table you want to connect to the live data. Choose "Import Data" and select the app you want to connect to, and you're done.
Additionally, you can integrate all your favorite marketing apps like HubSpot, Livestorm, Mailchimp and many others with Visme. This will allow you to exchange data between these tools and create a centralized location for all your marketing campaigns.
Once you've created your stunning marketing dashboard in Visme, you'll want to save and share it with your team, clients or stakeholders.
To share the dashboard with all the interactivity, live data and other features, you need to share it online. Visme allows you to share the dashboard via a private link, publish it on the web or embed it using a code snippet.
Click on the "Share" button on the top-right corner of the Visme editor and choose your preferred option from the pop-up window.
Additionally, Visme lets you download your dashboard in various formats, including PDF, PNG, JPG and HTML.
To ensure you have adequate information regarding the marketing dashboard, here are some of the frequently asked questions:
A marketing dashboard is a reporting tool that displays marketing analytics, metrics and key performance indicators (KPIs) through data visualizations.
You can customize these dashboards to focus on specific marketing KPIs and display ROI. These dashboards allow you to capture and report on marketing metrics from various sources within one place, saving time by providing a centralized hub for your marketing performance.
A marketing dashboard is super handy for a bunch of reasons.
Save time: No one wants to spend hours digging through data. Dashboards make it simple to check your stats and move on to more critical tasks, like creating killer content!
Here are some of the golden rules of creating a dashboard that truly stands out:
Now you know how easy it is to whip up a marketing dashboard in Visme. Sign up for a free account, pick a template and give it your unique touch.
But when it comes to making your marketing campaigns shine, you will need a wide range of marketing collateral. The good news? Visme has your back with that.
With Visme, you can craft presentations, infographics, social media graphics, ebooks and a lot more, all in just a few clicks.
Additionally, Visme offers report templates you can use to present your marketing and other project performance in a professional, organized way.
Sign up for a free Visme account and start creating in-depth reports, dazzling dashboards and much more today.
Design visual brand experiences for your business whether you are a seasoned designer or a total novice.
Try Visme for free