


14+ Employee Newsletter Examples, Ideas & Templates
![How to Write an Impactful Quarterly Report [+ Templates]](https://visme.co/blog/wp-content/uploads/2022/10/How-to-Write-an-Impactful-Quarterly-Report-Header.jpg)
Should you write quarterly reports? Do you need quarterly report templates to do them?
The thing is, all businesses need quarterly reports. You’re not doing your business any favors by not publishing this type of documentation.
Quarterly reports show how a specific department (or the company as a whole) performs in a specific quarter. The advantage of releasing quarterly reports is that they keep everyone on the same page.
Without quarterly reports, you won’t know where the business (or different departments) stands today, what actions they need to take, how they can improve, and what the next quarter could look like.
If you’ve never done a quarterly report before, you should use a template, as it will make the task far simpler than starting from scratch.
Below is everything you need to know about quarterly reports, including how to create one using a quarterly report template. If you need a hand getting your designs up and running fast, let our AI report generator take care of the hard work.
Here’s a short selection of 8 easy-to-edit quarterly report templates you can edit, share and download with Visme. View more templates below:


So what are quarterly reports, and why do businesses publish them?
A quarterly report is a presentation that a company publishes every three months that discloses its financial status to investors, employees, customers, and the general public.
However, every department in your company can create quarterly reports for internal or external use. For example, a quarterly financial report lets everyone know if the company is growing. A quarterly marketing report tells you if you’re allocating enough resources for promotion.
But there are many other ways quarterly reports can help your business. Much like monthly reports, your team can use quarterly reports to:
Do you need quarterly reports? The short answer is yes. Every department should create quarterly reports, so everyone is on the same page. This includes finance, customer service, and production departments.
With quarterly reports, you should be able to:

Anyone in your company can prepare a quarterly report. What’s important is that it includes the following sections.
If you’re ever confused about what to include in a quarterly report, you can refer to the next section to guide you through.
Ready to write your next quarterly report? Here’s what you need to know and how to get started.
Writing a quarterly report becomes smoother if you have all the data you’ll need before you even begin. This includes the company’s income statement, balance sheet, cash flow statements, etc.
It’s not just the data either. You also need to worry about the statements that will be included in the report.
That means you may have to communicate with other department heads to secure all the resources you’ll need before the deadline.
And remember, part of the preparation is double-checking your numbers to ensure you don’t publish inaccurate figures.
Your quarterly report layout will help you decide the order you’ll present all facts and figures.
Take note that you’ll need to add specific pages for the cover, table of contents, and objectives before you even hit the main content. Ensure that the order in which you present your data makes sense to your audience. You might also want to consider creating a shorter version of your quarterly report using a one pager template for easier sharing.
It’s highly unusual for a quarterly report not to include graphics like charts, graphs, and similar visual aids. That is because they make it easier for readers to digest all the information they’re presented with. Not only that, visuals help keep readers engaged as they organically break up long blocks of text.
Unfortunately, creating compelling visuals isn’t easy for those who don’t have any graphic design experience.
But if you use Visme, you can add and edit visual elements like graphs with ease. You even have the option to manually update figures or link them to a source and have them updated automatically. That’s why using a tool like Visme is an excellent resource, especially if you’re making your first quarterly report.
As long as all the necessary information is included, a company can design its quarterly report however it wants.
However, you’ll want to keep it simple since it will be shared with a vast audience. Most designs will use the company’s colors to keep branding consistent across all its reports and marketing materials.
Visme lets you create quarterly reports fast. Even better, Visme lets you choose from its vast selection of quarterly report templates, so you don’t have to start from scratch.
Here’s how you can customize a quarterly report template to suit your needs.
From your Visme dashboard, select Create New. You’ll be asked what type of project you’ll want to create. Go ahead and select Documents and then click Reports.

From here, you’ll find different themes and templates to work with. Just find a template that works for you and start creating your quarterly reports.
Remember the colors, images, and other page elements in our templates are customizable. And you can add or remove as many elements as you need.
Visme uses a drag-and-drop functionality, meaning users can move assets in and out of the page. You can add animations and hover effects to add some spice to your report. The beauty of using Visme is that you can access a vast library of icons, stock photos, and videos. So if you need to, you can add as many visuals as you need to get your message across.
And best of all, Visme has some of the best data visualizations out there. There are over 20 customizable charts and graphs. And you can even insert maps into your presentation if your quarterly reports need them.
If you’re working with a team, you’ll be happy to hear that Visme has collaboration features that make work way more efficient. With the Visme workflow, you can assign different sections of your report to different teams, set deadlines and review progress and completion.
If you’re running out of time, you can use Visme’s AI report writer to generate reports in minutes. Just type in a prompt and describe what type of report and content you want in your report.
The chatbot will suggest a few styles and you can easily inject your brand, visuals and graphics from Visme’s royalty-free gallery. Or create new ones with the Visme AI image generator. Another advantage of using Visme is getting access to more AI tools like the AI text generator, the AI document generator and much more.
Visme report templates give you the creative freedom to design templates that fit your branding. You can replace all the text, images, and graphs that come with each template. There’s an option to change colors too. So you’re never stuck with what each template gives you.
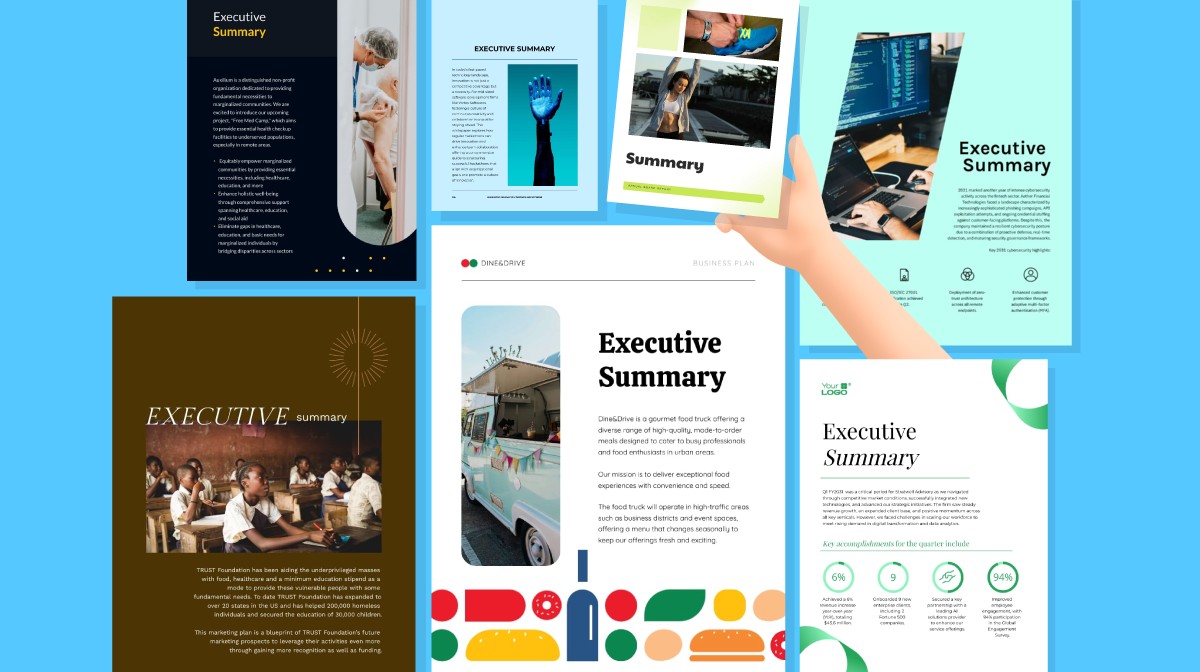
Here are some of the quarterly report templates available on Visme.
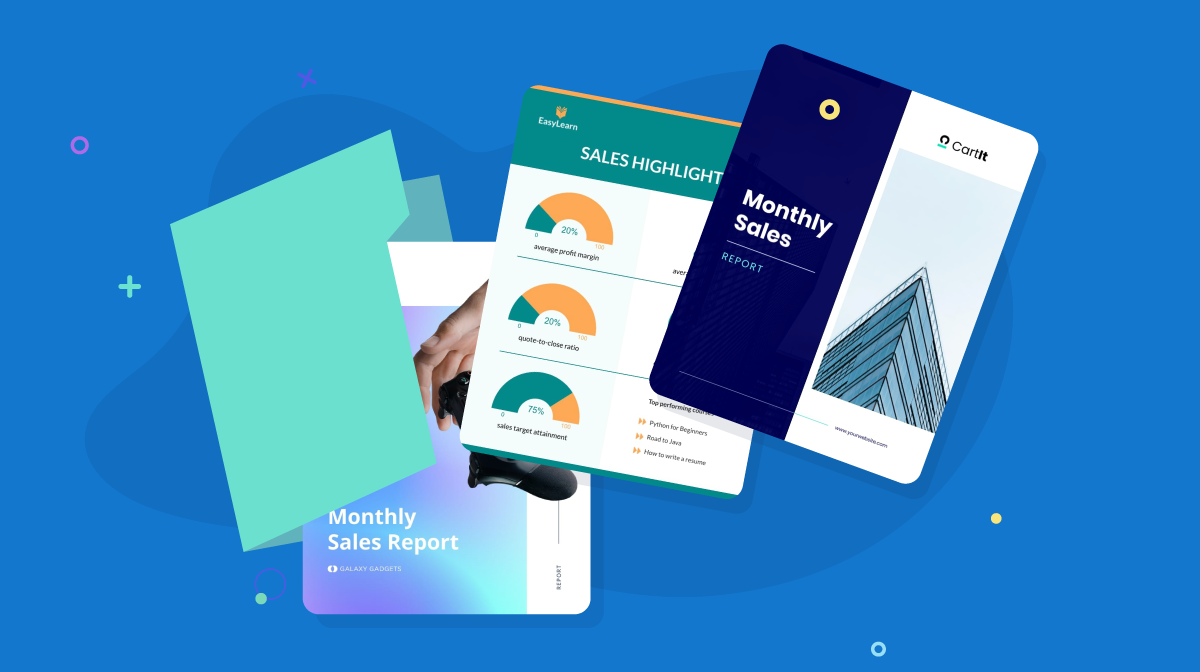
This quarterly sales report template is one of the best in the collection. The design is simple enough and lets you add vectors to help you tell your story.
The template is a good foundation for any quarterly report. But you’ll want to add more pages, so you have somewhere to put visualization tools like graphs and tables. You can change the template’s color scheme to suit your taste.


If you're in the SaaS industry, you’ll be happy to hear we’ve got a quarterly report template specifically for you. Not only does this template look modern, but it also looks professional. This is the best template for those who want to impress new investors in the business.
You can make the whole color scheme consistent by using the same blue and yellow scheme for your charts and graphs.


Here’s another quarterly business report for SaaS companies. But unlike the Modern SaaS Quarterly Report template, this one uses bold colors and shapes to grab the reader’s attention.
You can use any of the stock photos available on Visme or upload one of their own. You also have the option of adding vector files to add some flair to your design.


Do you want a template that says you’re serious about business but still shows some personality? This example of a quarterly report might be the one for you.
This stylish quarterly report template uses fun images with colored content blocks. When customizing this quarterly financial report template, feel free to play around with fonts and inject light colors. And as always, you can insert pie charts, maps, timelines, and other visuals to present your data.
Just because something is simple doesn’t mean that it’s boring. This simple monthly or quarterly report example is designed for online stores to report how well they’re doing, but it works for any type of business.
The softer colors used on this template are quite relaxing on the eyes. That helps readers process all the information they’re being fed. And because this template has a minimalist aesthetic, the report doesn’t feel intimidating.


Here’s yet another example of how simplicity can make any report look so good. This template, however, puts all the attention on your images. If you have amazing photos to share for the report and want to keep it simple, this template is a good option. It's ability to tie in elements with it's annual report design is definitely a plus.


The Sales report presentation template has that classic look. If you’re after a more traditional report vibe, this is the template for you. This template puts all the focus on the charts, graphs, and other visuals that you’d like to use.
This template celebrates data. So a company that’s had an excellent fiscal year will surely want to use this one.


The Financial Report Presentation template is great for people who like designs that are sleek and professional. Most of the slides have one dominant color. And combining that with a white or black font really helps to keep the presentation all about the information you’re sharing with readers.
You can also repurpose this template as a financial presentation, an executive presentation or board report.
You can also use the provisions intended for images to showcase some of the company’s products and services.


Visme has a second template called Financial Report Presentation. And this one feels even more traditional and gets rid of photos altogether. Instead, it relies on powerful visualization tools like charts, line graphs, tables and more.
The classic looks of the presentation make it ideal for businesses that want to be taken seriously.
If you don’t want that classic report look, this Modern Annual Report template might be your best bet. It's originally designed to capture annual reviews for different departments, but you can easily customize it to report performance every three months.
As its name suggests, its design brings its readers to modern times. By using a strong image on your cover page, you’ll surely grab everyone’s attention. It also allows you to follow the proper report writing format so you're sure to showcase your details in a professional manner.
You can also elevate the design and user experience by turning this template into an interactive annual report. Add hotspots, clickable menus, and embedded media to not just tell your story, but show why your data matters.
The inside pages are just as strong. Since the template has a portrait orientation, you can squeeze in more visuals on a page. The magazine-style layout also makes reading the report feel a bit more casual.


The Creative Annual Report template gives the designer room to explore. It welcomes the use of multiple colors, shapes, and images. It’s ideal for authors who want to celebrate the company’s achievements—reading through this report would feel like a proper celebration of every company highlight for the quarter.
And as its name suggests, you can also use this template for annual reports.


A quarterly report covers a period of three months. When a company produces quarterly reports, they are summarizing their activities, financial performance, and other relevant information for every three-month period within the calendar year.
While the specific structure may vary based on your organization and industry, here's a general structure you can adapt for your business quarterly reports.
The key elements in a quarterly report are:
In general, a well-structured and concise quarterly report might be 10 to 30 pages long. However, quarterly reports could be longer for larger or more complex organizations.
A well-structured quarterly report should be organized and easy to navigate. The information should be presented in a clear and concise manner.
When creating quarterly reports, aim to maintain a professional and consistent design throughout the report. Consider incorporating visual elements such as charts, graphs, and tables to enhance readability and understanding.
Quarterly reports serve multiple purposes:
A good quarterly report includes a comprehensive overview of the company's financial performance, key accomplishments, challenges faced, and future outlook. It should also provide clear explanations of any significant variances or changes compared to previous quarters. A good quarterly should also use visual aids such as widgets, charts and graphs to effectively communicate complex information to stakeholders.
There you go. We’ve shared how to create quarterly reports from start to finish. We also have quarterly report templates to help you get started. Now it's your turn to use Visme to create professional quarterly reports.
With Visme’s intuitive report maker, you can easily create and publish effective quarterly reports that help stakeholders track performance and make informed decisions.
Design visual brand experiences for your business whether you are a seasoned designer or a total novice.
Try Visme for free


![How to Create a Practical Crisis Management Plan [+ Templates]](https://visme.co/blog/wp-content/uploads/2025/07/How-to-Create-a-Practical-Crisis-Management-Plan-Thumbnail.png)