


A Quick Guide on Sponsorship Marketing: Best Framework, Examples & Tools


Visual content marketing has been around for a while now, but some marketers are still unaware of how to use it to its full potential.
Statistics show 23.7% of content marketers cite visual content as their biggest challenge.
In this article, we’ll show you the types of visuals you can create, some examples of great visual content marketing and how you can make visuals of your own.
Let’s get started.
What is Visual Content Marketing?
Types of Visual Content You Can Use
Examples of Great Visual Content Marketing
7 Ways to Use Visual Content Marketing to Grow
Bonus: 5 Visual Content Marketing Statistics to Know in 2021
Visual content marketing involves using visual content, such as images, videos and GIFs, to convey information to your audience, build emotional connections and grow your business.
Contrary to popular belief, visual content marketing is not only about sharing pretty pictures and infographics.
It’s about understanding how the human brain processes visuals, and leveraging that information to boost your content marketing efforts.
So, how does the human brain work with visuals?
Research tells us that we tend to retain visual information for much longer than plain text or auditory information.
Visuals have also been proven to improve learning and comprehension, and increase the motivation to take action and consume additional content.
When it comes to marketing, there are several ways visuals can help.
Here are the top benefits of using visuals in your content marketing:

Now that you’re aware of why visual content marketing is important, let’s dig deeper into the type of visuals you can use in your content to make it more engaging.
Did you know that 43% of marketers struggle with creating visual content consistently?
It’s only natural to run out of ideas, but don’t let that dampen your spirits.
The key is to think outside the box and go beyond static images.
While that does require you to be more creative, it will help you stand out from your competitors and simply see better results out of your marketing efforts.
Here are some popular types of visual content you can start creating today.
From marketers to consumers, everyone loves infographics.
And why not? They look great, they’re easily shareable and they can pack a ton of information in a single graphic without making it look complex or ugly.
Here’s an example of an infographic that checks all these boxes.

Infographics are also amazing tools for driving website traffic, improving brand awareness and recognition, building thought leadership and boosting SEO.
You can use them as part of your blog posts to increase engagement, or you can share them on social media to get more eyeballs on your content.
Videos are one of most popular content types out there. On YouTube alone, people watch over a billion hours of video each day.
But is video marketing even effective for businesses? Let’s take a look at some statistics from Hubspot’s recent report:
Safe to say, if you’re still not using video to your benefit, you’re seriously missing out.
There are plenty of ways to use video content for your brand.
You can create speaker-view videos, explainer videos, screen-sharing videos, short films, and even informal, candid videos showcasing your company culture.
Look for opportunities to repurpose your existing content into short and sweet videos.
For example, you can turn your blog posts into videos and publish them on YouTube to reach a bigger audience, improve brand awareness and drive more traffic to your website.
You can even add these videos to your blog posts for visual learners who would rather watch than read, like we do at Visme.

One great tip is to first understand the type of content your audience likes to consume, and then create something similar.
Are your customers more interested in tutorials and explainer videos? Or do eye-catching product promos get them excited? Maybe they prefer more candid videos, such as behind-the-scenes footage of company events and photo shoots.
You can do some experiments to find this out, like posting various types of videos and analyzing what gets you the most engagement. Or, conduct a poll or short survey.
Photos are one of the most popular types of visual content out there for all kinds of brands and companies.
They’re easy to get your hands on, and can help you add a personal touch to your blog and content. But make sure you’re not using generic images that everyone else, including your competitors, is also using.

Here are some types of photos you can use for content marketing purposes.
Doing what everyone else is doing won’t do much to help you stand out and get noticed. Instead, find ways to use photos in unique ways, such as by hiring a photographer and taking your own photos, or by editing stock photos in a creative way.
Use filters, text overlays, effects and cropping techniques, or combine your photos with shapes and other visual elements to make them more creative and unique.
Going beyond static images doesn’t always means you need a create full-fledged video.
GIFs offer a great alternative if you’re looking to add something more flashy to your content, but not exactly a heavy file like a video.
For example, SaaS brands use memes and GIFs to show how their service works. This demonstration will provide a lot more value to the readers as compared to an image.
Plus, GIFs are very easy to find and curate for your posts. You can also create your own GIFs using a tool like Visme.
Visme’s integration with GIPHY lets you find relevant GIFs right inside the editor, which you can drag and drop onto your designs.
You can also create animated visuals in Visme and download them as GIFs instead of MP4 videos, and then upload them to your blog or share on social media.

Another type of visual that you mostly see go viral on social media are memes. Memes are recognizable images often paired with a funny caption.
Memes are usually made from screenshots or GIFs taken from TV shows, movies and other popular characters in the media.
Make sure you only add memes to your content if they align with your brand image.
At Visme, we prefer to use original graphics and illustrations over memes, but other brands do a great at job at making their content more fun with the help of memes.
Screenshots are one of the easiest visuals to use in your content if you want to make it more actionable and credible.
SaaS and other companies selling digital products can use screenshots to showcase how their product or service works.
In our blog, for example, we use screenshots of the Visme editor to introduce our readers to the drag-and-drop interface and other cool features they can make use of.

Similarly, if you’re marketing a digital product of your own, you can use screenshots when you talk about its features to back up your claims with visual evidence, which helps build trust with your audience.
If you’re talking about other tools and products, such as in a software review or how-to, you can use screenshots of the product to demonstrate how to use it.
You can even annotate your screenshot with arrows and boxes to highlight a certain part of it, such as a button or a section.
To put it simply, when you can’t find the perfect visual for your content, you create one yourself. In other words, you make an illustration.
Illustrations are a great way to make your visuals stand out and get noticed. They can be as unique, imaginative and original as you want them to be.
Illustrations can be used for various purposes, such as blog headers (take a look at ours!), social media posts and even in place of headshots.
In our blog post about the Visme GIF maker, we used illustrations of our team members instead of their real photos for a unique, creative touch.

You can hire an illustrator to help you create illustrations for your brand and content, or you can use a DIY tool like Visme, which comes built-in with hundreds of illustrations and icons.
In Visme, you can simply drag and drop these illustrations to create your own designs, like blog graphics, social media posts, infographics, calls-to-action, GIFs and more.
If you’re including statistics and research findings in your content, consider creating a visual representation of that data.
Data visualization can take many shapes and forms, such as bar graphs, pie charts, line graphs, area charts, histograms and donut charts.
Here’s an example of a pie chart template visualizing the most frequently used visuals in content marketing.

You can take any credible study, for example, and create a mini infographic-style chart to include within your blog posts. Just remember to include a source link somewhere in your visual or below it to give credit where credit is due.
In Visme, you can create 15+ types of graphs and charts, and download them as image files to add to your blog posts or presentations.
You can also visualize percentages and smaller statistics using data widgets, like radials, pictographs, thermometers and progress bars.
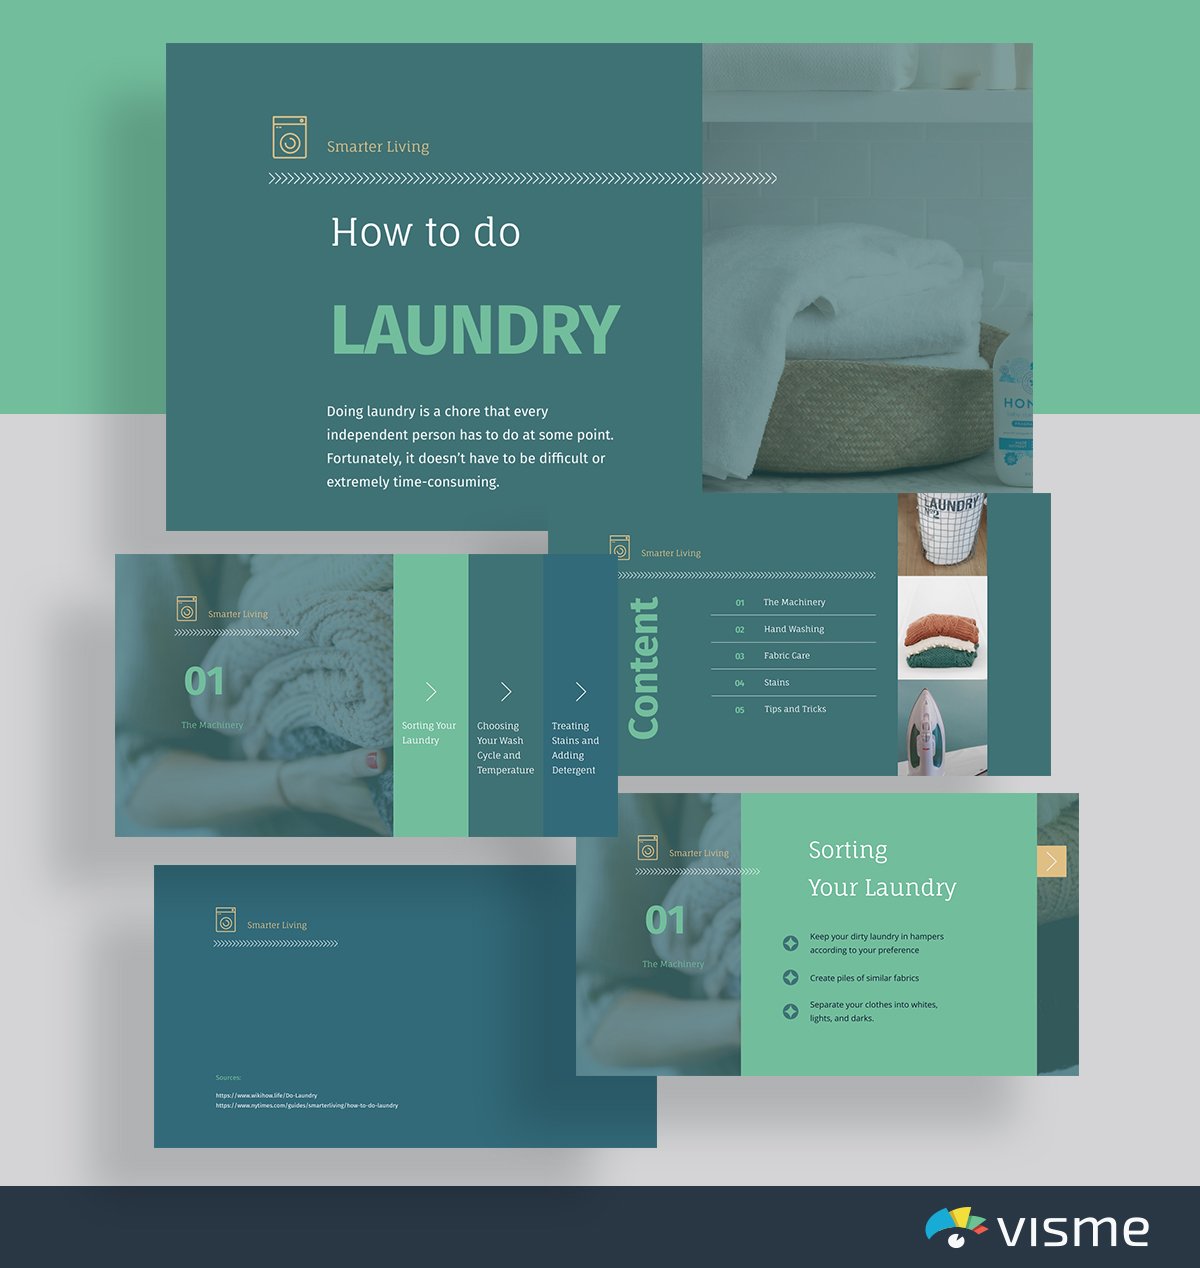
Another great way to add value to your content is to share a presentation or slideshow with your audience.
Well-designed slides can make it easier to share a summary of your blog post, a series of tips and even how-to steps.
You can also create slideshows that showcase your company’s products and services, and embed them in your blog posts to give readers a taste of what you can do for them.
Here’s a slideshow template you can customize for your own brand.
Wondering how to add a presentation to your content? It’s easy.
If you’re creating a presentation in Visme, you can simply click on the Share button and generate an embed code for your project.
Add this embed code anywhere on your website, such as within a blog post, to add the slideshow.
If you already have a presentation file saved on your computer, you can upload it to SlideShare and then embed it from there.
When using slideshows as part of your content, make sure you design them carefully so they’re aligned with your branding. Choose colors that are likely to engage your audience, and use minimal text and plenty of visuals to make your slides look more appealing.
You can also make your presentation interactive, which is especially useful if you want your audience to read through it on their own and engage with it.
For example, Visme’s presentation maker lets you add external links into your slides, link two slides together, and add buttons, hover effects, pop-ups, audio and more.
Watch the video below to learn more about how to create presentations in Visme.
Static images, GIFs and videos are not your only options.
What if your audience could actually click and engage with your visuals? Imagine what that could do for your content engagement!
Instead of just creating a static image, you can create a mini quiz, an interactive chart, an interactive map and more.
Here’s an interactive map template you can customize.
Try hovering on the different states to see relevant statistics. Pretty cool, right?
If you use a tool like Visme, creating an interactive visual like this is easy.
You can add hover effects, popups, links, animations and more, and then simply embed the visual within your content. No downloads needed.
Contrary to what you might think, calls-to-actions don’t always need to be annoying little buttons. They can also be great-looking visuals complete with illustrations and text.
Here’s an animated Visme template that can be customized as a CTA.

All you need to do is create a design like this, make the CTA button link out to your landing page, and embed the design into your blog posts.
You can also download it as a static image or GIF, and then link out the element itself to the landing page.
Now that you know about the different types of visuals you can create, let's get you inspired with some examples from actual companies nailing their visual content marketing.
Affiliate marketer Remy Tennant creates interactive comparison charts for his blog about keto protein bars — Human Food Bar.
Remy uses Visme to create comparison charts like the one below.

These interactive comparison charts are not just fun for the readers to engage with, but also increase the time that visitors spend on the blog, which is great for SEO.
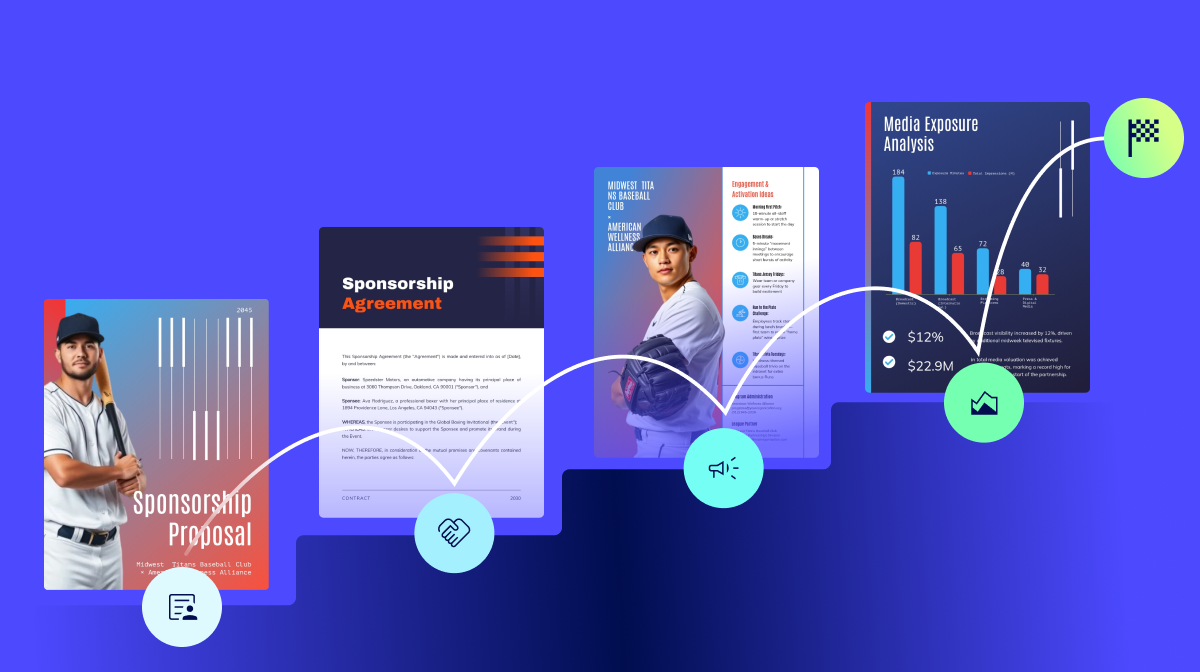
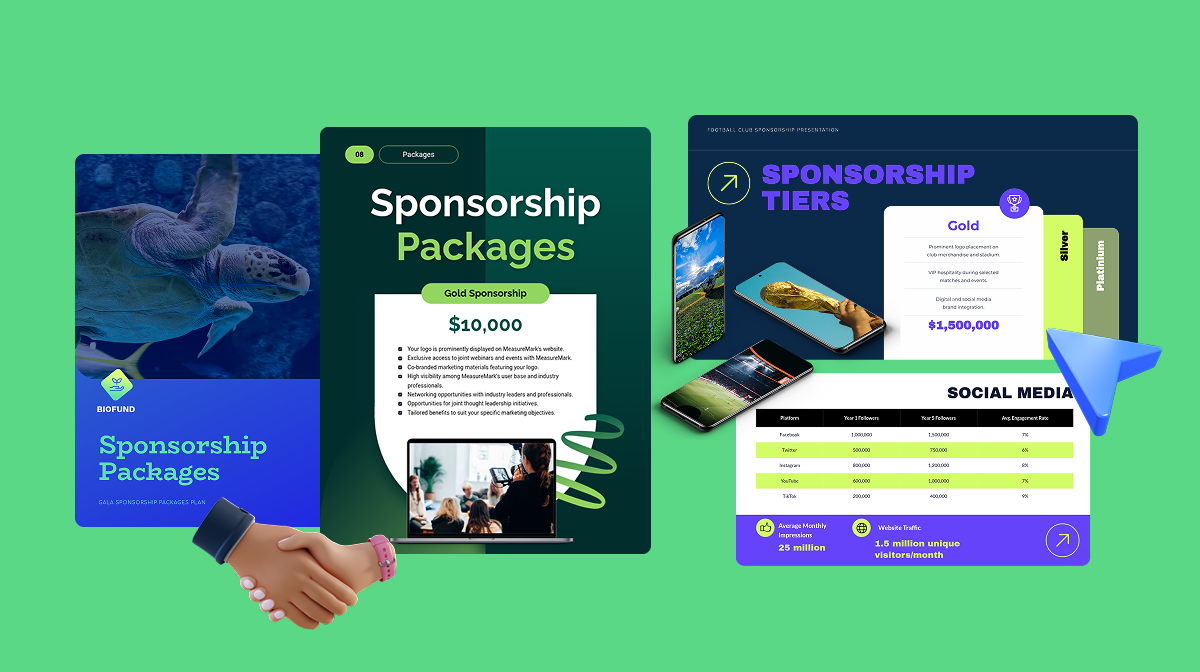
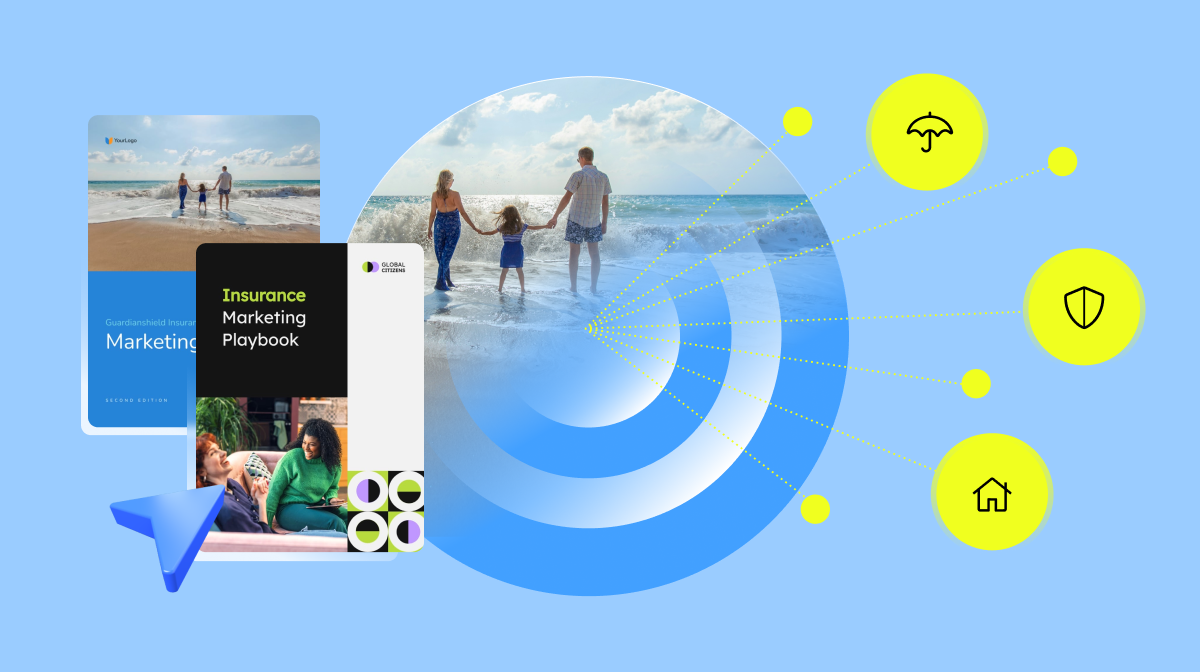
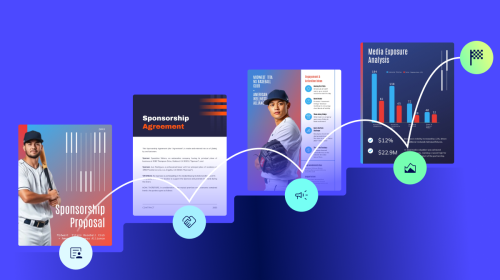
The career prep app, Career Karma, offers a great example of visual content marketing by creating downloadable PDF guides.
Creating this type of educational content in Visme has helped them drive more website traffic. Take a look at an example of their PDFs below.

You can easily create similar guides and PDFs in Visme by customizing a library of reports, whitepapers, proposals and other document templates.
Read more about how Career Karma uses Visme to drive website traffic.
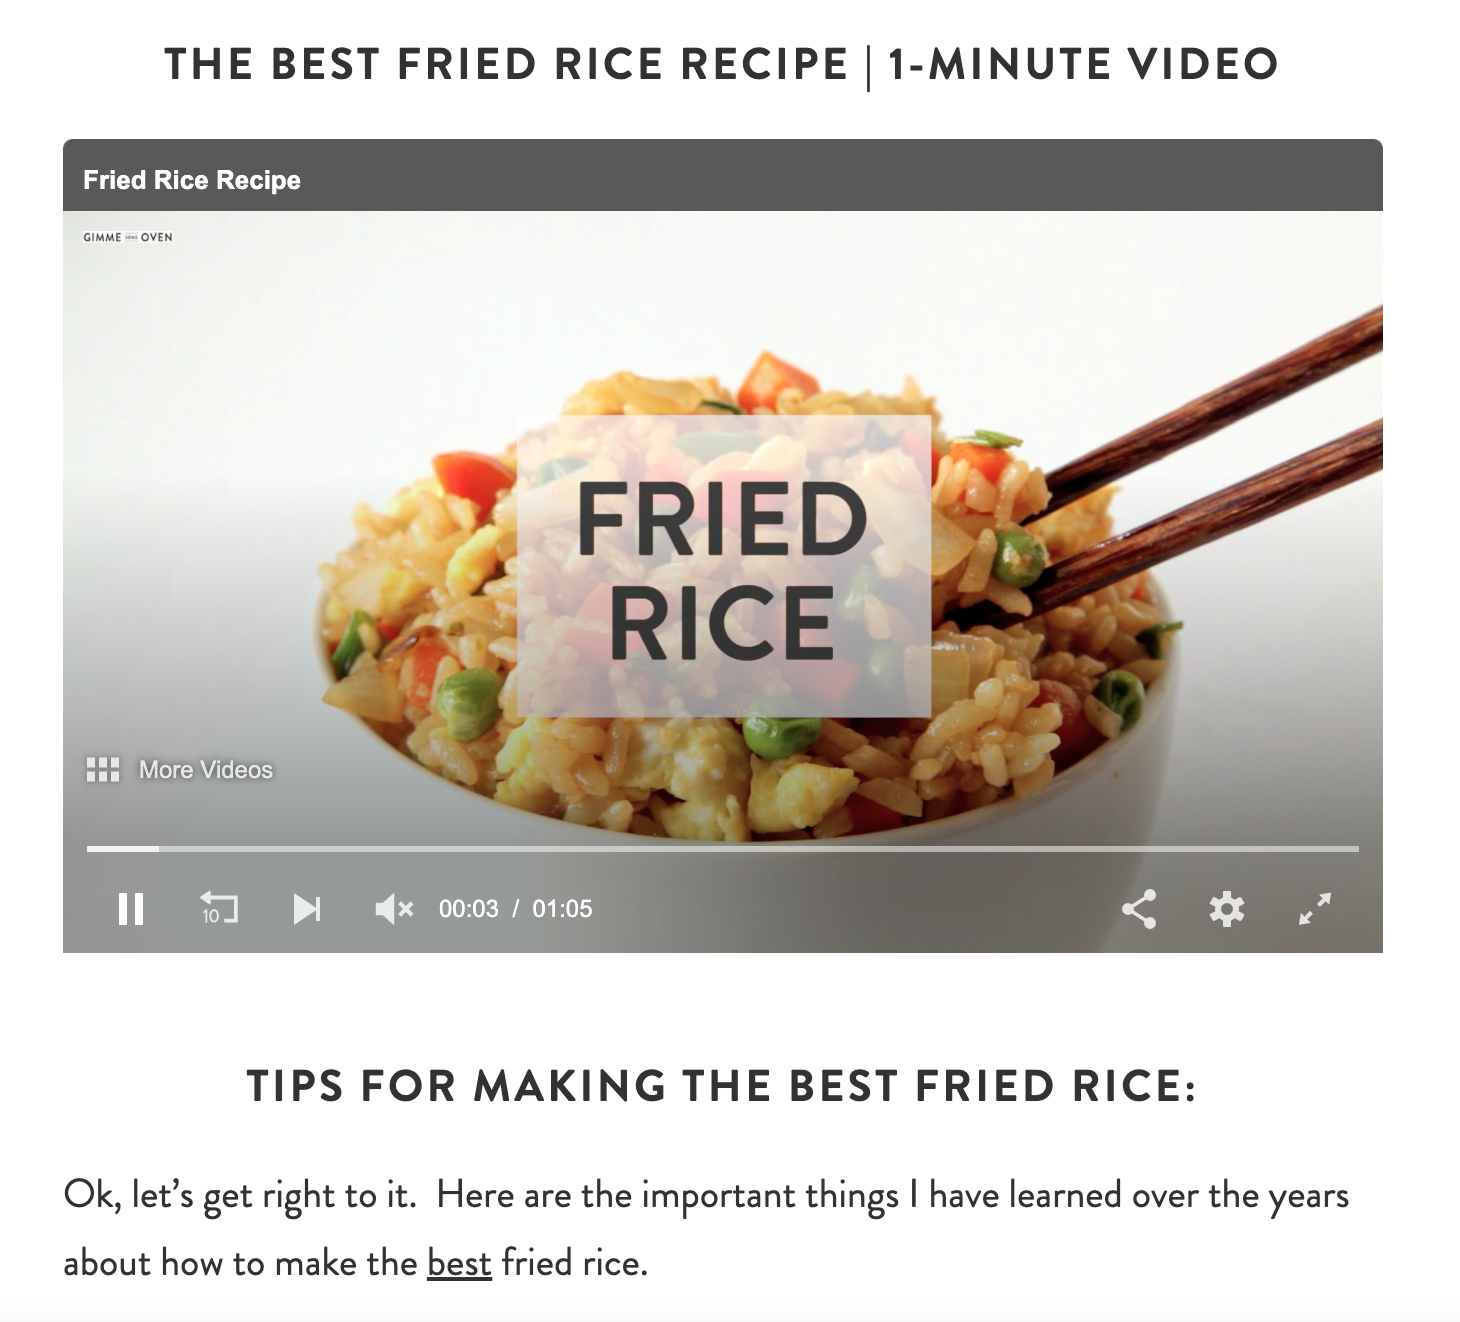
This recipe site is a great example of how you can use different types of visuals to enhance the appeal and effectiveness of your content.
Instead of just sharing a text-based recipe of fried rice, they’ve added high-quality photos to accompany each step.
Better yet, they have also added a video of the recipe for people who would rather watch and learn how to cook the dish rather than just read the recipe.
Using a mix of visuals and text can help you reach a bigger audience, offer more value, improve the clarity and impact of your message and make your blog more engaging.
Huda Beauty, an influencer-turned-entrepreneur, does an excellent job at visual content marketing on her beauty blog.
We especially love the mini interactive visuals she has used in her beauty pop quiz post.
Readers can click on the images to see if their answers are right or wrong, and then read a detailed explanation on the topic in the blog post.
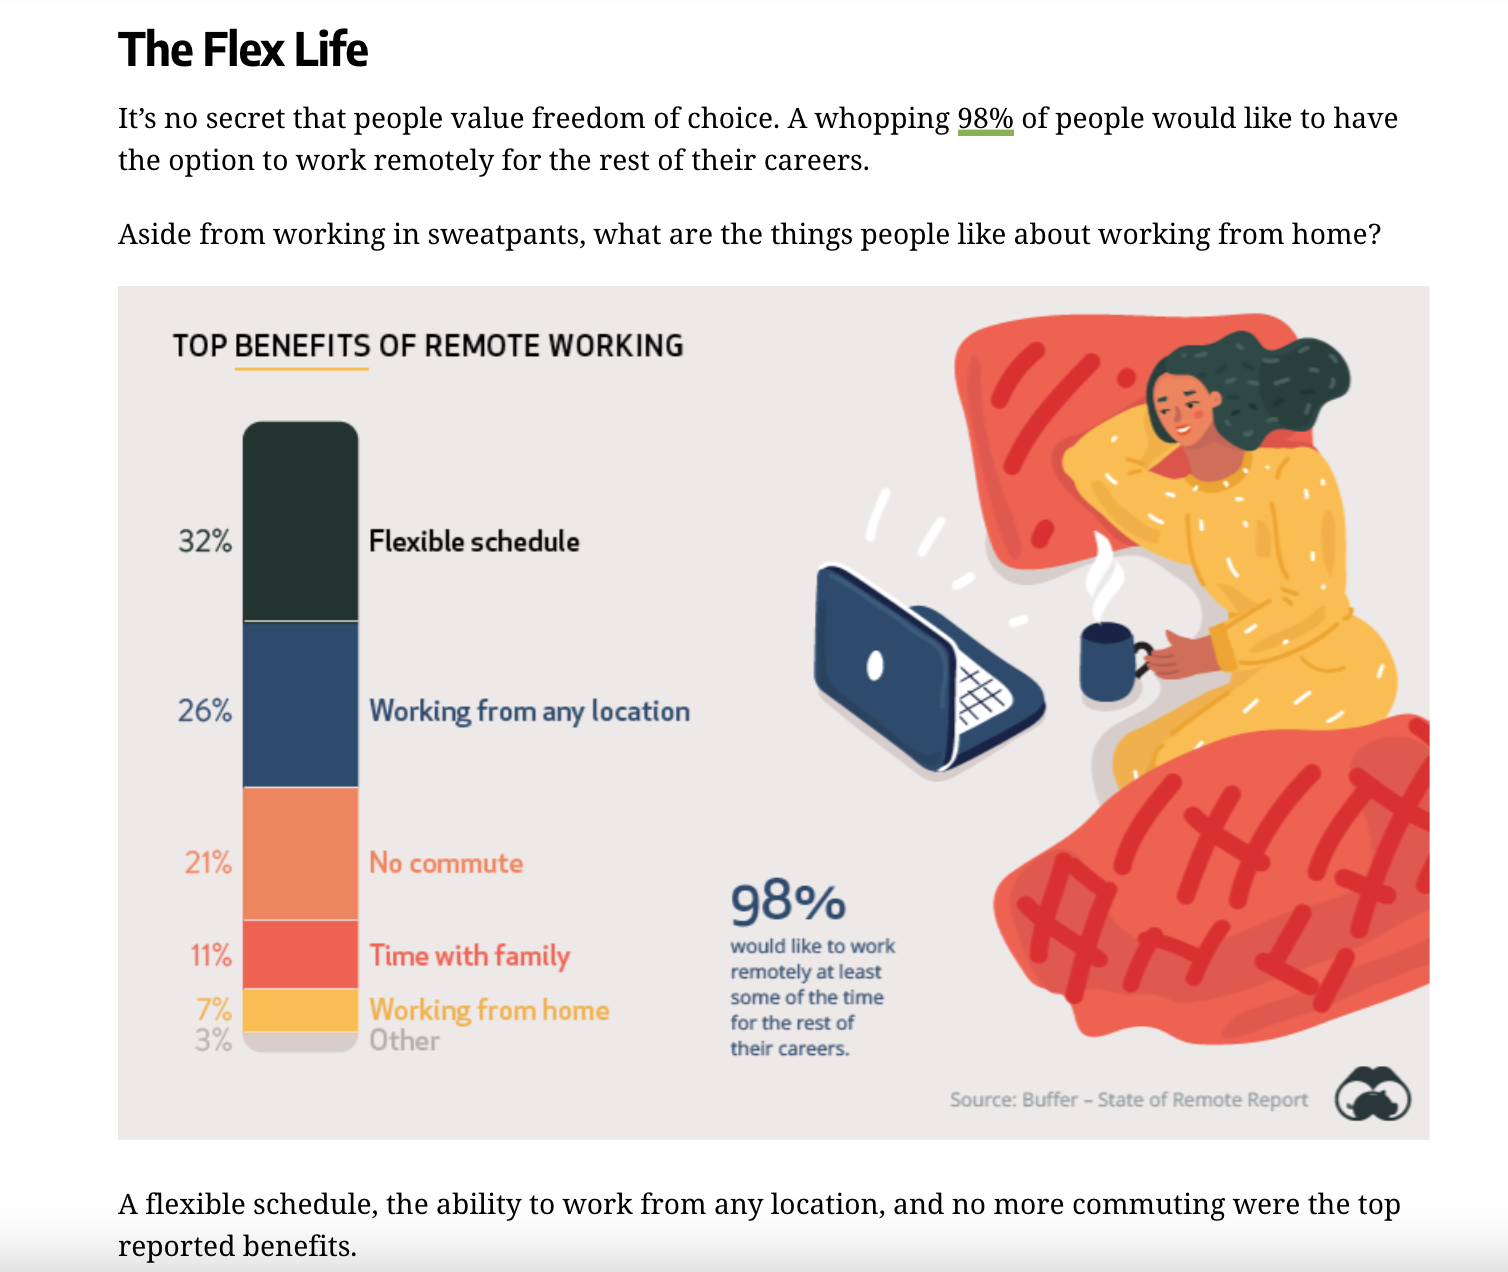
The Visual Capitalists blog focuses on publishing content that’s full of data-driven visuals, which is a great way to improve engagement and help readers look at the “bigger picture.”
The example above shows one of their blog posts on remote work. We love how the entire post is super easy to scan and make sense of because of the visuals sprinkled throughout.
Now that you’re aware of the types of visuals you can use and some great examples of brands nailing visual content marketing, let’s talk about the more actionable side of things.
It all comes down to how you use visual content to grow your brand; visuals can help you build authority, drive more traffic and get more customers.
But only when you use the right visuals with the right purpose at the right time.
Instead of creating visuals for the sake of creating them, think about why you’re creating each and every image, video or GIF.
Without a purpose and a visual content strategy, your visual simply won’t be able to bring you optimal results.
Below are some ways to use visual content marketing to grow your business.
One way to use visuals in your content is to showcase interesting and useful statistics with your audience.
Using data to back up your claims can help build subject authority, trust and credibility. A visual representation of statistics can also make your content more engaging.
Another benefit of sharing interesting statistics is that your content is more likely to get shared.
Whether it’s the entire post itself or the visual snippets from your article, statistics are something people love to share with their peers.
You can use different types of visuals for this purpose, such as branded blog graphics, GIFs, presentations or longer infographics.
Here’s a Visme template you can customize for sharing statistics.

A big advantage of sharing visuals similar to the one above is it helps break up the text.
Even if you explain a topic in detail in your blog post, for example, a visual like this can instantly catch the reader’s eye and make it easier for them to scan your article for related information.
Add more value to your educational content by creating a visual guide or tutorial for your readers.
This could be in the form of a presentation, such as a series of steps for a how-to post. You could also create a list-style infographic to guide readers through the steps.
Here's a tutorial presentation you can edit and use.
Another way you can visualize a tutorial is by using screenshots. This is an especially popular content marketing technique used by SaaS tools.
Walk your audience through using the various features of your tool by illustrating each step with a relevant, annotated screenshot.
Not only will this make your content look better, it will also help readers understand and replicate each step more effectively.
If you’re using expert quotes or customer testimonials in your article, highlight a few of them visually in the form of pull quotes.
A pull quote is basically a graphical representation of a select phrase, statement or excerpt from your article that stands out from the rest of the text.
At Visme, we sometimes create illustrated visuals for our pull quotes and sprinkle them within the content to highlight important parts.
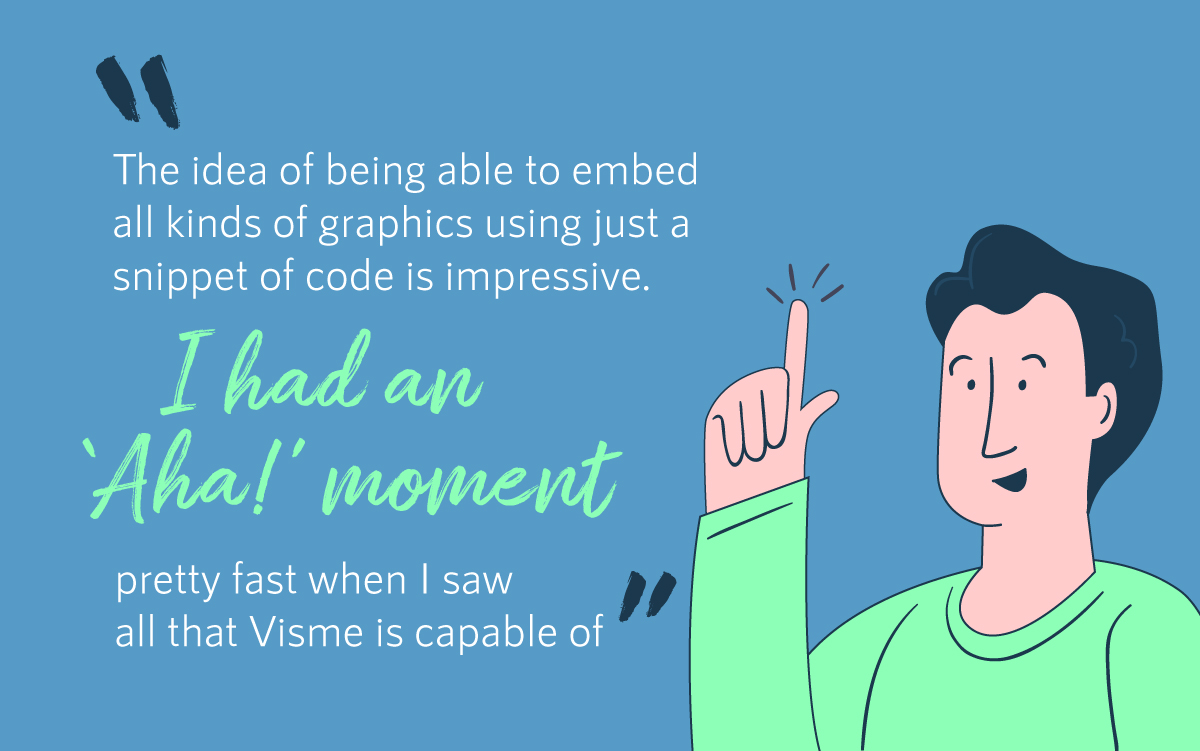
You can also take any other “shareable” bits and excerpts from your article and turn them into pull quotes to grab the readers’ attention.
Use this template to create your own pull quote graphic.

You can also use the template above to showcase customer testimonials within your blog content or on social media. It's animated, and you can download it as a GIF, but you can also choose to save it as a static image if you'd like or embed it.
The visual content you post on your blog can help you get more traffic to your social media profiles as well.
Place social media buttons strategically in your graphics, such as in the footer of your infographic, and link them out to your social media pages.
You can also enable social sharing on your visuals using a plugin like Monarch. This would enable readers to easily share your images on their social media with a single click.
If your visuals are getting shared on social media and other places on the internet, that’s great news for you. But does anyone even know those are your visuals?
Adding your logo or brand name to your visuals is like hitting two birds with one stone — reach more people with your content and increase brand awareness in the process.
Always add your logo at the top or bottom of your infographic. We recommend adding it to the footer as it’s less intrusive but still prominent.
There’s a space for your logo, company name and website in the footer of most of Visme’s infographic templates.

You can also turn generic stock photos into unique branded images with some editing. For example, create a social media post in minutes by adding some text overlay and your logo on top of a stock photo.
Infographics and presentations can be a great way to ensure your message reaches visual learners who would rather view an image than read an entire blog post.
At Visme, we do this quite often by creating infographics that summarize the main points.
We usually add these infographics at the top of our posts. People who want to read about the topic in more detail can simply scroll below.
You can also create a short slideshow that sums up your content, and embed it at the top or bottom of your blog post.
Another way to summarize your posts is to make a short video. Videos are more engaging than text, and can add value to your existing article by making it appeal to a larger audience.
If you don’t want to create visuals of your own, you can also directly embed tweets, Facebook posts and Instagram posts within your blog posts.
Here’s an example of what that could look like.
Here are some of the templates and comparison charts you’ll find inside the link below!
🎽 SaaS product comparison
💻 Business type comparison
✅ Pros and cons infographic
🚫 Dos and don'ts infographic
📊 Multi-product comparison chart https://t.co/I9iZUxULGq— Visme (@VismeApp) December 19, 2020
This embedded content makes for a nice visual break from walls of text, acts as an example, and is also interactive, meaning readers can click on it and engage with it.
Visuals are an integral part of content marketing. If you're not using them to their full potential, you're missing out on a lot of benefits, like more traffic, revenue and engagement.
If you're ready to get started with visual content marketing, consider using a tool like Visme to create, download and manage all your brand's visuals in one place.
Not only can you upload your own brand assets and use them across every single visual you create, you can experiment with various types of infographics, interactive charts, presentations and more. That, too, with the help of premade templates and built-in graphics.
Sign up for a free Visme account today and take it for a test drive.
Below are some interesting and recent visual content marketing statistics curated from various websites and researches to help guide your strategy in 2021.
People are likely to remember only 10% of the information they hear after three days. If that auditory information is paired with a relevant visual, they're likely to retain 65% of the information three days later. (Brain Rules)
94% of posts that use visuals get more views compared to posts that don't use visuals. (Jeff Bullas)
More than 96% of consumers claim to have learned more about a product from explainer videos, and 79% of them said a video influenced their purchase decision. (Wyzowl)
Articles with an image after every 75-100 words get twice as many shares as articles with fewer images. (BuzzSumo)
75% of people claim to see better marketing ROI when they use visuals in their content. (Contently)
Design visual brand experiences for your business whether you are a seasoned designer or a total novice.
Try Visme for free