


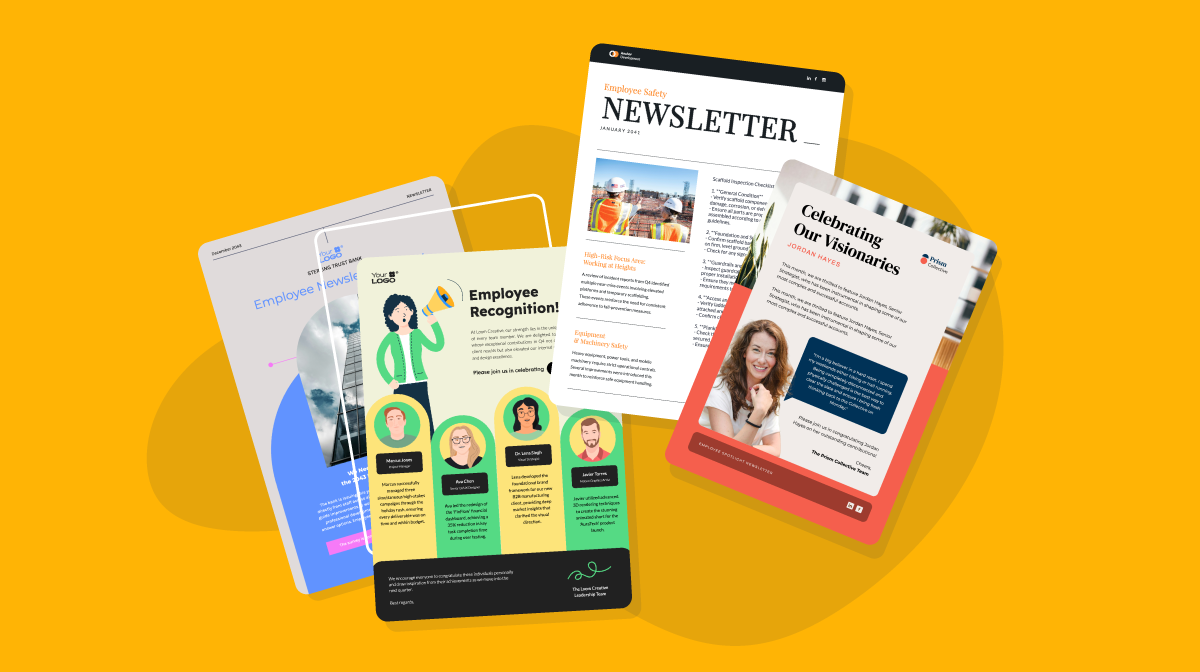
14+ Employee Newsletter Examples, Ideas & Templates

Are you looking for a business report template that’s engaging and attractive but also easy to customize? Look no further because you’ve just hit the jackpot.
Business reports provide clear, data-driven insights for informed decision-making. They analyze performance, identify trends, and assess risks or opportunities.
Whether it's a financial report, market analysis, or project update, business reports structure critical information to ensure stakeholders have the necessary details for strategic decision-making.
In this list, we’ve got 44 easy-to-use professional report templates to help you create reports for various purposes, from business to education.
Short on time or struggling with creative block? No worries! Save time and create winning proposals in seconds with the help of Visme's AI proposal generator.
Here's a short selection of 8 easy-to-edit business report templates you can edit, share and download with Visme. View more below:


Use the list below to navigate to the section that interests you the most. If you're interested in making an effective business report, we've got it all covered in this video.
Companies of any size can create an annual report, or year in review, to showcase growth, improvements, changes and other significant events from the previous year. As you browse through these annual reports, and cerate your own keep the following in mind:
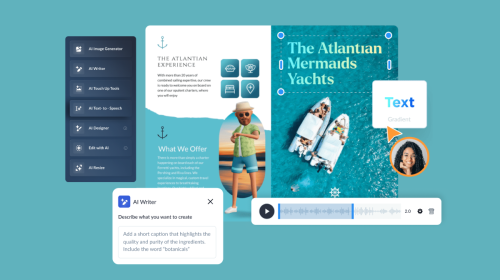
If time is ticking, Visme's AI report writer can churn out reports in minutes. Just describe what type of report and content you want in your report and watch the tool generate it in a few seconds.
Let’s take a look at the annual report templates available in Visme.
Showcase your ongoing environmental projects with an annual template that shines.


This template has five pages with spaces ready for your content.
The simple and elegant style is perfect for a no-nonsense business like yours. The environment annual report template is suited for content types with a large amount of text.
Duplicate pages as needed to add charts or more information to your report. Customize the accent color by choosing your brand color and changing all elements simultaneously. Make use of Dynamic Fields to ensure your brand information is accurate on all your report pages.
Click on the button above to create your nature-inspired annual report.
If you’re looking for a minimalistic infographic approach to visualizing annual report content, this template is right up your alley.


Visualize important information in snackable sections that engage and call attention. Make your report more valuable by creating interactivity through outbound links to more text-rich documents as support.
Use icons that match your company style and give your annual report some personality. Easily change the colors to your brand colors and make an impact.
Click on the button above to use this template for your annual report.
Create your reports easier, faster and better with Visme’s shortcut feature. All you need to do is hit the forward slash (/) and a search bar will appear. Just input the name of whatever you need and you’ll find multiple options.
Not all annual reports need to look stern and super serious. Why not have a little fun with your corporate report template?
This HR department annual report uses shapes and color to make the information attractive and engaging. To add more content in each section, simply duplicate pages and add textual content in color boxes that match the rest of the design.
Click on the button above to use this fun and vibrant annual report template.
All you need for a great-looking annual report is three intense colors and balanced composition.


Corporate annual reports don’t need to be text-heavy to be impactful—complement content-heavy pages with a minimalistic data visualization collage and a color-coded map.
"This report also includes a wide range of infographic and data visualization designs to simplify complex data into digestible information. Kaiser Fung, a data visualization expert and bestselling author of Death to Pie Charts, shares this best practice to keep in mind when adding charts to reports."
Statistician & Best Selling Author
Visme offers a wide range of charts and graphs to choose from so you can use the ones in the report as is or swap them out for ones better suited to your data. Plus add interactive popups in you report for added value to your pages.
Are you looking for a clean-cut modern design for your annual report?
This template is just what you need.


This free business report template is perfect for an impactful and memorable annual report with a stable combination of data and text content. Show your stakeholders what you achieved the previous year with style. This template and others can be repurposed into a white paper.
Choose a bold design with strong fonts and a contrasting color scheme in this annual report template.


Make a statement with this data-centered design and visualize the year’s financials in a balanced composition. Take advantage of photo backgrounds with a dark overlay to showcase data widgets and icons to visualize your content.
The business report outline and table of contents give your audience a snapshot of what’s contained in the report. Click on the button to get started with the personalization of this modern annual report.

Use a clean-cut linear design to demonstrate what your company achieved in the past year. This printable report template is just what you need.
This annual report template has strong background colors and straight lines—these contrast with a combination of desaturated photo section backgrounds and dark overlays on edge-to-edge photos.
Showcase your agency’s achievements and goals with charts, graphs and color-coordinated icons.
Click on the button above to personalize the purple and white digital marketing annual report.

"Choosing the right types of data visualizations for your report is an important topic. There are many types of charts, graphs, and tables suitable for reports. When deciding on which type to choose you can think of the purpose of the report and the audience you are designing for. Also, it is very important to pick the right chart for the data you are working with." - Dieuwertje van Dijk, Data Visualization Designer
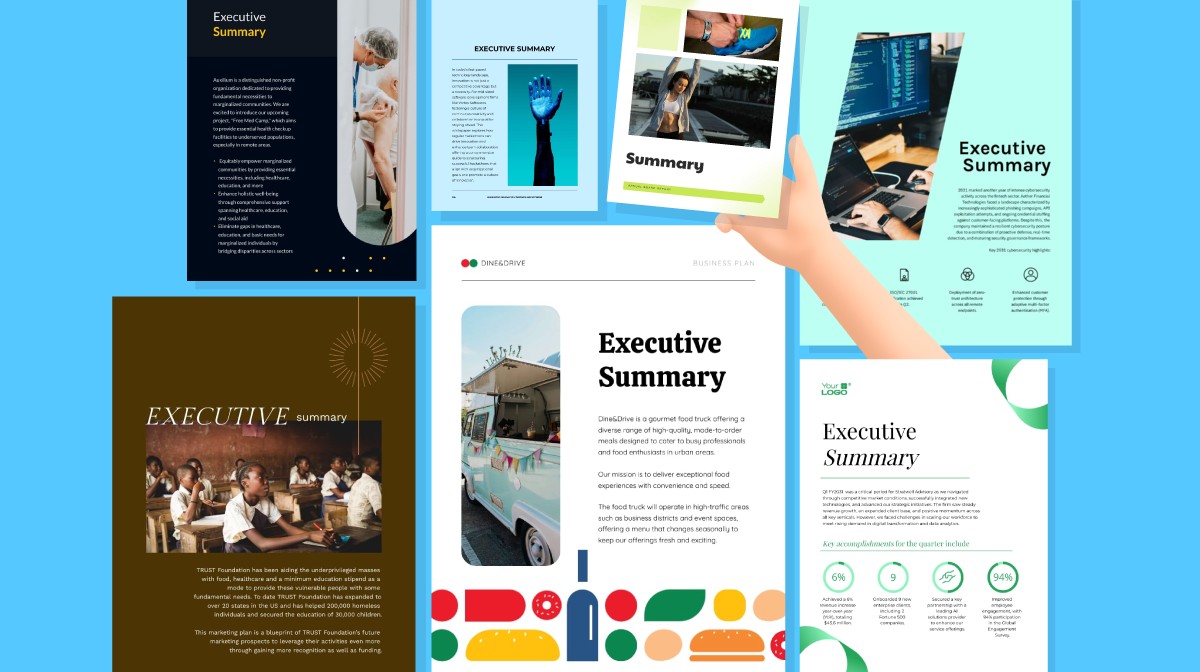
The second category in our report roundup is financial and professional report templates. These are reports which concentrate on financial and economic data
Are you looking for a beautiful and distinguished annual report for your business? This example of a report might be just what you need.
Use the provided photos in the placeholders or choose your unique visuals, either from your brand folder or the Visme photo library. Enter your content in the text boxes and personalize the charts and graphs with your company's data or market analysis.
If you don’t find the graphics you want, Visme's AI image generator ensures you never run out of options. Simply type an accurate description of what you want. The tool will generate high-quality photos, paintings, pencil drawings, 3D graphics, icons, abstract art, and more.
Duplicate pages to add more content, either text or visuals and make your report richer. Improve your report by creating a digital and interactive report with video and interaction that you can share online.
Click on the button above and start personalizing your beautiful report template.
Share your key performance indicators in a compelling document that you can customize week to week.
The KPI Weekly report can be your branded, corporate report template to use every week within your team. Simply switch the colors and the fonts and save the document as a template in your Brand Kit.
Use our Google Analytics integration to add detailed charts and graphs of the week’s performance. Duplicate as many pages as you need. Insert all the charts and data visualizations necessary to share pertinent KPIs.
Click on the button above to start sharing key performance indicators in style. Then take advantage of Visme’s analytics reporting to check your report’s performance.
Financial reports visualize past performance and also promote more business. This promotional template does just that.
Use the template imagery already included in the template but we suggest you use photography from your business. As a promotional document, you should be using content from your work and data from your performance.
Detail the performance of your ongoing and past campaigns and describe the future campaigns you have in store.
Click on the button above to create your promotional report with stunning visuals.
Do you need a report to visualize your budget to share with investors and stakeholders? This free company report template is just what you need.


Showcase your company’s budget in an impactful and unforgettable design. Input your data for the graphs by importing a CSV file, a Google Sheet, or by hand. Use your company colors to color code the diagrams and maintain a visual identity.
Add photographs of your products or campaigns to make the template your own. Duplicate pages if you need to show more data or share additional content.
Click on the button above to personalize this budget template and share your goals and projections with stakeholders.
"Financial statements are not just numbers on a page; they tell a story about a company’s past performance, current standing, and future potential. By interpreting these statements, stakeholders can make informed decisions, whether investing in a company, assessing its creditworthiness, or guiding strategic initiatives. The ability to decode the language of financial statements is a valuable skill for anyone navigating the business landscape." -Eli Hogan, Controller & Account Manger
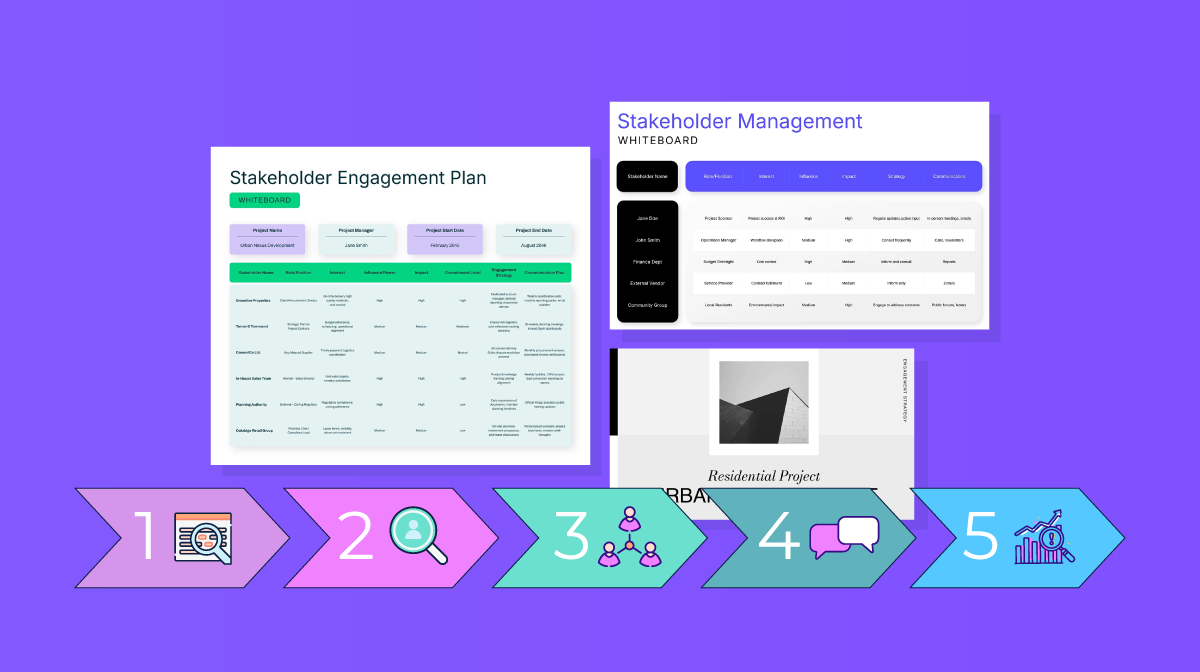
The next category on the list is all about project reports. This particular category is not so much about the topic but more about the report format. Here you’ll find both business report templates and academic report examples.
Let’s dive in.
Book reports don’t need to be bland and forgettable. If you’re looking for a way to make your book report unforgettable, this template is the answer.
This book report template has all the sections you need to showcase your chosen book’s summary and personal commentary. Select imagery from Visme’s library, with millions of photos to choose from, or upload your own. Be sure to add visuals—adding images and videos to blog posts has been shown to improve performance, according to 33% of businesses.
Add color-coordinated icons and illustrations to visualize the content sections in the report.
Click on the button above to start creating a beautiful book report for your studies.
Is your team working on a project? You’ll need to keep stakeholders in the loop about what’s going on. This template is just the thing you’ve been looking for.

Every section of this report template showcases every step of your project’s process. The content was created for a Landing Page design and implementation but will work for any project type.
Change the colors and fonts to match your company brand and save the final design as a template for your team members to use on future project reports.
Click on the button above to start reporting your project’s progress in style.
If you’re looking for a visual and exciting way to report a scientific analysis, this template is right up your alley.

The analysis lab report template has seven pages full of visualizations like tables, flowcharts and graphs to share your scientific findings. There is enough space for written content to support the data.
Wow, your professors and lab teammates with a well-designed analysis report that goes above and beyond a spreadsheet. If you have Tableau visualizations, you can bring them into your pages for added value.
Click on the button for the template below to start creating a visual scientific lab analysis report.
An Industry Report showcases research conducted about a specific industry’s status; the past, present and future. This real estate industry report template might be just what you’re looking for.

The Real Estate Outlook report has five key sections for descriptive text, industry analysis and projections. Use the color-coded data widgets to visualize specific areas of data and information.
Change the images to represent your research and either keep the yellow or change the accent color to something more suitable. Use a legible font for the paragraphs and a strong font in the headings.
Click on the button above and start putting together your industry report.
Research reports range from any variety of topics and niches. If you’re looking for a report template to visualize and share your research project, this template is perfect.

With a modern take on report design, our Effects of Stress report has a good even mix of text content and data visualization. Photography and imagery play a simple role in this report template as a storytelling angle.
Add your research content to each page easily by pasting your content and then adjusting the size and spacing. Use the same colors or change them for others in the color theme library.
Click on the button above to use this project report template for your research.
Are you looking for a better way to show the status of your project? This status report template might be just what you need.

Your team members and stakeholders will look forward to seeing your well-designed reports and get excited about the process. Even if you’re running a project for your client, this project management report template can also be a powerful tool for communicating progress.
Use as many data visualizations as possible to show the data and the timeline of your project. Personalize the timeline page to follow the steps of your team’s progress, including your goals and expectations.
Click on the button above and bring fun back into your project status reports.
Market research is a big part of the E-commerce industry and teams work better when they know what they’re up against. This report template is just what you need to show your findings.

Across seven initial pages, this report sets you up for a great start to your industry report. You’ll likely need more pages if the research is extensive. Duplicating pages is easy; all you have to do is input your text and data.
Select a different color palette from the color theme selector in the toolbar or use a new color palette that you can create yourself.
Click on the button above to start personalizing this fashion industry report.
Trend research for your industry needs a report to show findings and projected outlooks. This template is what you need to get started.

Present your important research using this uniquely designed template. Asymmetrical layouts and bright color accents are what make this trend report unique. All you have to do is input your content and research data.
Click on the button above and start visualizing your data in a meaningful way.
Social media teams are always having to show their progress and ongoing work. For those searching for a visual solution to a social media report or the results of a social media marketing plan, this category is for you.
Social media ads are a big part of digital marketing and need to be analyzed from beginning to end. This report template will help you do it better.

This template has just the right pages to get your report started—an introduction, strategies, result and conclusion. If you need more space for added content, simply duplicate pages and you’re ready to go.
If you have Google Analytics tracking for your social media ads, simply use our integration to add your results from GA directly. Personalize your charts to match the rest of the report.
Click on the button above to start creating better social media ad reports.
Monthly social media reports don’t need to be boring or bland. If you’re looking for a way to spice up your reports, this template will help you.

This 8-page printable report template was designed with a geometric color block layout that makes an impact. Your social media data can be easily copied into the placeholders for your team and stakeholders to visualize. Charts and graphs are laid out over a couple of pages so you can select which types of charts you need.
Use the Visme and Google Analytics integration to add current GA data to your report. Personalize and customize your charts with the Visme Graph Engine.
Click on the button above to start personalizing your monthly social media analytics report.
Sometimes it pays to keep things simple. That’s where this one-page template comes in.

Include this template as a PDF in your digital report files, or print out low ink copies on recycled paper to use in a binder. Change the fonts and colors to match your brand, or use your favorite fonts for a little fun.
Click on the button above to personalize this one-page printable report template in minutes.
“One of the best components of a good social media report is brevity. There are so many intricate insights and analytics at our fingertips, but being a good Social Media Manager is knowing which to include. Then highlighting the most important insights using charts or design elements, making sure they impact the viewer.” Chelse Hensley, Social Media Manager.
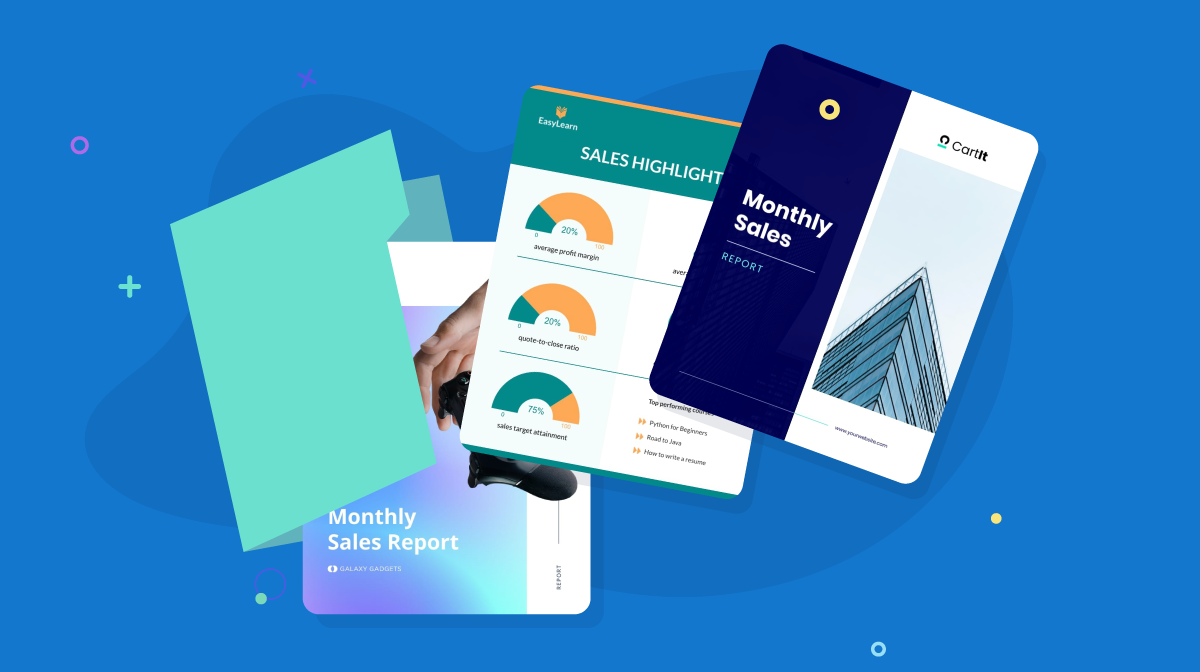
Is your sales team searching for a better way to report progress, solutions, and goals? These sales report templates are exactly what you need.
Do you need to report on your sales for the year? This template is your solution.

This template’s pages give plenty of visual space to charts and graphs to showcase your sales data—large charts for more critical data and smaller charts for varying layers of importance.
The bright color block design is perfect for a dynamic company that stays away from bland reports.
Click on the button above and start making memorable yearly sales reports.
Are you looking for a free report template that will make the monthly meeting a breeze? This template is just what you need.

Big and bold numbers make it fun to visualize the quantitative data that doesn’t fit into a chart. Show off how much you sold this month and make an impact with your report pages.
Customize the colors and fonts to match your brand using the Visme Brand Kit or choose your favorite color theme from the toolbar.
Are you running a promotion and need to show progress, timelines, goals and achievements in one report? This template is what you need.

Black and white images contrasting with a vibrant yellow are what makes this template so unique.
To use your photos, simply replace the ones in the template and the filter will apply automatically. Choose the accent color if your brand colors are different.
Input all your data in colorful charts and data widgets without wasting time. Simply import your Google Sheet data and customize the colors to match the rest of the report.
Click on the button above to start personalizing the promotional sales template.
Your SaaS company needs quarterly reporting. You need this corporate report template to get that done in style.

The best part of creating digital PDF reports with Visme is that you can use hyperlinks to navigate the pages you want to see the most. Additionally, you can add popups to provide more information than what fits on the page.
This template has all the makings of a memorable quarterly report. Save the first one as a template and simply reuse it every month. Don’t forget to change the date and data and you’ve got yourself a perfect reporting system for your team.
Click on the button above and start personalizing your SaaS quarterly reports.
Reporting quarterly sales for your company doesn’t need to be a difficult affair. With this business report sample, you can visualize sales for your team in style.

Quarterly reports tend to be long and full of data. This free business report template has eight pages to get you started in the right direction. Use the overall layout of the pages to format your text and data in one stylish document. You can highlight major changes, operational reporting, budget changes or improvements and more.
Embed bigger data visualizations from Tableau or Power BI with our third-party media integration. You can add as many as you need and personalize it to match your brand and the rest of the report.
Click on the button above to personalize your next quarterly sales report.
"When I’m creating a sales report, I have a scope of analysis and data that needs to be reviewed together to drive a decision. As you pull together data and craft your report, don't forget the golden ticket is to try to predict the questions that will come up, and make sure you have data and visuals to answer those questions too." -Kalyn Lewis, Head of Sales at Visme.
Your marketing team is continuously creating reports to show other groups in the business or the team leader. Small businesses need to keep track of their marketing efforts as well.
With these report templates, no marketing reports will ever be boring again.
Every month, your marketing reports need to be filled out. With this minimalist design template, you have it all set up for you.

This business report sample has soft color backgrounds, minimalist layouts and just enough elements to visualize your information stylishly. With a design like this, it’ll be easy to personalize the sections in no time.
Click the button above to personalize this stylish marketing report template.
Need help with drafting the content for your report? Use Visme’s AI Writer to generate text quickly based on prompts and work smarter, not harder.
Are you looking for a report template for your retail business? This design is just what you need to visualize your marketing achievements with impact.

Bright colors in icons and backgrounds and large bold numbers make up a unique layout for an impactful marketing report. Easily customize the color palette to match your brand and switch the fonts for your brand typography.
Add complimentary photography and imagery by searching our vast library of visuals. If you’re working on a digital report, add videos or animations.
Click on the button above to personalize the retail marketing report.
"When creating marketing reports, it’s easy to get caught up in storytelling and crammed in data. But the real focus should be on problem-solving. Your marketing report needs to make the next steps crystal clear—no ambiguity, no second-guessing. Whether you’re presenting results for a campaign or quarterly review, provide clarity on what the data actually means and how it informs the path forward. Make sure your audience not only knows what happened, but what comes next." -Victoria Taylor, Head of Content at Visme.
Reports are created and presented weekly, quarterly, yearly or monthly. This category is all about monthly reports for those of you who need them.
Let’s take a look at all the monthly report examples.
Is your customer service team looking for a better way to share results? This pre-designed report is just what you need.

Reporting KPIs in the customer service department is essential for getting to know your client base. Following along with how many requests are coming in and who is taking care of what is a great way to improve customer service with time.
Save the first edition of this report as a template in your Brand Kit and reuse it every month to showcase customer service achievements.
Click on the button above to report customer success with impact every month.
Turn the insights from this report into an ebook and use it to generate leads. You can do so easily with Visme’s lead magnet templates.
Take it a step further and accompany your lead magnet with an engaging lead form. Visme Forms can help create an enriching experience that will drive twice as many conversions as traditional forms.
Is your sales and marketing team looking for a template to report monthly achievements, financial reporting and budget allocation? This printable report template is just what you need.

This simple template has everything you need to start reporting monthly sales visually and interestingly. Your team will be glad to get a report like this instead of boring spreadsheets and documents with walls of text.
Simply input your data and descriptive content into the placeholders. Use color-coded icons and charts to make your information beautiful.
Click on the button above to start reporting monthly sales and achievements with your team.
Keeping consistent reports in the customer service department makes every team member invested in the work they do. A template like this one can help show the metrics to your team and stakeholders to keep everyone inspired to do their best work.

The seven pages on this template have a unique design with a balanced composition of colored shapes. Each page has a significant structure to showcase content or data about your company’s service team.
Import your data from Google Sheets, Excel, Google Analytics or SurveyMonkey. Then personalize the colors and the layout to match your brand and your report.
Click the button above to create your first monthly report for the service team. Plus feel free to repurpose this template as a monthly management report with more high level details.
The success of your email marketing efforts deserves the best reporting features. This corporate report template has everything you need to share successes with your team.

Not all corporate style designs look as good as the pages on this report template. Using intense colors and large-scale photography, you’ll be able to visualize data in pre-designed sections.
Click on the button to share the results of your email marketing with your team.
Quarterly reports come four times a year. This year, why not create one with this template and then use it as a base for the rest of the year.

With this template, you can start reporting quarterly results for any team in your company. These pages are the perfect start for an ongoing reporting strategy from sales to marketing and customer success.
Duplicate more pages to create a longer report with more diagrams and charts according to your data.
Click on the button above to gets started with the simple quarterly report.
"When designing financial reports "Less if more". An over used phrase, but it is the truth: always look at your overall design and try to remove any unnecessary elements. You have to have enough white/blank space in your report to balance out the data, copy and design elements. Be purposeful with your report’s content." - Alejandra Mariscalez, Head of Design, Visme
The eighth category on our list is all about nonprofits. They also need professional report templates. This is an important category for nonprofits that need to report their progress to grant donors.
Let’s dive into the reporting templates below.
If your nonprofit needs to create an annual report to show the results of last year’s efforts, this is the template you need.

This annual report template has five main sections for a foreword, quick facts, contribution and upcoming projects. The data visualization on the pages is minimal, with the spirit of showing qualitative data more than quantitative.
Change the photographs to match your particular nonprofit by searching through our extensive image library.
Click on the button above to create your nonprofit annual report.
Unlike the template above which is more about specific poignant data, this template is more about larger financial data sets.

The majority of this report’s pages have plenty of data visualizations, diagrams, charts and timelines. Import your nonprofit’s financial data into the placeholder graphs easily and color customize to match your brand.
Click on the button above to start visualizing your nonprofit’s financial reports.
On occasion, a nonprofit annual report has to show a large amount of data. Nevertheless, it doesn’t all need to be included in an overview report. This template is perfect for that.

This template is the perfect start to create an interactive digital annual report.
Use the icons in each section to add popups with additional information. Apart from popups, you can also add hyperlinks to take your viewers to more detailed information about each area.
When done, share and publish your interactive report with a live link or download it as a PDF.
"A nonprofit (annual) report—a yearly overview of an organization’s financials, accomplishments, updates, and more—must be designed well. Unlike Form 990, an annual report can be considered a marketing tool.
In order to garner donations, supporters must be able to trust the organization they’re contributing to. When nonprofits publish reports that are poorly designed, unprofessional, and don’t match their organizational brand, supporters can question the validity of an organization. Well-designed annual reports help build trust, and remind readers of your mission." - Josh Kligman is the CEO of Storyraise
Reporting weekly status reports for team projects doesn’t need to be a tedious affair every time. With a corporate report template like this, you can make weekly reports fun. You can even use a one page report template or one that has multiple pages for your weekly report.
If you need help with writing a weekly report, we have a great tutorial on our blog.
Content marketing efforts need organization. In some cases, it needs to be weekly. This one-page template is great for quick notes to keep it all on track.

This weekly content marketing plan has a space for each day with specific notation areas for ideas, competitor analysis and keyword research.
You can use this professional business report digitally as a pdf to fill in by your team. Alternatively, print out and copy to keep in a binder.
Click on the button above to start creating a weekly content marketing weekly report.
If you’re looking for a versatile weekly report that can work for any type of data, this template is just what you need.

One sheet with simple empty sections to fill out as you see fit. Short business reports like this one work magic for communicating weekly performance.
Do you need to report social media? Add that as a subtitle. Looking to report daily interactions with a specific customer or collaborator, note it down here.
Click on the button to personalize this report template for anything you need it to be.
Executive reports tend to be long and full of important information about a company’s ongoing projects, successes and failures. These reports need a weekly summary to keep track of reporting on an ongoing basis.

This executive summary weekly report is a one-page document. It has daily placeholders for different team sections to fill in according to their part of the work. It's inspired by one pager design that makes it easy to fill, update and share on a weekly basis.
Change the colors and fonts to match your brand and make multiple copies of the page. Use digitally as a PDF or print out to use in a binder.
Click the button above to get every person of your team tracking progress about a project in the same way.
Does your retail business need to report weekly progress in a visually impactful way? This template is just what you’ve been looking for.

Intense colors and delicate details on the pages of this professional report template create a unique visual experience. Help your team report important data and company information memorably.
Click on the button above to start reporting weekly retail data.
Your content team is working hard to bring results to your company. To let the rest of the team know the results, you need a template like this one.

The three main sections in this business report template include content types, content metrics and team performance. The pages have all the right charts to get you started with a content report that makes sense and keeps the team inspired.
Color-code the charts to match your brand and the rest of the report. Make sure to add all the information you need to share into the placeholders and include hyperlinks to the best-performing content.
Click on the button above to get started with your weekly content report.
All teams in your company need to show the progress of the work they do together. This template is perfect for employee performance reporting.

This professional business report is a great starting point template for a digital report that includes pop-ups and hyperlinks to more data that won’t fit into five pages.
Easily personalize the icons and overall layout of the report to match your brand. Embed your data into a collection of charts and graphs that visualize your team’s progress memorably.
"Weekly reports need frequent updates, so choose a standard template and stick with it. Using a pre-designed template with everything you need already set up saves time and brainpower—no need to design from scratch every time. It also helps to have a polished template ready for sharing with people outside your department. Ditch the boring Word doc and go for something professional yet fun." - Victoria Taylor, Head of Content at Visme.
Before digging in to browse the business report example list, we answer your most pressing questions first.
A business report template is a predesigned document that anyone can use to create a professional report without needing design skills.
But what makes a report template even better, A BRANDED report template.
Branded report templates are like a secret weapon for brands and organizations to create reports and other visual content regularly and easily. Using branded templates democratizes the design process inside organizations and teams. You can save money and time by using branded business report templates and other visual material.
There are many types and styles of business reports. For example:
In the list below, you’ll discover plenty of report templates organized into 9 different categories. Choose the one you need for your purpose and goal and start creating!
Writing a business report is much like writing other documents; as long as you follow a standardized formula, you’re good to go.
Follow these steps to get started:
Read this article to get all the pro tips for writing a business report.
Business reports vary widely according to their need and purpose. But there are five main parts that you can’t skip out on, no matter what. Make yourself a checklist and never miss one.
A business report format template can help you save time by organizing the layout first before adding the content. It keeps work aligned with the main goal.
Here’s a general overview of a business report layout and format. The details will change according to your content.
Read our guide on report writing to improve your report-creating skills in no time.
Wow, that was a long list of professional report templates! Did you find the one you liked the most for your content? Now it’s time to get to work!
Before we continue, did you know that even though business reports are printable? Yes, and they can also be digital, interactive, and animated!
Take, for example, our case study about how UCLA creates interactive reports with Visme.
With Visme, you’re able to create printable business reports for your business or any industry. Your Visme reports can have many pages and all the tools to visualize your data in many different ways.
Get started by creating a free Visme account, or click on the button below each business report template in the list above to register and start editing the business report.
Design visual brand experiences for your business whether you are a seasoned designer or a total novice.
Try Visme for free


![How to Create a Practical Crisis Management Plan [+ Templates]](https://visme.co/blog/wp-content/uploads/2025/07/How-to-Create-a-Practical-Crisis-Management-Plan-Thumbnail.png)