The Best Beautiful.ai Alternatives to Create AI-Powered Presentations


I started using Prezi back in university. It was my go-to for course presentations, group projects—you name it. I still remember the first Prezi I ever built in 2017.
But since 2020, Visme has taken that top spot for me. It’s the first tool I reach for now, whether I’m creating slides for a client pitch or a branded infographic for a report.
Don’t get me wrong. Both tools are brilliant. They’ve reimagined what’s possible beyond static PowerPoint slides, and each one offers features that help you build seriously engaging content.
But there’s a clear difference in how they approach things.
In this article, I’ll share my first-hand experience using both Visme and Prezi, two of the best presentation software options, and how they stack up when it comes to ease of use, animation and interactivity, AI features, templates and brand kits, collaboration and more.
So if you’re looking for a deep, honest, side-by-side breakdown of Visme and Prezi… this is it.
I’ve actually used both Visme and Prezi, and I’ve created multiple projects with them over the years, so I know where each tool shines and where each falls short.
I currently have premium access to Visme, but not to Prezi. So while there may be some advanced features in Prezi I couldn’t test hands-on, I made sure to do my homework.
I read through dozens of G2 and Capterra reviews, watched YouTube tutorials and walkthroughs and dug into real user feedback on Reddit and LinkedIn to fill in the gaps.
All that to say, this guide is written by a real person (that’s me), for real people (that’s you) trying to make a real decision.
*Disclaimer: The comparisons and competitor ratings presented in this article are based on features available as of June 11, 2025. We conduct thorough research and draw on both first-hand experience and reputable sources to provide reliable insights. However, as tools and technologies evolve, we recommend readers verify details and consider additional research to ensure the information meets their specific needs.
Here’s a quick side-by-side look at how Visme and Prezi stack up across the features that matter most:
| Visme | Prezi | |
| Ease of Use | Intuitive, drag-and-drop editor with guided features | Zoomable UI with drag-and-drop editor |
| Versatility | Supports many content types: presentations, docs, reports, infographics, forms, whitepapers, ebooks, videos, etc. | Focused on presentations and infographics only |
| Interactivity & Animation | Supports triggers, hover effects, click-to-reveal and timeline animations | Zoom transitions + basic object animations (fade, zoom) |
| AI Features | AI Designer, Writer, Resizer, Image Generator, Edit with AI & more | Create with AI + layout suggestions |
| Templates | 100,000+ templates across dozens of formats | Hundreds of templates across presentations and infographics |
| Brand Kit | Full kit with AI Brand Wizard, asset library, saved themes | Full brand kit for logos, fonts and color palettes |
| Asset Library | 1,000,000+ stock photos, videos, icons, GIFs, 3D assets, widgets | 500,000+ stock library for images, videos and GIFs |
| Collaboration | Real-time editing, pin comments, role assignment, shared folders | Real-time collaboration: edit, comment and present access |
| Data Visualization Tools | 40+ charts and graphs, dozens of data widgets with animation and filters | Wide variety of charts and graphs, widgets like word clouds and gauges |
| Sharing & Exporting | Live links, embed code, PDF/HTML5 export, SCORM/xAPI support | Shareable links, PDF/MP4/GIF export, live presentation links |
| Customer Support | Live chat, email, feature requests, tutorial hub, sales contact | Help Center, tutorials, community forum, ticket support |
| Analytics | Slide-level tracking, viewer data, completion rates, form captures, etc. | Viewer tracking, engagement data, etc. |
| Pricing | Free; paid starts at $12.25/mo | Free; paid starts at $3/mo |
| G2 Ratings | 4.5/5 (445 reviews) | 4.2/5 (5157 reviews) |
Now, let's discuss each of these in detail:
A tool can have all the features in the world, but if it’s hard to use, it’s not going to get used.
Here’s how Visme and Prezi compare when it comes to using the platform:
| Visme | Prezi | |
| Learning Curve | Easy to moderate, beginner-friendly | Moderate to steep, takes time to master zoomable canvas |
| UI Navigation | Clean and intuitive | Unconventional and layered |
| Mobile + Web Access | Yes | Yes |
| Editor Layout | Assets/tools on the left, slides on the right | Assets/tools on top, frames/slides on the left |
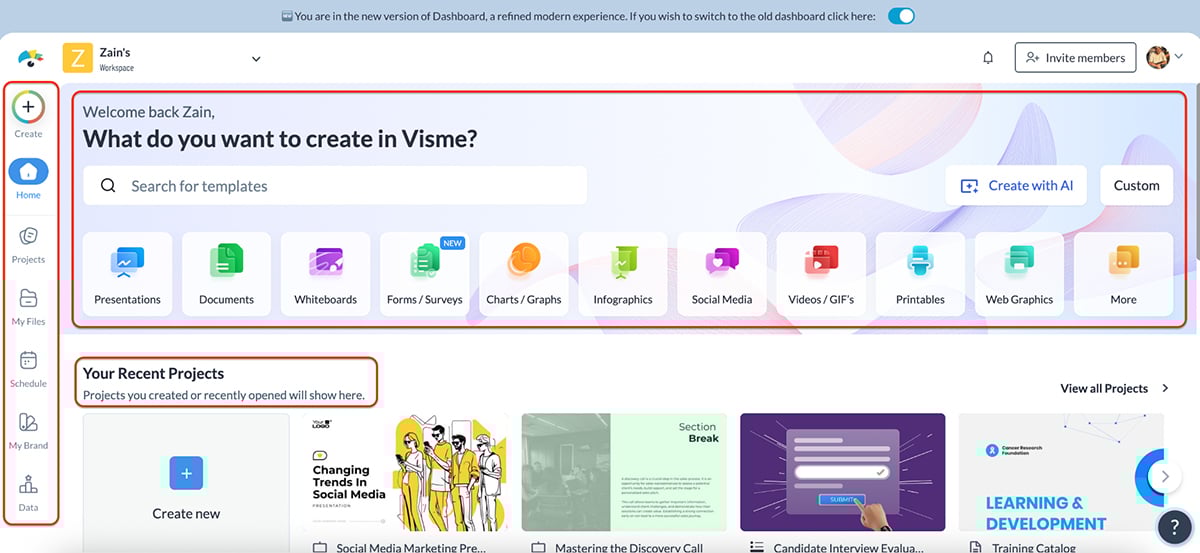
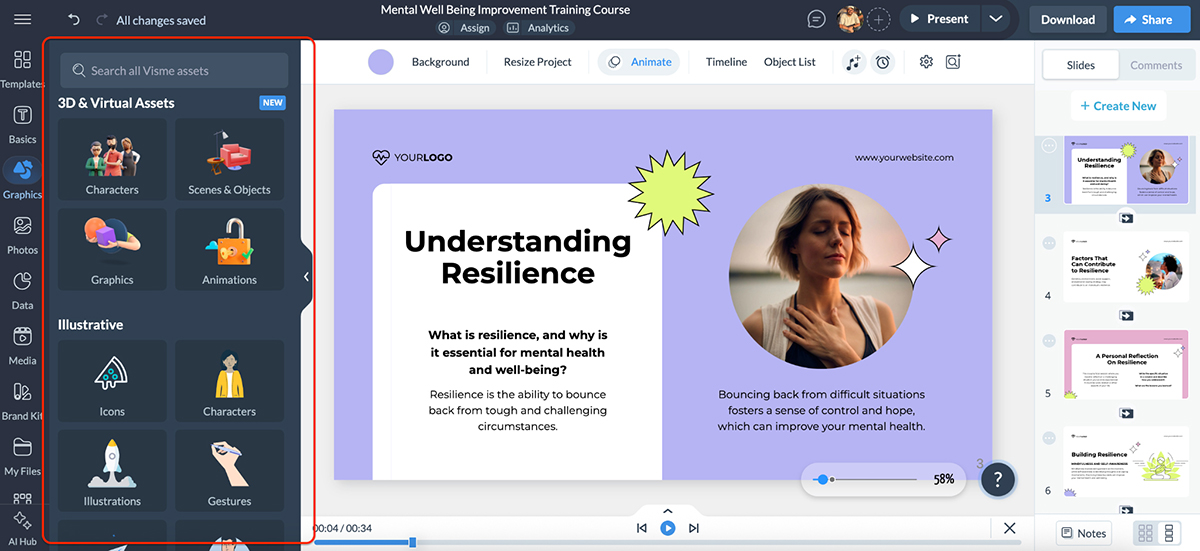
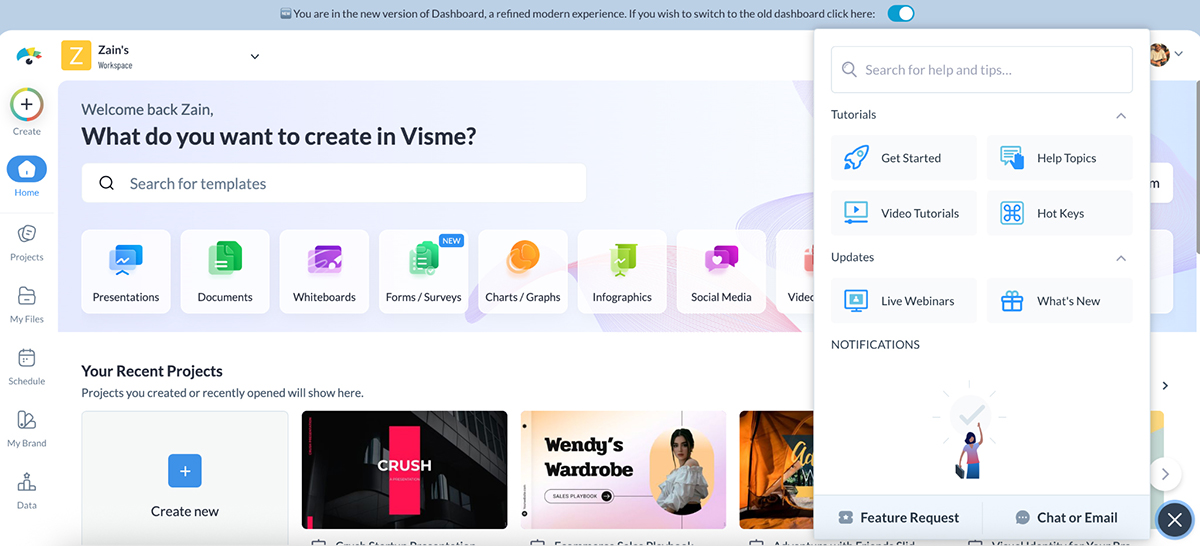
Visme’s interface feels familiar right away, even if you’re not a designer.
You get a clean dashboard with a main templates section so you can quickly start a new project and a Your Recent Projects section to easily pick up where you left off.
On the left, you’ll find everything else you need: Schedule, My Brand, Data and more, all organized and easy to reach.
In short, the layout feels close to what you’ve probably used in tools like Canva or Piktochart.
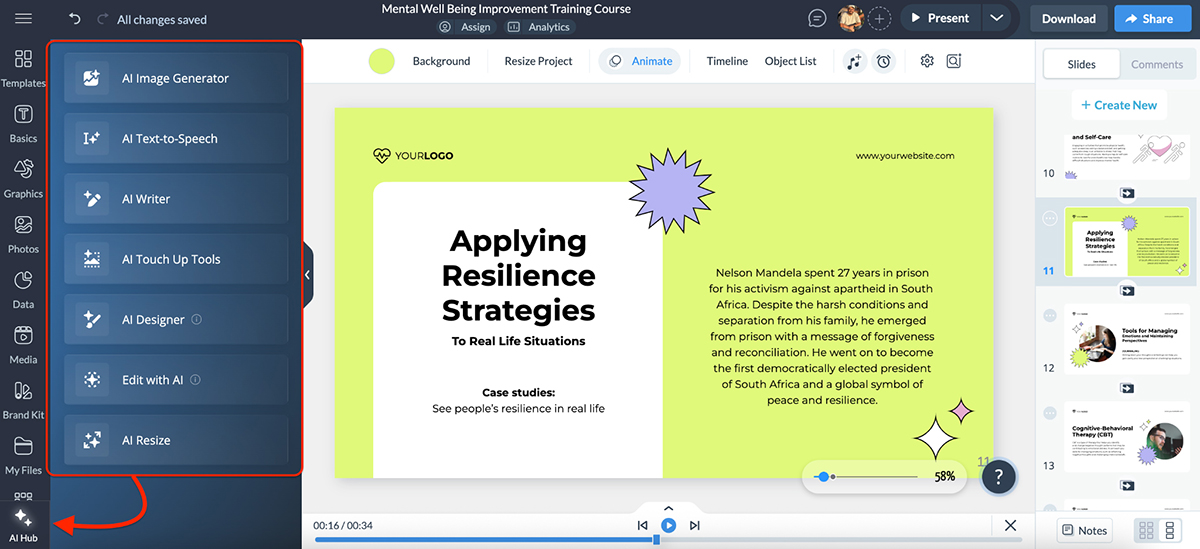
Inside the editor, things get even better. Everything is right where you expect it: text, shapes, charts, widgets, graphics and more, lined up neatly in a single left-hand panel. There’s also a dedicated AI Hub that keeps all of Visme’s AI features in one place.
And if you ever get stuck, just click the floating question mark icon for quick tutorials, tips and walkthroughs. It’s super handy.
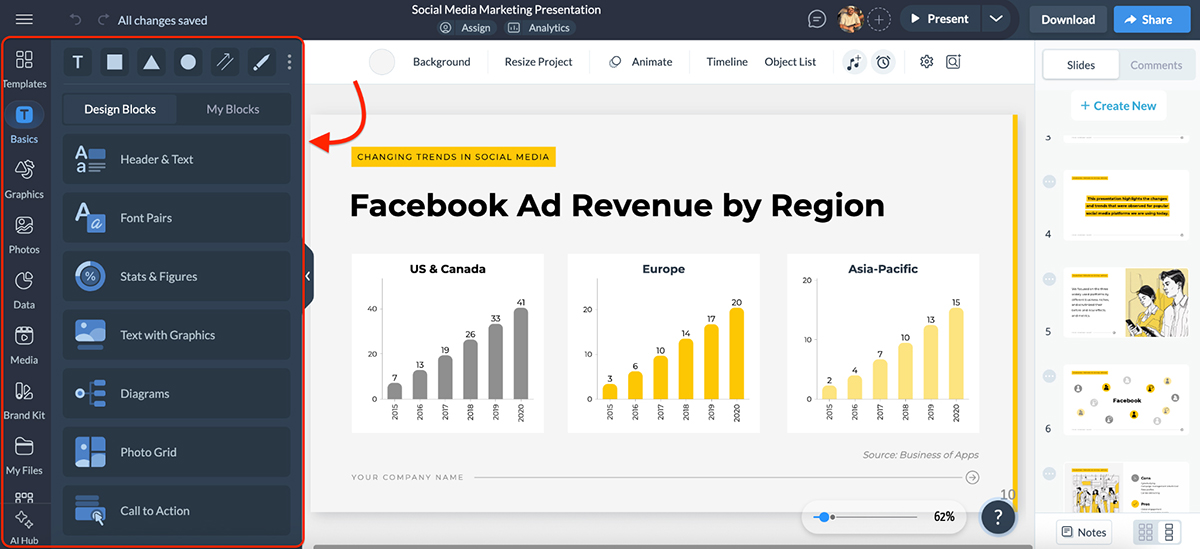
You don’t need to be “tech-savvy” to use Visme. It’s beginner-friendly without being limiting, and it gives you plenty of room to grow as your projects get more advanced.
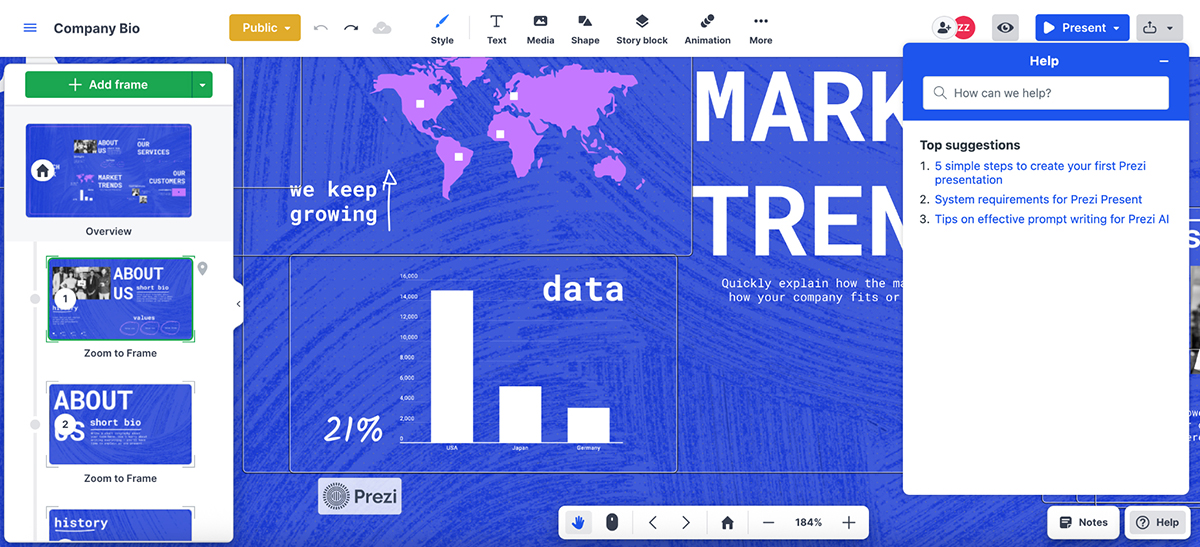
What makes Prezi different? Its UI and style of presentation is unique among content-creation tools.. That can be both good and bad.
Let’s start with the dashboard. It’s modern and clean.
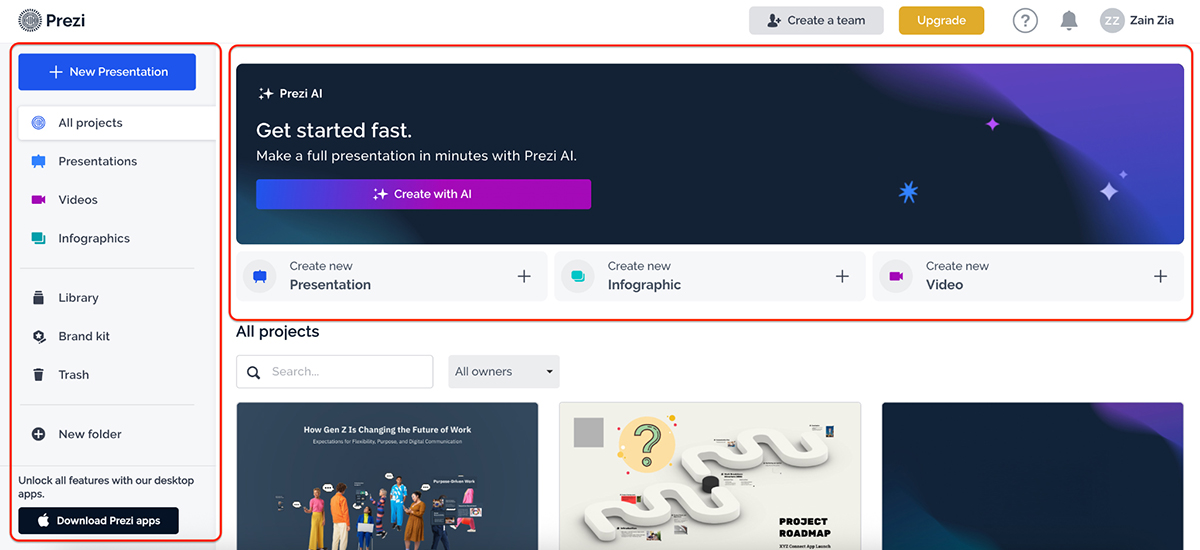
You can jump right into creating a presentation, infographic or video. There’s also a prominent CTA to “Create with AI,” which is handy if you want to get started quickly. Navigation is simple too. You’ve got dedicated sections for Projects, Library, Brand Kit and even a folder system to stay organized.
But once you step inside the editor, things get a tad bit complex.
Prezi doesn’t use traditional slides. Instead, it’s built around a zoomable canvas, where you create “frames” that zoom in and out of each other. It’s a cool concept and visually impressive, but if you’re not used to this format, there’s definitely a learning curve.
Unlike Visme, the asset library sits at the top of the screen (Visme places it on the left), and the slide/frame list appears on the left instead of the right.
These small layout choices might not seem like a big deal, but they do affect your workflow, especially if you’re switching between tools.
Overall, I think it comes down to personal preference. Visme’s interface feels more intuitive to me. But to Prezi’s credit: its zoom-style animation system is still one of the most unique ways to build a presentation that doesn’t feel like a deck at all.
A great visual tool isn’t just for one use case. It should grow with your needs, whether you're making a presentation, an infographic, a social post, or a full-blown report. Here’s how Visme and Prezi compare:
| Visme | Prezi | |
| Content Types Supported | Presentations, infographics, videos, social graphics, documents, forms, surveys, charts and more | Presentations, videos, infographics |
| PowerPoint Import | Available | Available |
| Interactive Forms & Surveys | Built-in | Not available |
One of the biggest reasons I switched to Visme was how multi-purpose it is.
I can use it to create a deck for a client on Monday, build a report on Tuesday, design a social post on Wednesday, whip up a short video or lead capture form on Thursday and close out the week on Friday with a brilliant infographic. All without ever needing to leave the platform.
You can start from scratch, use a template or get a jumpstart using Visme’s AI tools. And if you’ve already got a PowerPoint or PDF, you can simply import your file and keep editing right inside Visme.
Need your presentation slides turned into downloadable handouts? Easy. Want your infographic transformed into an animated video? Also doable.
Whether you’re a marketer, educator or business owner, Visme is the kind of tool that fits whatever you’re working on. And because everything’s built in, charts, 3D animations, forms, advanced collaboration and brand tools, it never feels like you’re “hacking” a presentation tool to make it work for something else.
You’re not boxed into one format. And you’re never forced to switch platforms just to get a job done.
Prezi is definitely more niche in how it handles content.
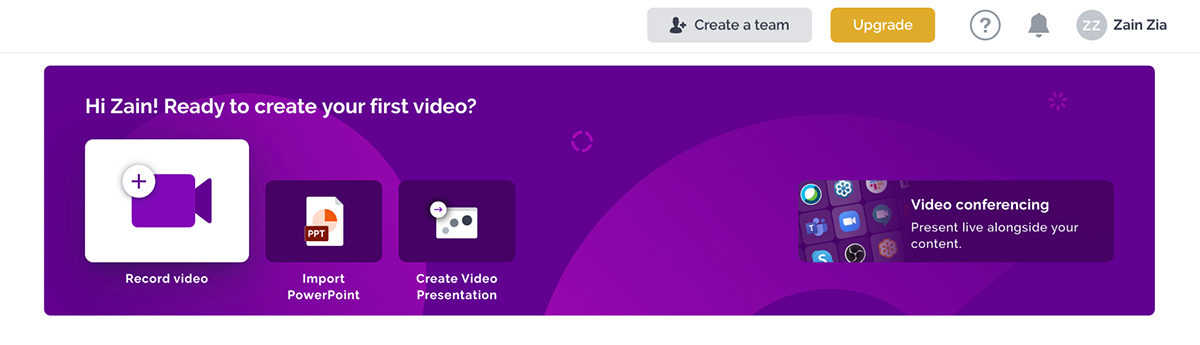
It lets you create presentations, whether you’re starting from scratch, using a template or generating one with AI. You can also create videos, including the ability to record yourself, import PowerPoint files and turn them into dynamic video presentations.
It even supports infographics, with templates across categories like timelines, comparisons and statistical layouts (we’ll dive deeper into this in the Templates and Data Visualization sections).
Even though these core content types are solid, the platform doesn’t feel as all-in-one as Visme.
For example, Prezi doesn’t offer interactive forms or surveys the way Visme does. There’s no option to create content that doubles as a lead gen tool, like embedded quizzes, gated resources or responsive documents. Everything feels more focused on presenting and being engaging, but not on converting.
So while Prezi covers the essentials well, it’s not as versatile for content creators who need to build across multiple formats and workflows.
Static slides don’t cut it anymore, whether you’re pitching, teaching or storytelling, motion and interaction make all the difference. See how Prezi and Visme stack up on interactivity:
| Visme | Prezi | |
| Animation System | Timeline-based with full element-level control | Basic fade/zoom effects, no timeline view |
| Interactivity Options | Buttons, click-to-reveal, hover effects, pop-ups, hotspots | Limited to zooming structure |
| Overall Experience | Highly interactive and customizable | Visually engaging but more rigid |
Visme gives you full control over how things move and interact on screen.
Inside the editor, you get a timeline view where you can apply entrance, exit and emphasis animations to any object (text, icons, images, shapes, etc.)
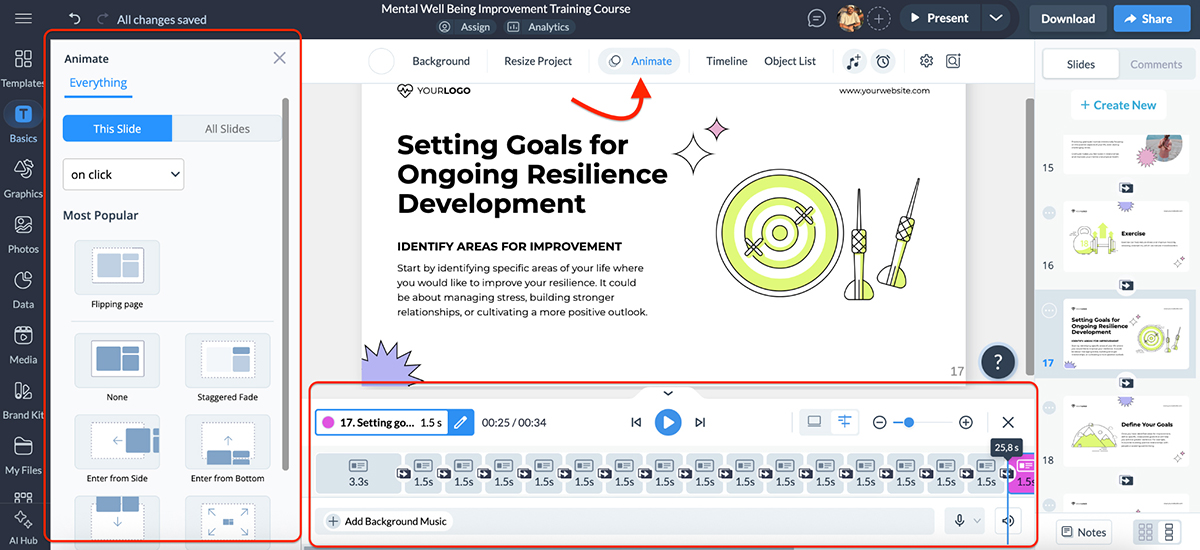
You can fine-tune delays, durations and even sequence actions, which makes it super flexible for storytelling or keeping attention during a pitch.
What really stands out, though, are the interactive features. You can add click-to-reveal content, hover effects, hotspots and interactive buttons that link to different slides, pages or external URLs.
These features can help you create truly interactive presentations; something closer to a microsite or product demo.
Plus, if you want to add visual flair, there’s a huge library of animated icons, shapes and characters to bring your designs to life without needing custom motion graphics.
If you want your presentation to do something, not just play, it’s all built right in.
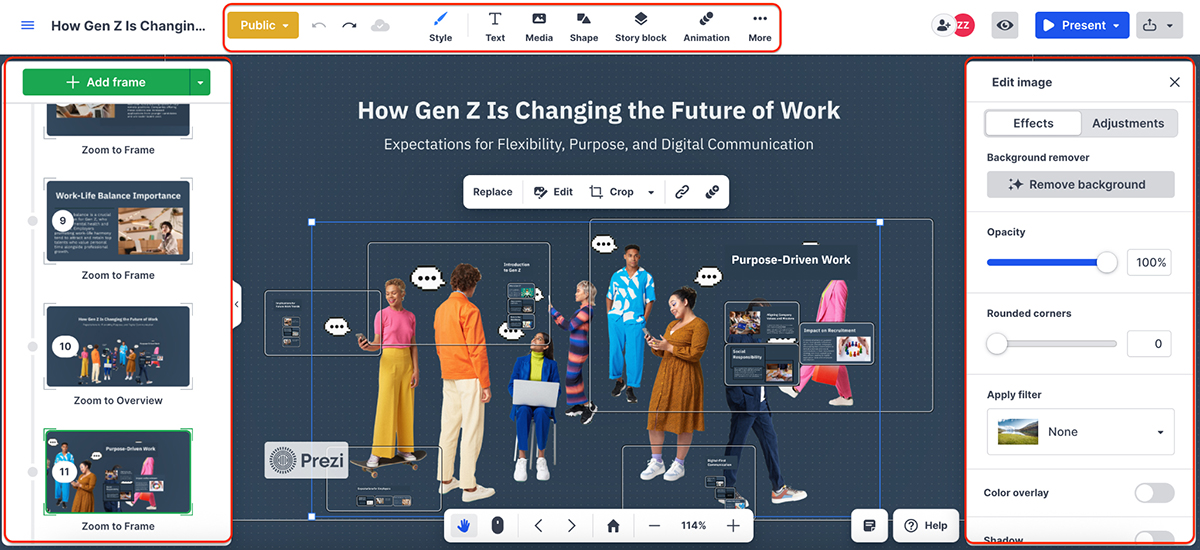
Prezi’s signature movement is the zoom.
Instead of animating elements on a slide, you animate between frames: zooming in, zooming out and panning across a canvas. It’s a cinematic experience, and when done well, it absolutely makes an impression.
And beyond frame-to-frame transitions, Prezi lets you animate individual objects with simple effects like fade in, fade out, zoom to and zoom out. It’s basic, but it does give you some control over how elements appear during your presentation.
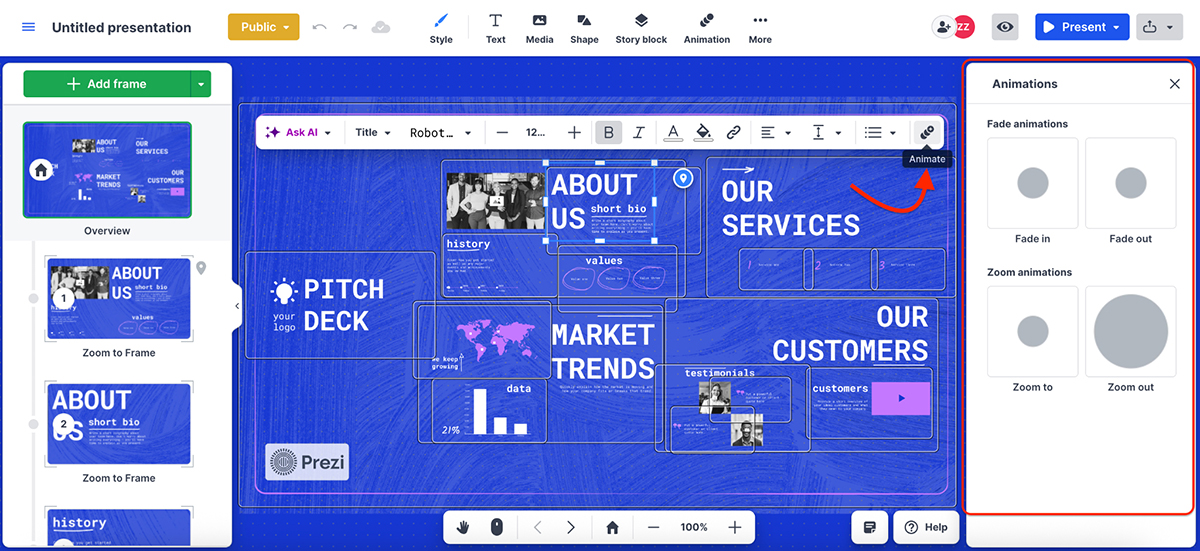
That said, the animation system isn’t timeline-based. You won’t get features like click-to-reveal, hover effects or layered interactions. There’s also no option to add hotspots or build interactive navigation paths like you can in Visme.
So while Prezi’s movement style is unique and visually engaging, it’s more rigid compared to Visme when it comes to custom animation control and interactive storytelling.
With every design tool under the sun adding AI to their workflow, it only makes sense to look at how Visme and Prezi are using it, and whether it actually helps you create faster.
Here’s a quick overview of how Visme vs Prezi compare when it comes to AI features:
| Visme | Prezi | |
| AI Presentation Generator | Yes—full slide decks with text, visuals, icons, animations | Yes—structured zoom-style presentations with section titles |
| AI Writer | Yes—generate, rewrite, summarize, brainstorm text in-editor | Not available |
| AI Image Generation | Yes—built-in tool to generate custom visuals | Not available |
| Text-to-Speech | Yes—converts text to voiceover | Not available |
| Other AI Tools | AI resize, AI touch-up tools, AI brand wizard | Ask AI (flow chart, visual list, animated story, zoom layout) |
Visme is stacked when it comes to AI features. And they’re not just there to tick boxes; they’re actually useful when it comes to getting real work done.
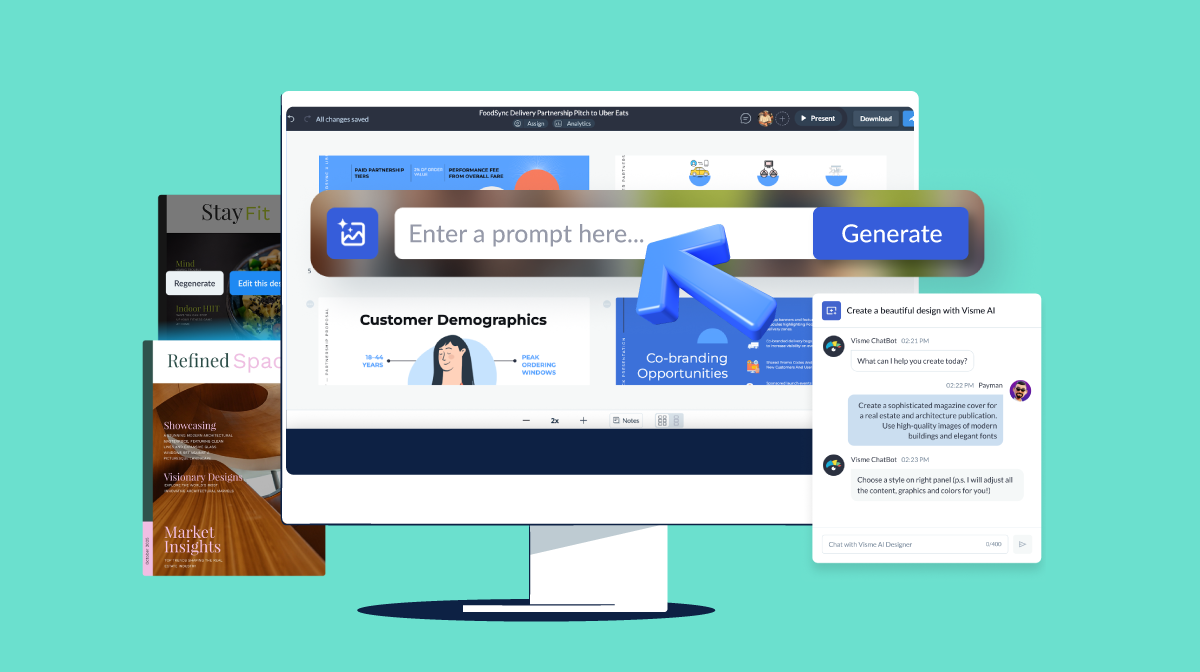
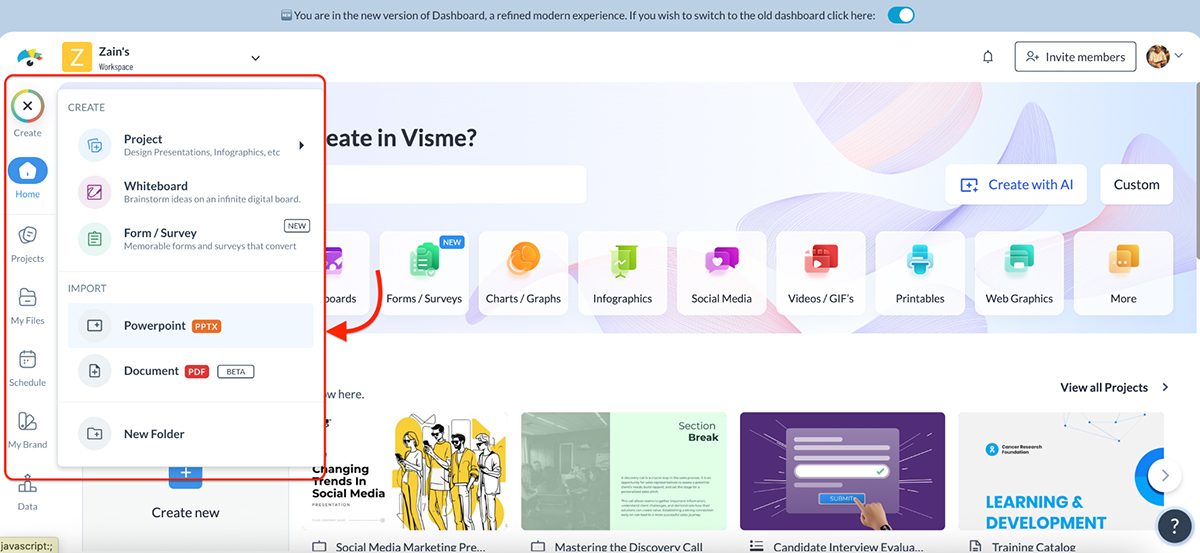
Let’s start with the “Create with AI” feature, accessible right from the dashboard.
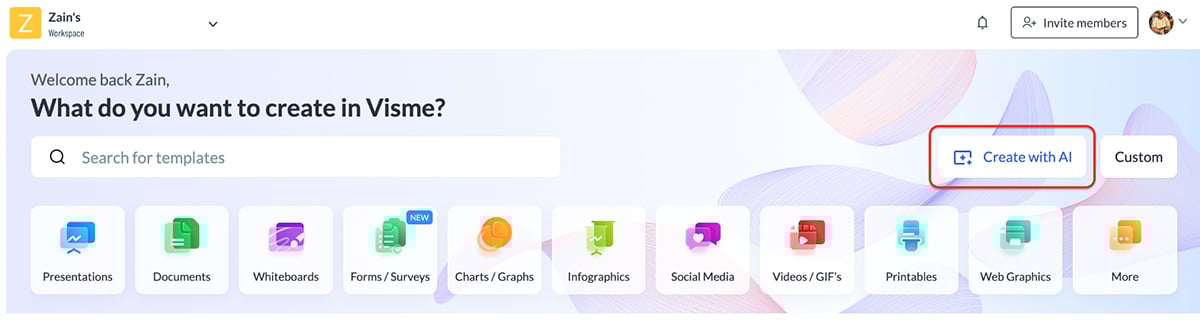
It takes you to Visme’s AI Designer, where you enter a prompt and it generates a completely unique project based on your input.
Let’s put it to the test.
Prompt:
“Create a presentation for a new plant-based food startup named GreenRoots.”
Result:
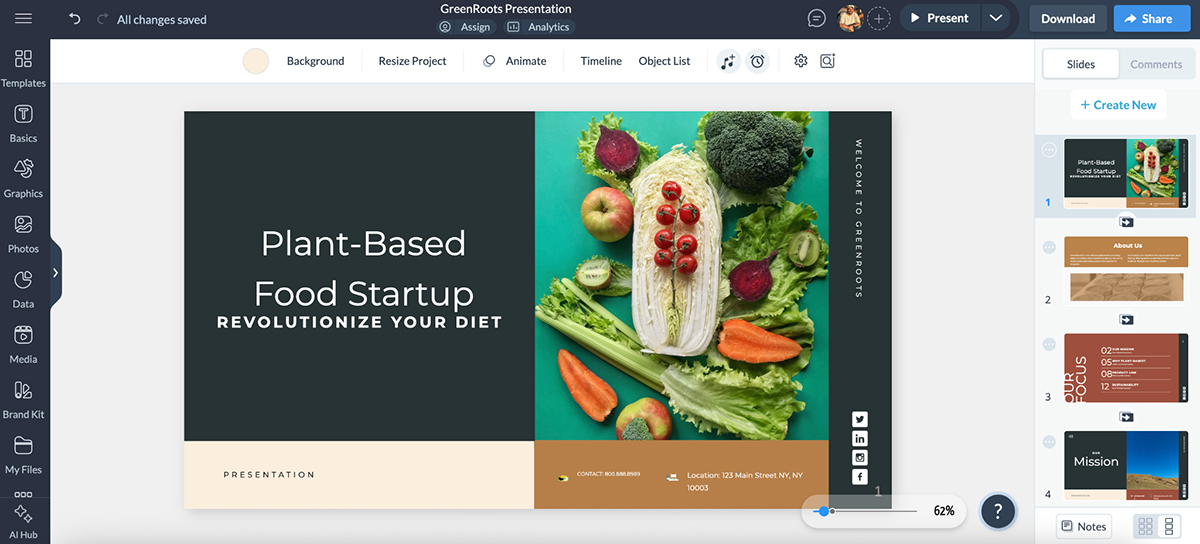
One word? Terrific. Considering it took Visme AI less than two minutes to build this, it’s kind of awesome. Sure, I noticed a few layout and spacing quirks, but honestly, they’re minor. I’d be editing the content anyway.
What stood out to me was that the AI-generated slides come packed with icons, animations, transitions, placeholder data widgets and suggested headlines that are actually usable. You’re not starting from a blank slate; you’re starting with something solid.
Plus, everything you see in the AI-generated project is completely customizable. So don’t worry about colors, fonts and icons not matching your aesthetic. Just swap out whatever you don’t like.
Next up: the AI Writer, which I’ve used before to whip up compelling first drafts. Could I use ChatGPT for this? Of course. But the fact that I don’t have to switch tabs or juggle between tools is liberating.
Other Visme AI tools include:
You’ll find all of this neatly bundled in the AI Hub, so you’re not clicking around trying to locate hidden features.
In short, I’m a fan. It’s saved me hours and made starting, finishing and editing projects a whole lot smoother.
While Prezi doesn’t offer as many AI features as Visme, it does include a few smart tools to help you get started and visualize ideas quickly.
To start off, it offers a Create with AI option right on the dashboard (same as Visme).
Naturally, I ran the same prompt here as I did in Visme to keep things fair.
Prompt:
“Create a presentation for a new plant-based food startup named GreenRoots.”
Result:
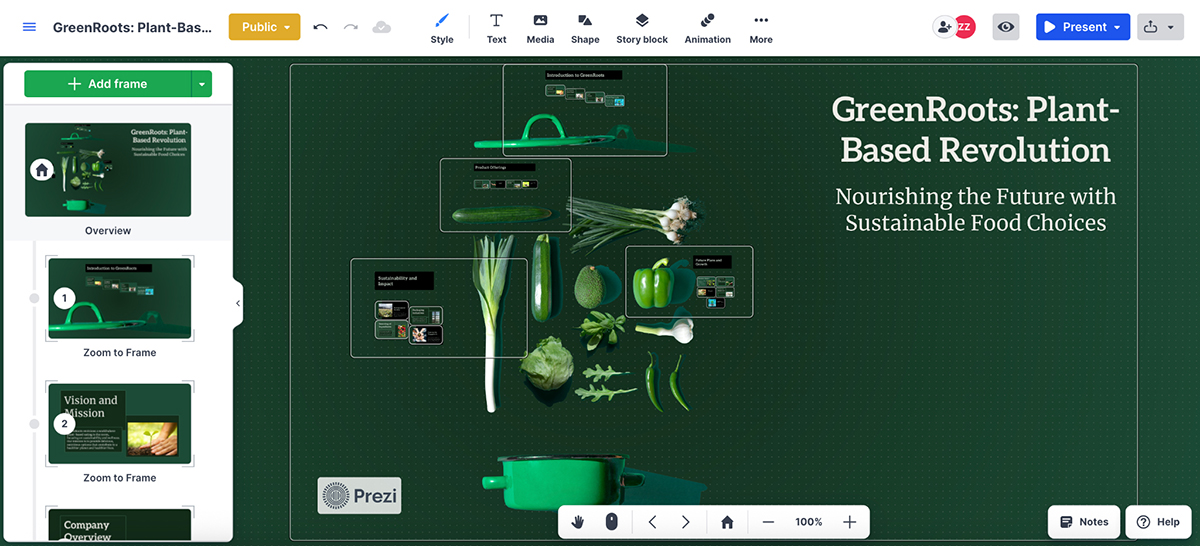
The design is exactly what you’d expect from Prezi. A zoomable canvas with sectioned-out topics flowing from one to the next.
And if you’re into that style, it’s great. The AI-generated section titles were pretty solid, and the visuals and layout matched the structure well.
But it does fall short in a few areas.
There weren’t many icons to help reinforce the content visually, and data visualizations were completely missing. The presentation felt more like a structured outline than a fully built-out deck.
That said, nothing here is unfixable. With a bit of editing and manual tweaking, you can absolutely take it across the finish line.
And while Prezi doesn’t offer AI writing, image generation or text-to-speech, there are some handy built-in AI tools inside the editor. For example, the Ask AI button lets you quickly turn a paragraph into:
These tools make it easier to convert raw text into something more visually structured.
So while Prezi’s AI toolkit is leaner than Visme’s, it still brings value when it comes to quick structuring and content visualization.
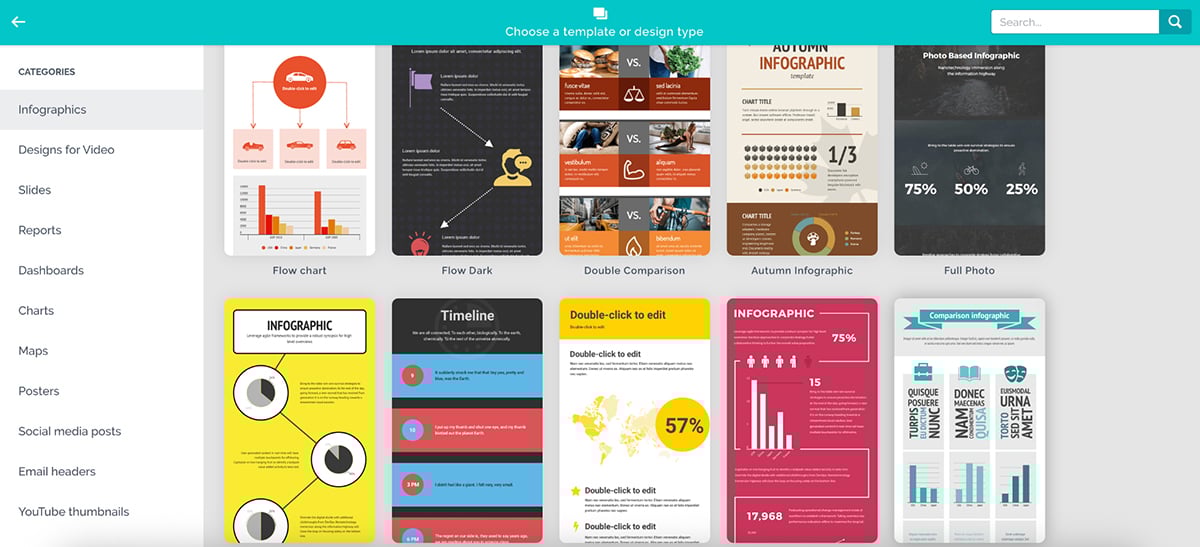
The right template can save hours and make sure your project doesn’t start with a blinking cursor. Here are the differences between Visme and Prezi’s template options:
| Visme | Prezi | |
| Template Variety | Thousands across presentations, infographics, reports, social posts, ebooks, whitepapers, charts, forms and surveys, videos, documents and more | Hundreds for presentations, infographics, reports, dashboards, maps, posters and social media |
| Customization Flexibility | Fully customizable | Fully customizable |
| AI Presentation Generator | Available | Available |
If you like having options, Visme delivers.
There are thousands of professionally designed templates, not just for presentations and infographics but also reports, proposals, social media posts, videos, documents, whitepapers, ebooks and even charts and forms.
Every template is fully customizable, and the designs range from sleek and modern to playful and minimal, depending on your style.
What I love most is that each template is actually usable out of the box.
You’re not just staring at dummy filler text or outdated layouts; you get a visual structure that already feels aligned with real-world business use.
That said, browsing through thousands of templates to find something that matches your aesthetic can feel a little overwhelming.
If that’s the case, you can just use the AI Presentation Maker. Type in your prompt, and let AI do the heavy lifting. After that, you can plug in your own content, apply your brand colors and swap in icons or images that fit your message.
In short, whether you’re presenting to stakeholders, sharing data with clients or building an internal newsletter, there’s a high chance Visme already has a template for it. And honestly, it’s probably better-looking than you expected.
Prezi also comes with hundreds of pre-built templates that you can use to kickstart your project.
You’ll find templates for presentations, infographics, reports, social media posts, dashboards, maps, posters and more.
The templates are clean and visually engaging, and I’ll give Prezi credit; they know how to make a canvas presentation look dynamic.
But my biggest complaint is that you don’t get the same level of diversity across project types. For example, if you want to design a report, whitepaper or eBook, Prezi’s format just isn’t built for that.
You wouldn’t typically use a zoomable canvas for long-form content, and that’s where Visme clearly has the upper hand.
That said, if your project fits within Prezi’s style, the templates absolutely work. But if you’re looking for more versatility or templates that go beyond storytelling decks, it starts to feel like you’re working within creative constraints.
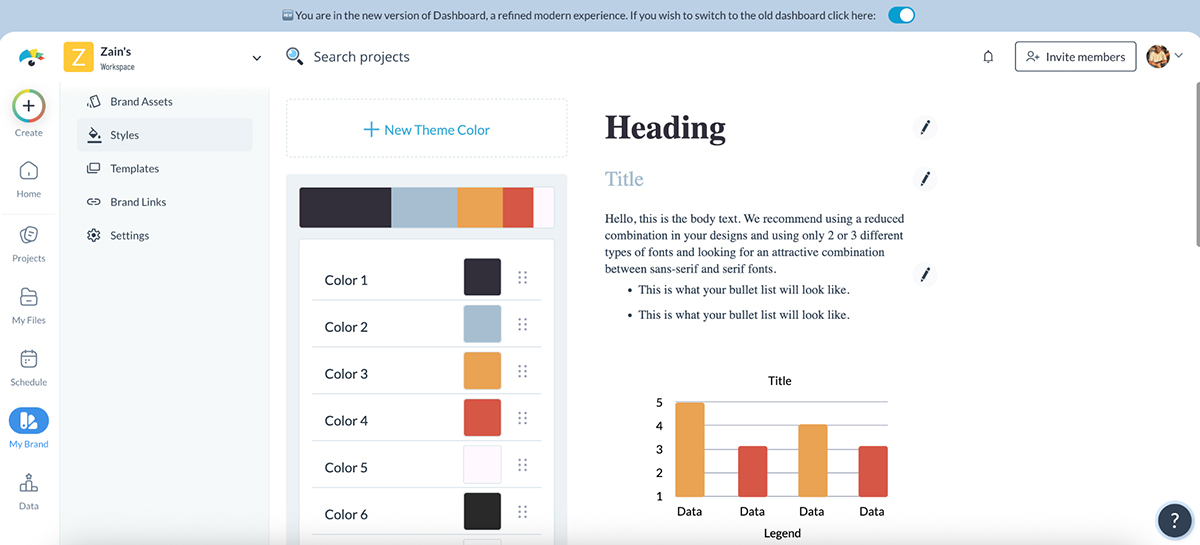
Keeping your designs on-brand shouldn’t feel like a full-time job, and a good brand kit makes that easier. Here’s how Visme vs. Prezi compare:
| Visme | Prezi | |
| Dedicated Brand Kit | Available | Available |
| Brand Colors | Set manually or auto-extract from website | Set manually or extract from logo |
| Font Management | Choose from built-in font list or upload custom fonts | Choose from built-in font list or upload custom fonts |
| Brand Wizard | Available—auto-extracts your branding assets from your website | Not available |
Visme comes with a dedicated Brand Kit feature where you can upload and store all your key branding assets such as logos, color palettes, custom fonts and more. It’s incredibly useful when you’re starting a new project and want to quickly apply your brand identity without starting from scratch.
Sure, you can manually upload each asset, but there's one Visme feature that’s seriously underrated: the Brand Wizard.
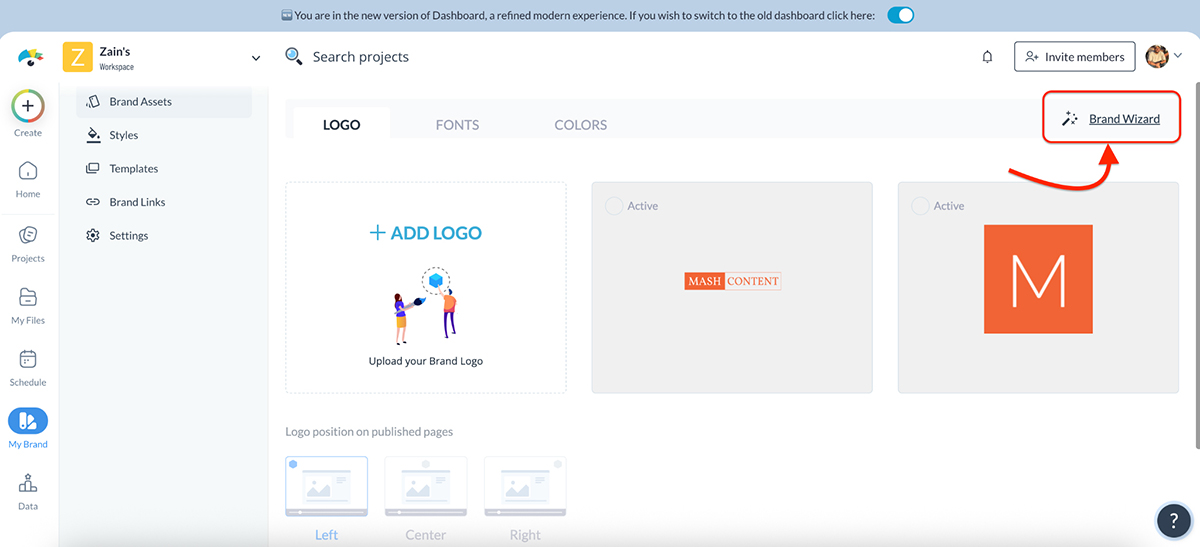
It’s one of my personal favorites. All you have to do is enter your website URL, and Visme’s Brand Wizard will automatically pull in your brand colors, logo and style settings from your site and store them in your Brand Kit within seconds. No dragging, uploading or guessing hex codes.
Beyond branding assets, Visme also lets you organize:
If you manage multiple brands or just want to stay consistent without the chaos, Visme’s Brand Kit is exactly what you need.
Prezi also offers a dedicated Brand Kit feature, but it’s only available on the Prezi teams plan, and you’ll need to be the admin to access it.
From your dashboard, you can head to the Brand Kit panel and start by uploading your logo, which Prezi uses as a watermark across your team’s projects and videos.
You can even make it clickable by linking it to your website, which is a nice touch for branded content.
You can then set your team’s fonts (either by picking from a list or uploading your own custom font files) and build your brand color palette (manually or automatically pulled from your logo).
There’s also an advanced setup option where you can define specific colors for your Prezi projects.
Once your kit is published, your entire team will be able to create branded templates with your logo, fonts and colors baked in, whether they’re starting a new presentation, recording a Prezi Video or building a visual design.
The setup is pretty straightforward, and you can go back at any time to edit, unpublish or delete the brand kit if your branding evolves.
Check out this short walkthrough video to learn how to set up your brand kit in Prezi:
The fewer tabs you have to open, the better. A solid asset library means you can build everything in one place without constantly hunting for visuals elsewhere. Here’s how Prezi vs Visme assets stacks up:
| Visme | Prezi | |
| Stock Photos & Videos | Millions via Unsplash, Pexels and more | 500,000+ via Unsplash, Pexels and more |
| GIFs | Yes | Yes |
| Best For | Designers and teams needing deep visual variety and advanced customization | Users with lighter visual needs or basic presentation workflows |
Visme’s asset library is packed.
You get full access to millions of royalty-free photos, videos and audio files that you’d need for a compelling multimedia presentation.
But it doesn’t stop there. You can also use the AI image generator to create completely unique images.
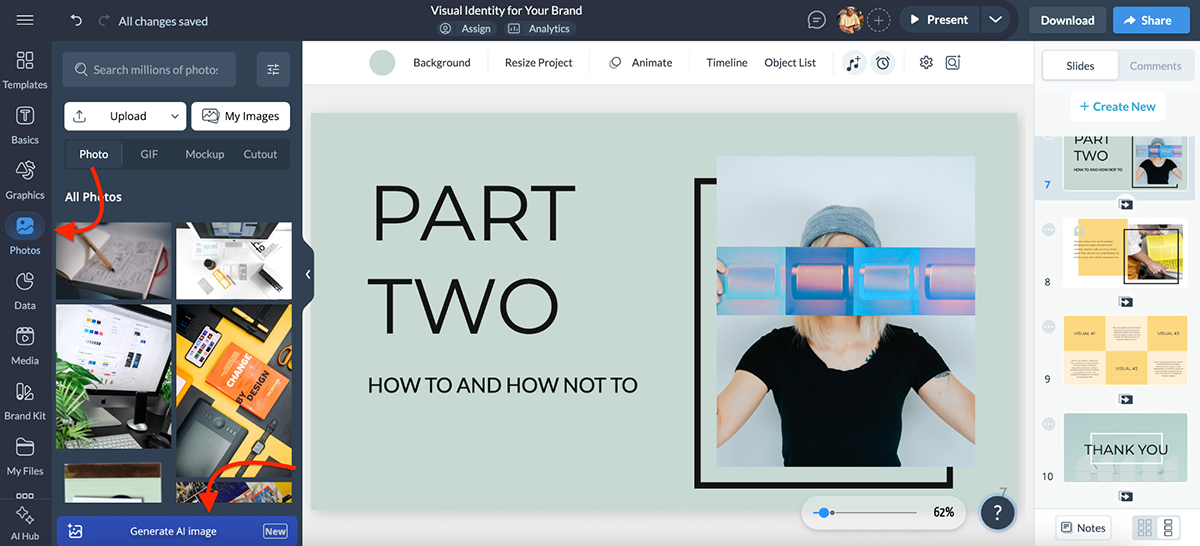
Visme also comes loaded with thousands of vector icons, shapes, illustrations and animated graphics, including characters, gestures and GIFs that you can drop directly into your designs.
There’s even a collection of 3D graphics, cutouts and data widgets for when you’re building charts, dashboards or product visuals.
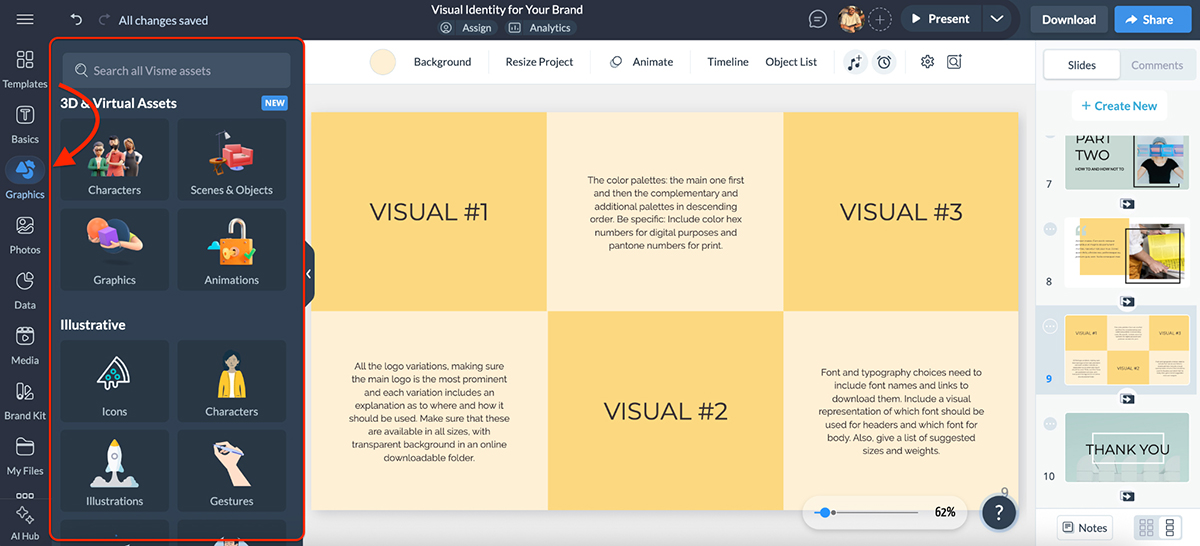
I also love the smart filters that let you sort assets by category, style or file type. And if you’re working with your own assets, you can upload files, create folders and organize everything neatly in one place.
In short, Visme gives you everything you need to design without hopping between tools or websites.
Prezi’s asset library is stacked too.
It comes with a built-in stock library of images, videos and GIFs you can add to your presentations or visuals. While some of this content is behind a paywall, there’s still a generous selection of free stock assets available to use right away.
The search is fast, and the visual quality is solid, especially for general business, education or abstract topics.
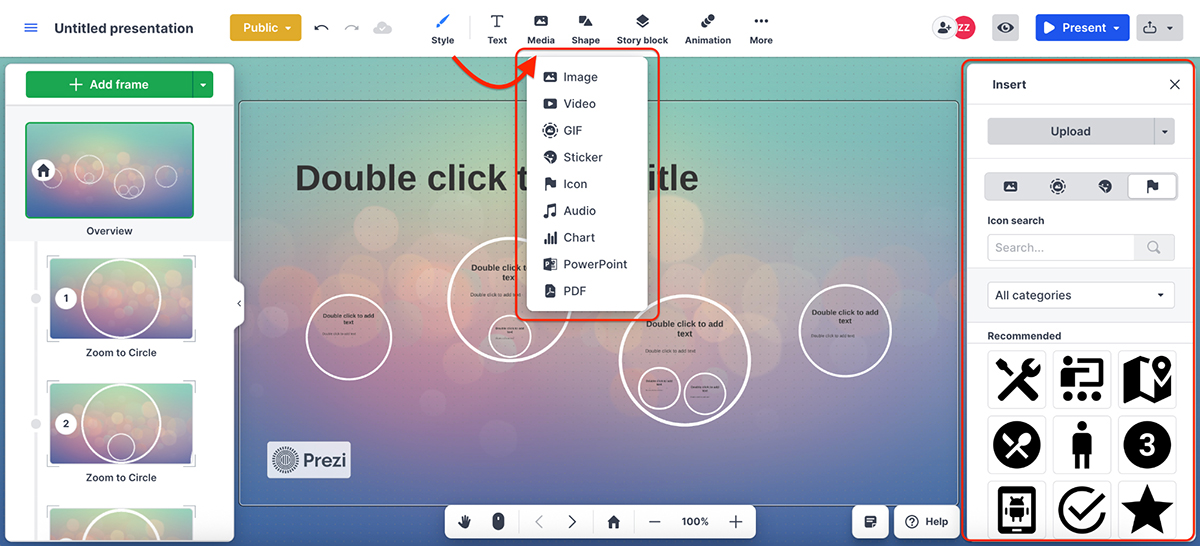
Beyond that, you can also upload your own files or insert assets like stickers, icons, charts, audio and even PDFs or PowerPoint decks.
That said, the asset variety is more limited compared to tools like Visme. You won’t find animated icons, 3D illustrations, character gestures or cutout-style assets. And while the library is good for basic visuals, it’s not really built for more advanced design or layered storytelling.
Still, if you’re working on a straightforward presentation and want quick access to visuals without leaving the platform, Prezi’s library gets the job done.
If you’re working with a team, how a tool handles feedback, sharing and real-time editing can make or break your workflow. Below you can see how Visme and Prezi handle collaboration:
| Visme | Prezi | |
| Real-Time Collaboration | Yes | Yes |
| Commenting & Feedback | Pin comments, draw shapes, highlight areas, color-coded annotations | Add comments on objects, @mention teammates |
| Version History | Full version history with restore options | Undo/redo only within active session, no persistent version history |
Visme makes collaboration smooth, especially if you’re working with a distributed team or multiple stakeholders.
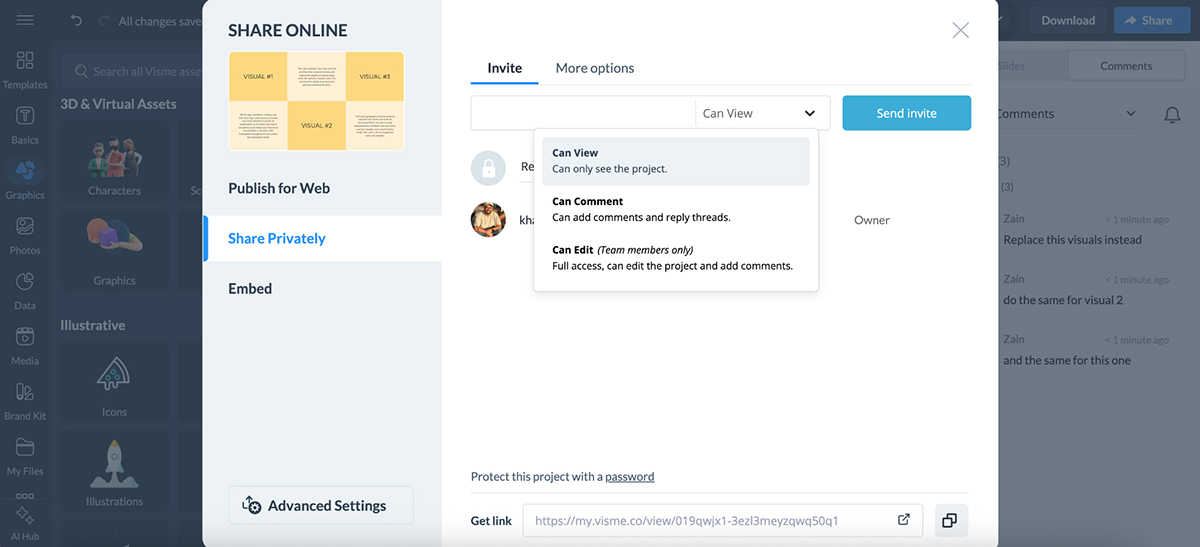
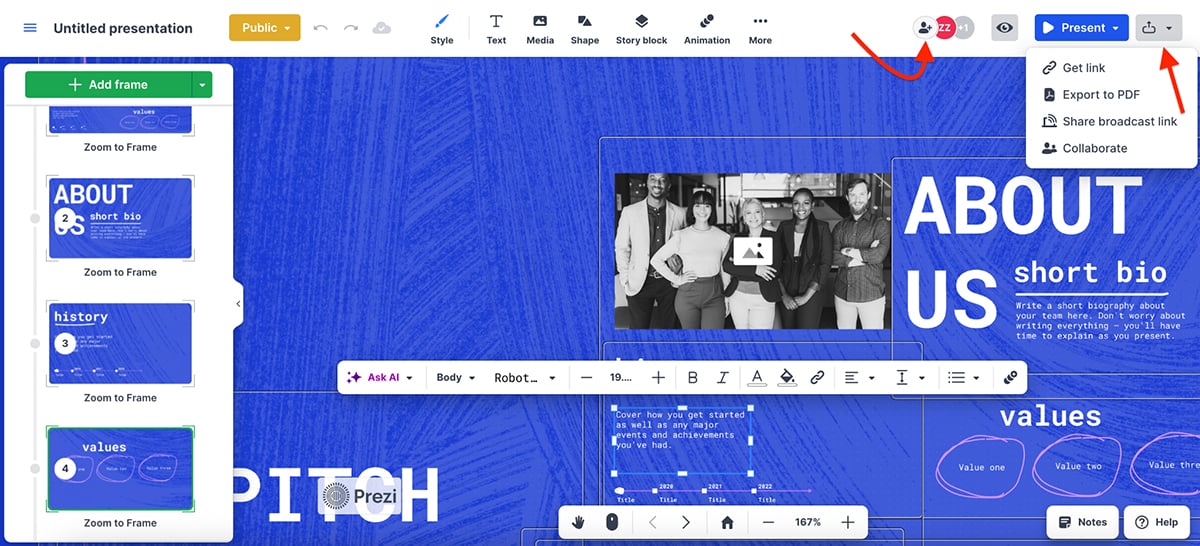
You can invite teammates to edit, view or comment, and everyone can work on the same project in real time. I’ve used this during team presentations, where one person handled content while another adjusted visuals. To do this, just click the + button at the top of the editor or click Share → Share Privately. Simple.
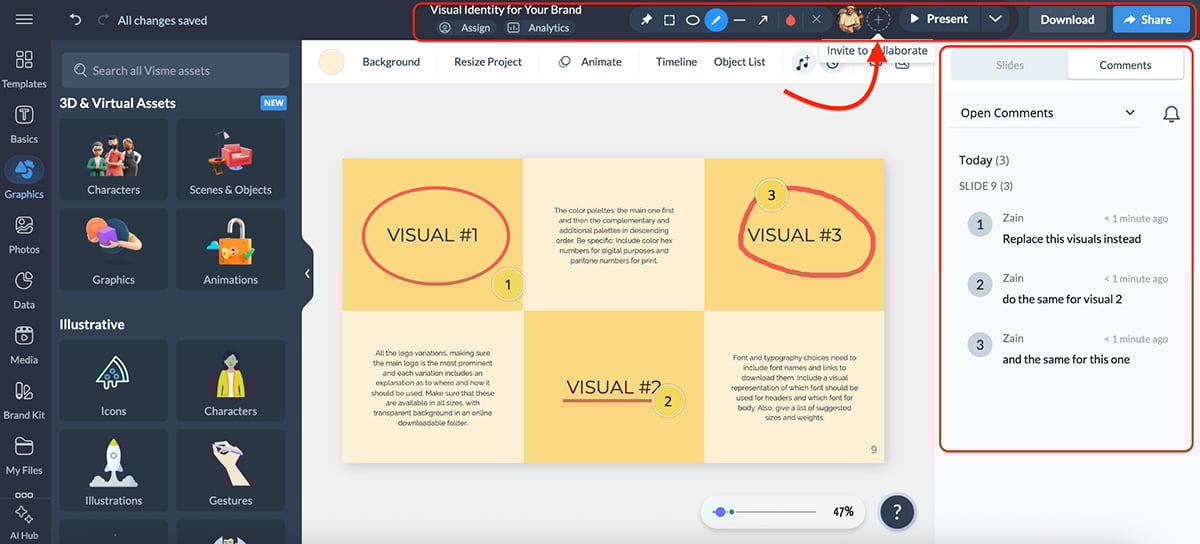
And when it comes to leaving feedback, Visme doesn’t just stop at sticky notes. You can pin comments to specific objects or areas and use tools to draw circles, rectangles, underlines, arrows or freehand shapes directly on your design.
You can even change annotation colors, which is helpful when multiple collaborators are leaving input on the same slide.
Visme’s collaboration and workflow features are great for both internal use (e.g., content teams, designers, marketers) and external reviews (e.g., clients, freelancers, agency partners). Everyone stays on the same page. Literally.
You also get:
For any team that needs structured feedback and seamless collaboration, Visme checks all the boxes.
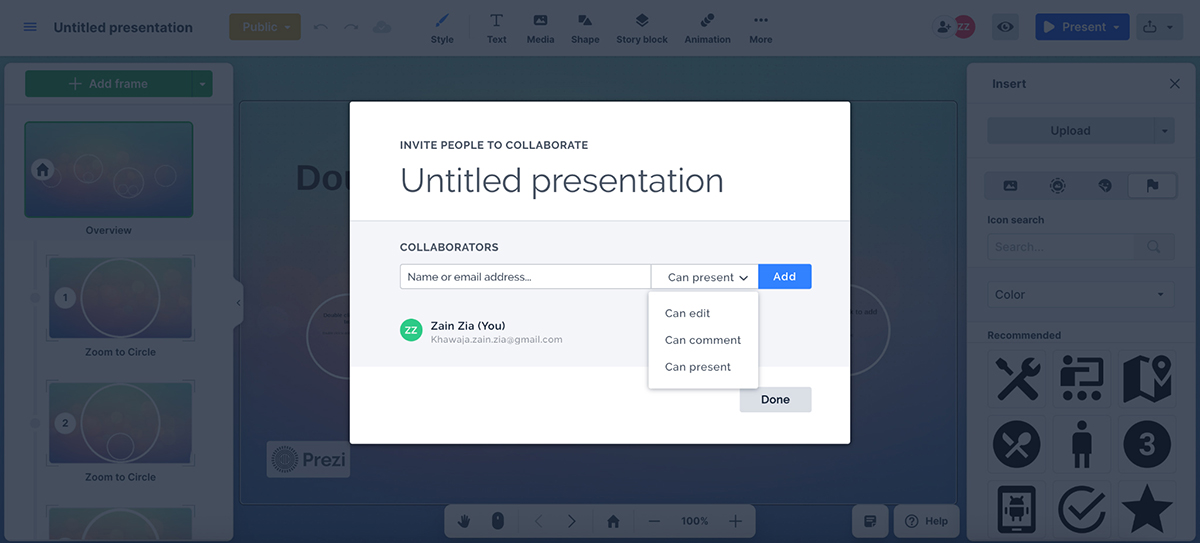
Prezi also supports collaboration, but it’s a bit more limited compared to Visme.
You can add collaborators and assign them roles to edit, comment or present, depending on how involved they need to be. Real-time co-editing is available but only if you’re on a Teams or Business plan.
To add collaborators, just click the + icon in your editor or press the drop-down menu on the right → Collaborate.
When it comes to feedback, Prezi lets you right-click to add comments on specific elements, and you can even @mention teammates to tag them directly. Comments show up in threads and generate email notifications, so conversations keep on moving without anyone having to switch platforms.
Unlike Visme, Prezi doesn't include full version history across sessions. You can use undo/redo (even multiple steps) within a session, but once you close your browser or exit the editor, that history disappears. That means if someone accidentally removes something and you’ve left the editor, there’s no rewind button; you’ll need to manually recreate or rely on backup copies.
All in all, Prezi works well for basic team collaboration and internal reviews. But if your workflow depends on detailed feedback loops, version control or client approvals, you might find yourself needing a few extra tools.
If your content involves stats, charts or dashboards, your tool’s data features can make or break how well your message lands. Here’s how Visme and Prezi can help you visualize your data:
| Visme | Prezi | |
| Chart Types | 40+ chart types: area, radar, pictograph, scatter, donut, Gantt, radar polygon, map, tree, funnel, bubble, etc. | 20+ chart types: bar, line, pie, scatter, Sankey, Gantt, hierarchy, etc. |
| Data Widgets | Yes | Yes |
| Data Import Options | Excel, CSV, Google Sheets | Drive, JSON, SQL, CSV |
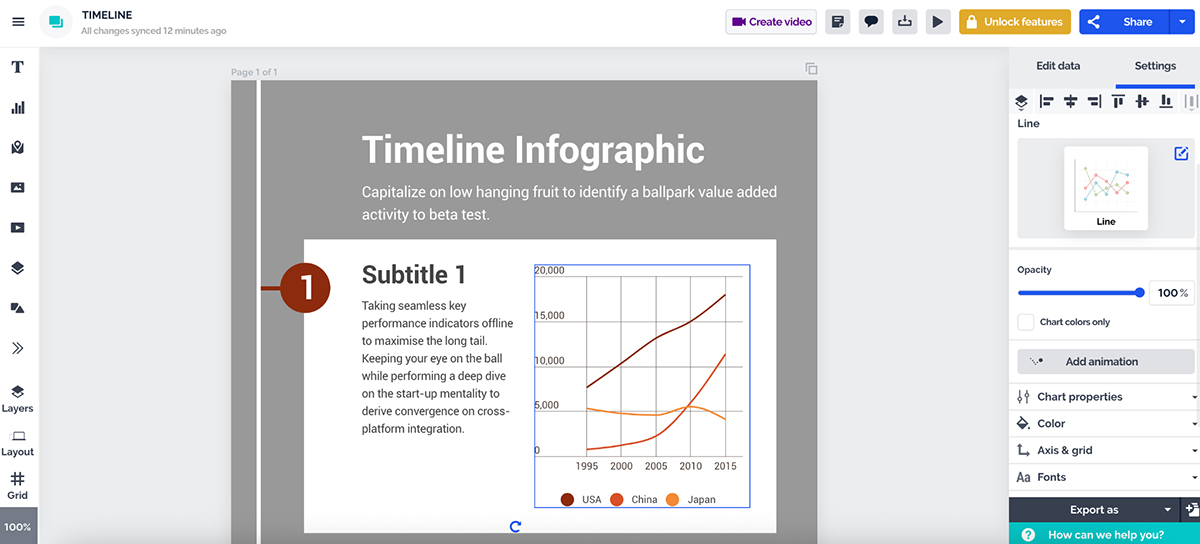
Visme makes it really easy to bring your data to life.
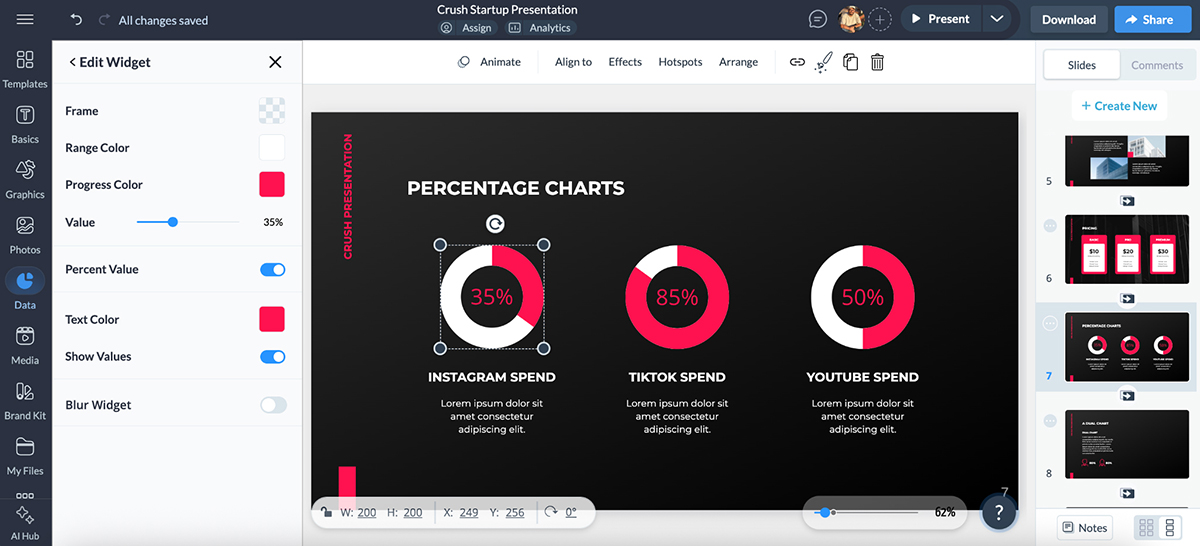
You’ve got access to dozens of chart types, from standard bar and line charts to radar, donut, stacked and even pictographs. But what really stands out is the set of infographic widgets like progress bars, counters, maps and gauge-style visuals.
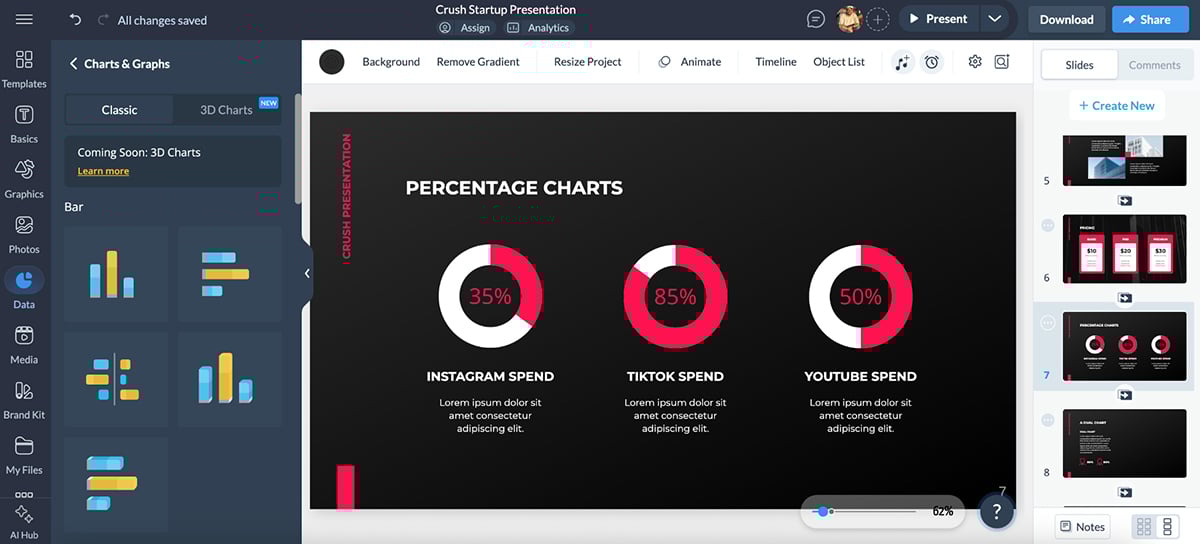
They’re made for storytelling with data, not just showing it.
I love that Visme lets you import data from Excel, CSV or Google Sheets, and even sync live data from Google Sheets, which is perfect for dashboards or reporting visuals that need to stay fresh.
And the best of all: everything is fully customizable, including colors, fonts, sizes and even animated reveals.
Visme also lets you layer interactivity into your charts. Think hover states, click-to-reveal data or pop-ups that show extra context. It’s great for when you want people to explore your data, not just glance at it. It just makes data more interesting and fun to interact with.
Whether you’re creating a quarterly sales report or a wrap-up of a marketing campaign, Visme’s data tools are the real deal.
Prezi actually has more data features than most people realize.
It offers a wide variety of charts and graph types, including area, scatter, Gantt and Sankey. You’ll also find a few data widgets like word clouds and gauges, which add some visual flair beyond the basics.
The charts look clean and are super easy to drop into your presentations or infographics. And the editor gives you full control over things like opacity, gridlines, axes, fonts and tooltips, all editable from the right-hand settings panel. You can even add pre-made animations to charts for a more dynamic feel.
Uploading your data is just as flexible. You can import from Google Drive, JSON or even SQL sources like MySQL, Redshift and PostgreSQL. If you prefer to start manually, you can do that too.
The one thing Prezi still lacks is interactive chart behavior. You won’t get things like hover states or click-to-reveal elements. But if you just need to visualize data cleanly and stylishly, Prezi does a solid job.
Whether you’re presenting live, embedding on a site or sending a PDF to a client, how your tool handles exports matters. Let’s look at how both these tools deal with sharing and exporting:
| Visme | Prezi | |
| Shareable Link | Yes—public, private or password-protected links | Yes—shareable and view-only links |
| PDF Export | Yes | Yes |
| SCORM/xAPI Export | Yes—for LMS integration | No—SCORM and xAPI not supported |
Visme gives you a lot of control when it comes to how you share or publish your content.
You can share your projects via live links, with adjustable permissions like view-only, comment or edit access. There are also password protection and domain-level privacy options, which come in handy when sharing with clients or external teams.
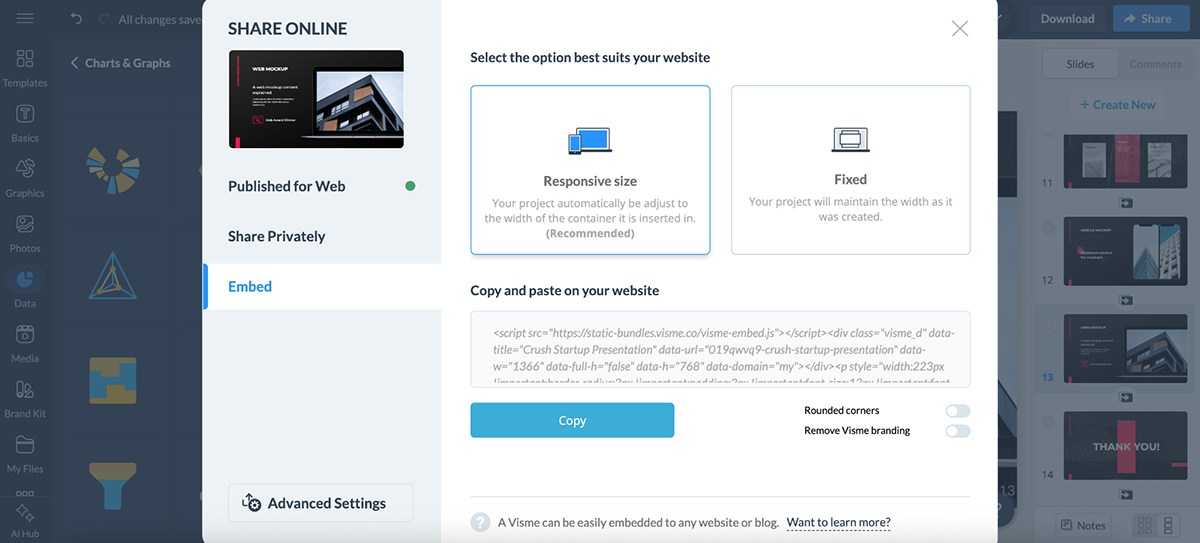
Need to embed your project on a website? Visme gives you a responsive embed code that works beautifully across devices. This is especially useful for reports, slide decks or infographics you want to showcase online.
For offline use, you can export your content in multiple formats:
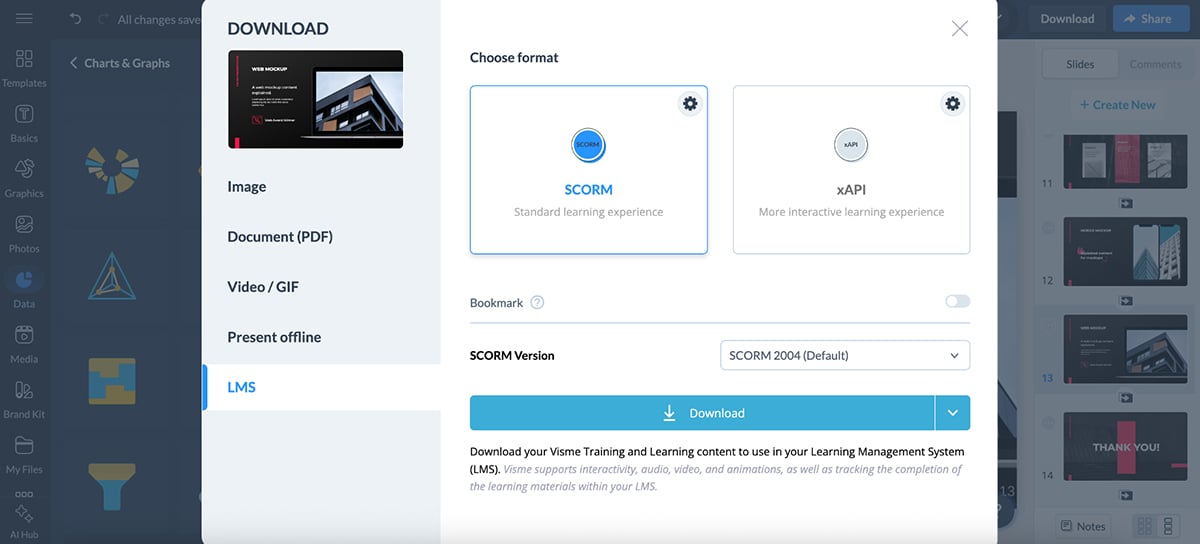
And if you’re using Visme for employee training or eLearning, you’ll love this: Visme supports SCORM and xAPI exports, making it easy to upload to your LMS and deliver branded, interactive learning content.
Whether you’re presenting, publishing, printing or uploading to a learning platform, Visme covers all bases.
Prezi also offers several sharing and exporting features to help you get your work out there.
Once your project is ready, you can generate a shareable link, broadcast your presentation live or export it as a PDF (where each frame becomes its own slide).
You can also embed specific frames on a website and export your design as an MP4 video or GIF, which is especially handy for social posts or asynchronous presentations.
You can also give stakeholders view-only access, and track who’s viewing and how they’re interacting with Prezi Analytics.
That said, Prezi doesn’t support HTML5 export, SCORM/xAPI packages or responsive embed codes, which means it’s not ideal for LMS deployment or interactive offline use. It works best for live presentations, static exports and simple viewer sharing.
If you get stuck, both Visme and Prezi offer built-in help. Here’s how their support options compare.
| Visme | Prezi | |
| Help Center / Tutorials | Yes—searchable, detailed, with blog & video guides | Yes—searchable articles, tips and on-demand training |
| Email/Ticket Support | Yes | Yes |
| In-App Support Access | Yes | Yes |
Visme offers built-in support right inside the platform, so you can quickly find help without breaking your flow.
Click the ? icon anywhere in your dashboard or editor and you’ll get access to:
If you’ve contacted support before, you can even track your previous chat records, which is quite helpful for following up.
You’ll also find a Contact Sales button at the bottom of your dashboard. Fill in your details (name, company, email, etc.), and someone from the sales team will reach out to help with onboarding or larger team plans.
In short, Visme offers layered support—self-serve if you want to explore, human help if you get stuck.
Help is accessible directly inside Prezi too, with a searchable support center, tutorials and product guides.
Click the "?" icon in the dashboard or editor, and you’ll instantly open the Help menu, which includes:
Inside the editor, clicking the Help button also pulls up top support suggestions based on what you’re doing.
While there’s no visible chat history or built-in feature request form, Prezi does let you search for help in real time and quickly directs you to the most relevant resources.
If you still need assistance, you can always head to the support page to submit a ticket or explore more detailed documentation.
Let’s talk about analytics. Here are the ways you can analyse your projects between Visme and Prezi:
| Visme | Prezi | |
| Views & Visitors | Yes—see total views, unique viewers, average watch time, time spent | Yes—see views, average watch time |
| Lead Capture | Yes—add registration forms to collect names, emails, company info | No built-in lead capture |
| Export Data | Yes—export to CSV | Yes—export to CSV |
Visme’s analytics are impressively deep. You can track metrics across published projects, including views, unique visitors, average time per project, completion percentage and even breakdowns by slide.
It also logs viewer details like time and date, IP and country. It’s great to see exactly where your audience is tuning in from.
Also, if you add a registration form, you can gather user names, emails and company info and tie that data back to how they interacted with your content.
To access your Visme analytics dashboard, find and click on Data once inside your Visme dashboard.
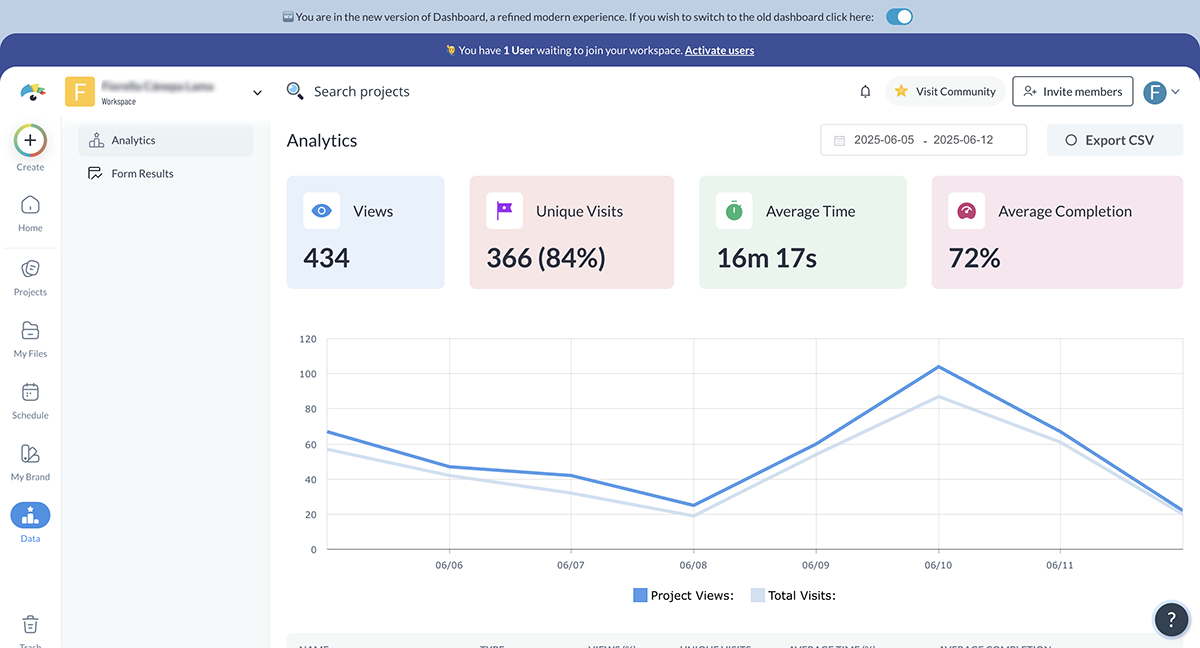
You can even export data as CSV, making a dashboard or individual project insights easy to integrate into your reports.
Visme gives you granular, audience-level insight; perfect for marketers, educators or anyone measuring content impact.
Prezi offers a built-in analytics dashboard that tracks views, total view time, average time per view and viewer location data.
You can also see whether someone is actively watching your presentation (“on air”) and monitor interaction rates such as hovers and clicks on visual elements.
Check out this video to learn how Prezi presentation analytics work:
Time-spent data is available for each frame, giving you insight into how long viewers stay on different parts of your content. You can also filter analytics by time range, export reports as CSV files and use tracking links to monitor who accessed your content.
That said, Prezi doesn’t offer granular audience-level breakdowns (like viewer-specific slide paths or form data capture), and there’s no visual heatmap feature. But if you’re looking for general engagement metrics, especially for sales decks or marketing presentations, it gets the job done.
Visme and Prezi both offer tiered pricing for individuals and teams, along with strong G2 ratings that reflect positive user experiences.
Here’s how they compare:
| Visme | Prezi | |
| Free Plan | Available | Available |
| Paid Plans (start at) | $12.25/mo | $3/mo |
| G2 Rating | 4.5/5 (445 reviews) | 4.2/5 (5157 reviews) |
Visme offers flexible pricing plans to fit solo creators, growing teams and large enterprises.
Here’s a quick overview of the current plans:
Visme’s cost-effective solutions have made a real-world impact for many users, saving time, budget and design hours.
For example, WOW!, a training and development team, reported saving nearly 79% in time and cost by using Visme’s intuitive graphic design tools.
Whereas Vanessa from Vorys says:
“If employees in the three departments were billed at $30 an hour by a designer, we would have saved 22 hours of work in July alone by using Visme instead of starting from scratch. Over a year, that translates to more than $8,000 in savings, thanks to the time saved when we compare starting from a blank sheet of white paper versus starting from Visme.”
On G2, Visme currently holds a 4.5 out of 5 rating, based on 445 reviews. Users often highlight its ease of use, project versatility and strong balance of design freedom with guidance.
Prezi offers multiple plans depending on whether you’re an individual, business, student or educator.
Here’s a quick snapshot of the current pricing:
Prezi also offers plans for students and educators that start at $4/month.
A 7-day free trial is also available for new users exploring premium features.
On G2, Prezi scores a 4.2 out of 5, based on 5157 reviews. Users love the zoomable canvas and visual storytelling style, especially for pitches and educational content. However, some note a learning curve and limited versatility outside of presentations.
The main drawback of Prezi is its zoom-based format that can feel restrictive, especially for long-form content or complex designs. This makes it less versatile than all-in-one platforms like Visme.
Saying that Prezi has failed is probably a bit of stretch. It hasn’t failed. But, yes, the platform’s user base may have shrunk due to its limited flexibility and evolving design needs that favor more dynamic, multi-purpose tools.
Yes, Prezi is still one of the most widely used presentation apps, especially by educators and professionals who prefer its cinematic, non-linear presentation style.
Tools like Prezi often lack features like interactive elements, form collection and full brand customization that are essential for marketing teams and business use. Plus, the zoomable canvas format can feel limiting for reports, documents or multi-format projects.
Prezi offers a zoomable canvas and dynamic transitions that can be more visually engaging than traditional slide-based formats like PowerPoint.
Yes. Visme is worth the investment, especially for teams or individuals who create content regularly. At $12.25/month, it’s an all-in-one platform for presentations, infographics, documents, videos and more, eliminating the need for multiple tools or extra subscriptions.
Canva is great for casual creators or solo users who want quick, stylish designs with minimal setup. Visme, on the other hand, is built for individuals, teams and enterprises that need more control, interactivity and content versatility.
Read more on what makes Visme the best Canva alternative here.
Yes, Visme offers a free plan with limited features. However, to unlock full functionality like brand kits, AI features, downloads and analytics, a paid plan is required.
Visme is better suited for interactive, visual-first content like infographics, non-linear presentations and branded reports.
It offers built-in assets, animation controls and AI tools that go beyond PowerPoint’s core features. That said, PowerPoint may still be the preferred choice for users familiar with its interface or focused on traditional slide decks.
If you’re deciding between Visme and Prezi, the choice comes down to flexibility.
Prezi does one thing well: zoom-based storytelling. It’s eye-catching, sure, but also limited in scope. You won’t find advanced interactivity, robust brand controls or support for things like form collection or LMS exports.
Visme, on the other hand, gives you room to grow.
Whether you’re building presentations, reports, infographics or interactive content, it has the tools, templates and AI features to help you move faster and create better. Teams will especially love the collaboration, analytics and brand kit features that Prezi simply doesn’t match.
In short, Visme isn’t just a Prezi alternative; it’s a complete visual communication platform.
Want to see what it can do for you? Start exploring Visme’s presentation software and content creation features and bring your ideas to life with ease.
Design visual brand experiences for your business whether you are a seasoned designer or a total novice.
Try Visme for free