


Typography Infographics: 12 Inspiring Examples & Techniques

There are two types of infographic marketers.
The ones obsessed with how an infographic looks, and the others with how it will perform.
But a successful marketer who drives results knows that one cannot exist without the other.
As Paul Allen from Think in Leverage says, "Infographics aren't design pieces. They're attention machines. And attention, not aesthetics, is the true currency of marketing."
If you’re here because you want to improve your infographic marketing strategies and achieve big goals like quality link building, strong brand awareness or powerful lead generation, then you’re in for a treat.
Bookmark this article in your “amazing tips for marketing” bookmark folder and let’s get started.
Before we get started, check out this short video packed with infographic inspiration. And if you like what you see, subscribe to our channel to get notified when we share new videos!
Oh, and one more thing! keep in mind that creating an infographic is a breeze with Visme's infographic maker. Tap into our comprehensive library of ready-made infographic templates to create one in minutes.
Here’s a short selection of 8 easy-to-edit infographic templates you can edit, share and download with Visme. View more templates below:


Quick Reads
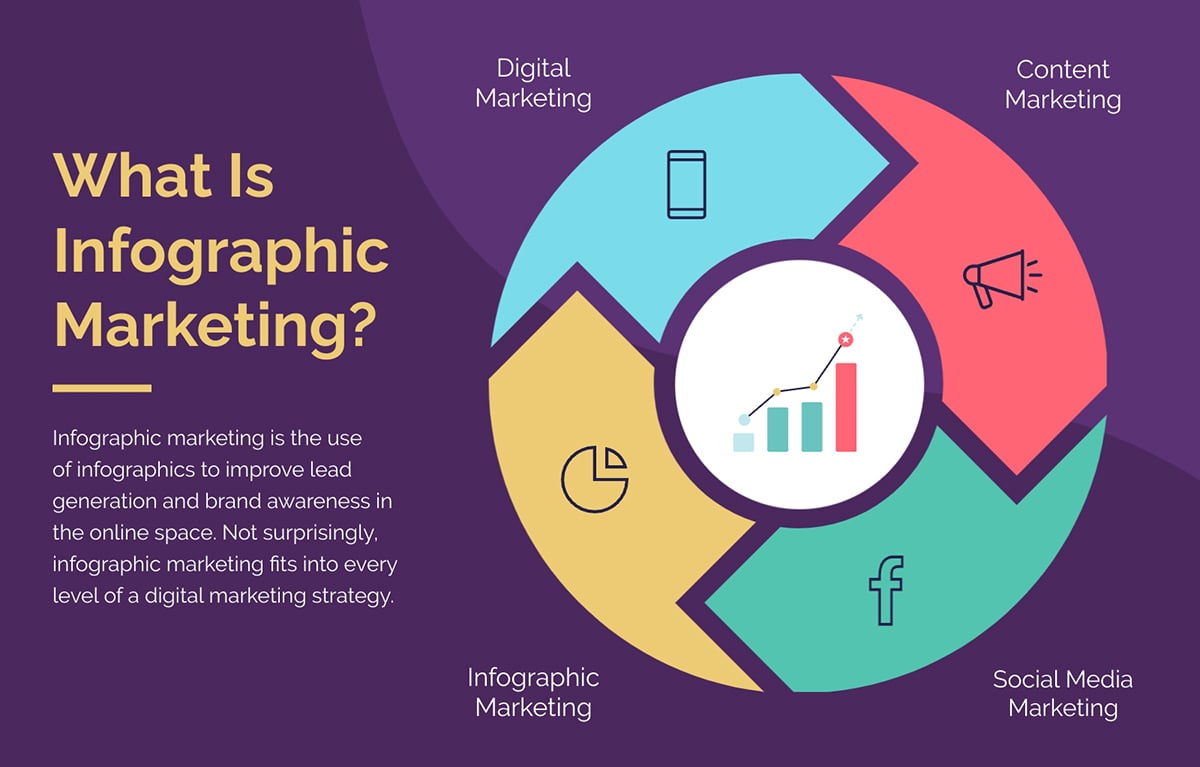
Infographic marketing is the practice of using infographics to achieve marketing goals like attracting leads, building brand awareness and delivering value.
Infographics are so versatile that they work well in digital marketing, content marketing and social marketing.
What an infographic does is summarize the bulk of the blog content into bite-sized, snackable pieces. And when it's pleasantly designed and the content is well laid out, it also becomes easily shareable.
Not every marketing asset or graphic is an infographic, though.
Vincent Pierri, creator of viral infographics, shared that, in his opinion, not all the graphics we call infographics are actually infographics.
He makes a distinction between infographics, charts and visual frameworks. His definition is this simple:
He shared the graphic below to visualize his point. This, of course, is a debatable opinion, but it’s worth talking about nevertheless.
Infographic marketing offers numerous benefits, including return on investment.
That said, the ROI may not be instantaneous; it’s more of a long game.
But best believe, when done right, infographics keep paying you back over time.
A content marketing infographic strategy helps with brand awareness and recognition. The trick is to always make sure your infographic design aligns with your brand in terms of visuals, tone and messaging.
To track the ROI for this metric, pay attention when customers, clients and prospects talk about your brand. Use social listening tools to see if your infographics are being shared on social media; ask new clients if they’ve seen your infographics and if they made an impact on remembering your brand.
As a thought leader, sharing infographics can help improve your status and impact, especially on LinkedIn. The ideal post for this scenario is a well-designed informative infographic paired with a descriptive caption that opens with an attention-grabbing hook. You’ll prove ROI by the number of leads you get from these posts.
The video below shows you exactly how this works.
Infographics for SEO are still one of the most effective link-building tactics. When you create well-researched infographics that share unique data, it can become a reference for other publications. They’ll share your infographic and link back to your site. With each backlink, you improve domain authority and search rankings.
Learn the complete strategy in our guide on how to build links with infographics.
Adding infographics to your marketing mix is a great way to diversify your content and reach a wider audience.
But using infographics for marketing starts with a strategy. And part of that is deciding which type of infographic will best suit your content and planned distribution channels.
Here’s a quick rundown of the most popular types of infographics and their best use cases for marketing.
This video showcases all the types available in Visme, with visual examples.
Let’s take a closer look at each infographic type and some templates you can use right away for your marketing campaigns.
Statistical infographics are great for sharing survey results, research findings and real customer metrics. In the layout, each section includes one data set or a group of relevant points.
Hanna Parkhots, SEO strategist at Unidata, finds that this type of infographic performs better than regular case studies:
“At Unidata, I use infographics to market our data collection capabilities to potential clients. One infographic showcasing our crowdsourcing efficiency with turnaround times, accuracy rates, and cost comparisons, generated 23 qualified leads in two months. That single visual asset outperformed three written case studies combined.“
You can recreate Hannah’s success with this statistical infographic from Visme’s template gallery.
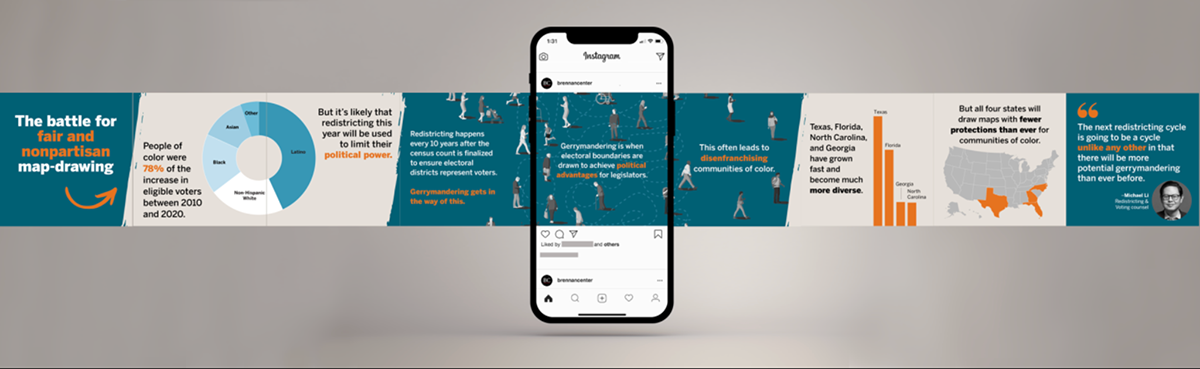
Then repurpose the content into another format. For example, this statistical infographic designed by Yuliya Bas is presented to viewers in a swipeable Instagram carousel.
Informational infographics are ideal for explaining concepts, breaking down complex topics and sharing educational content. Similar to a statistical infographic, each information chunk has its own section in the design.
For both marketing and comprehension purposes, make sure your infographic is eye-catching and easy to scan. Even better if you can establish an emotional connection with the viewer.
Craig Flickinger from Burnt Bacon Web Design uses these infographics for his clients and gets positive results:
“The most effective infographic format we use is what I call the ‘scroll-stopper checklist.’ It looks like a vertical checklist but each item has a tiny visual consequence attached. For a vet clinic, we created "7 Signs Your Pet Needs a Vet Visit NOW" where each sign had a small illustration of a sad dog or cat. That thing got pinned to Pinterest 200+ times in the first month and became their top traffic driver because worried pet owners were searching for exactly that answer at 11pm.”
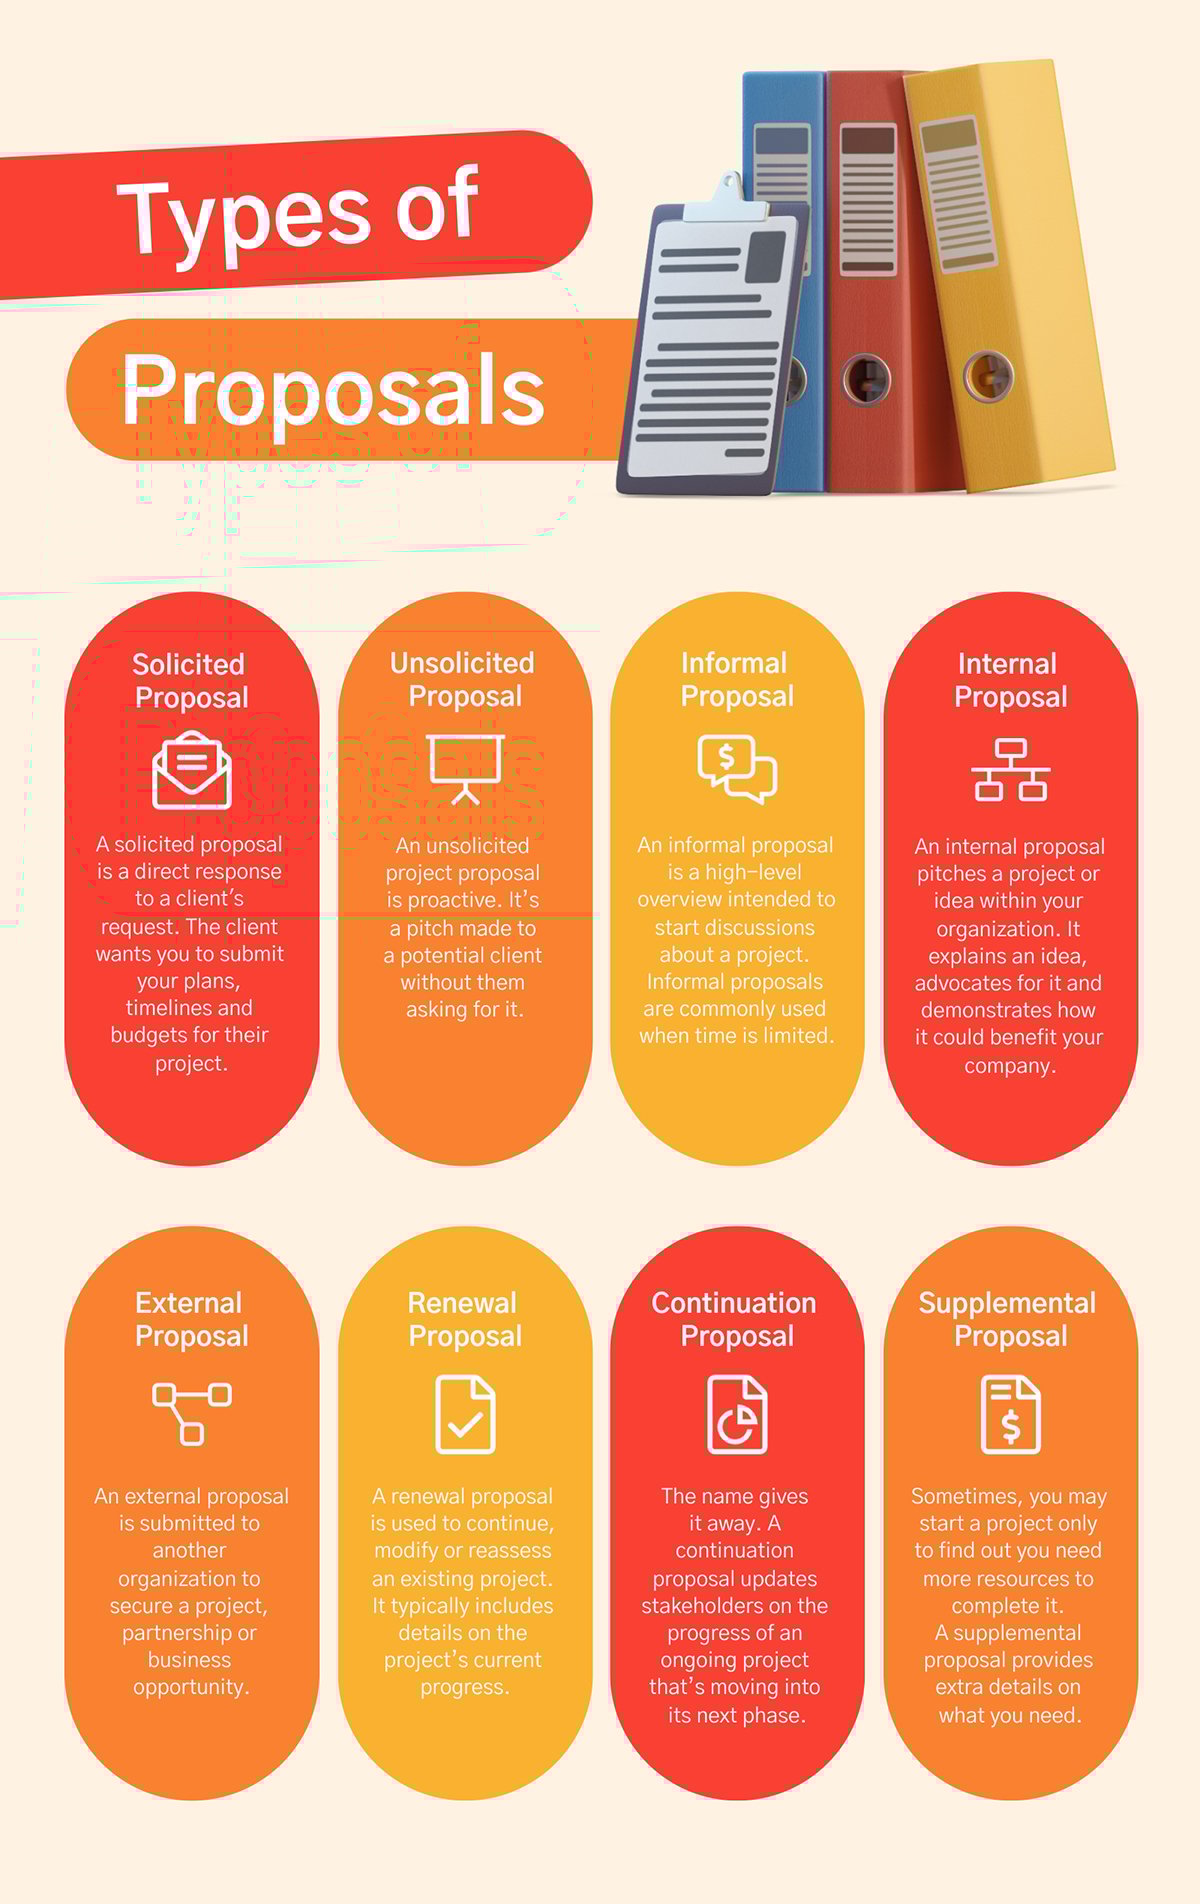
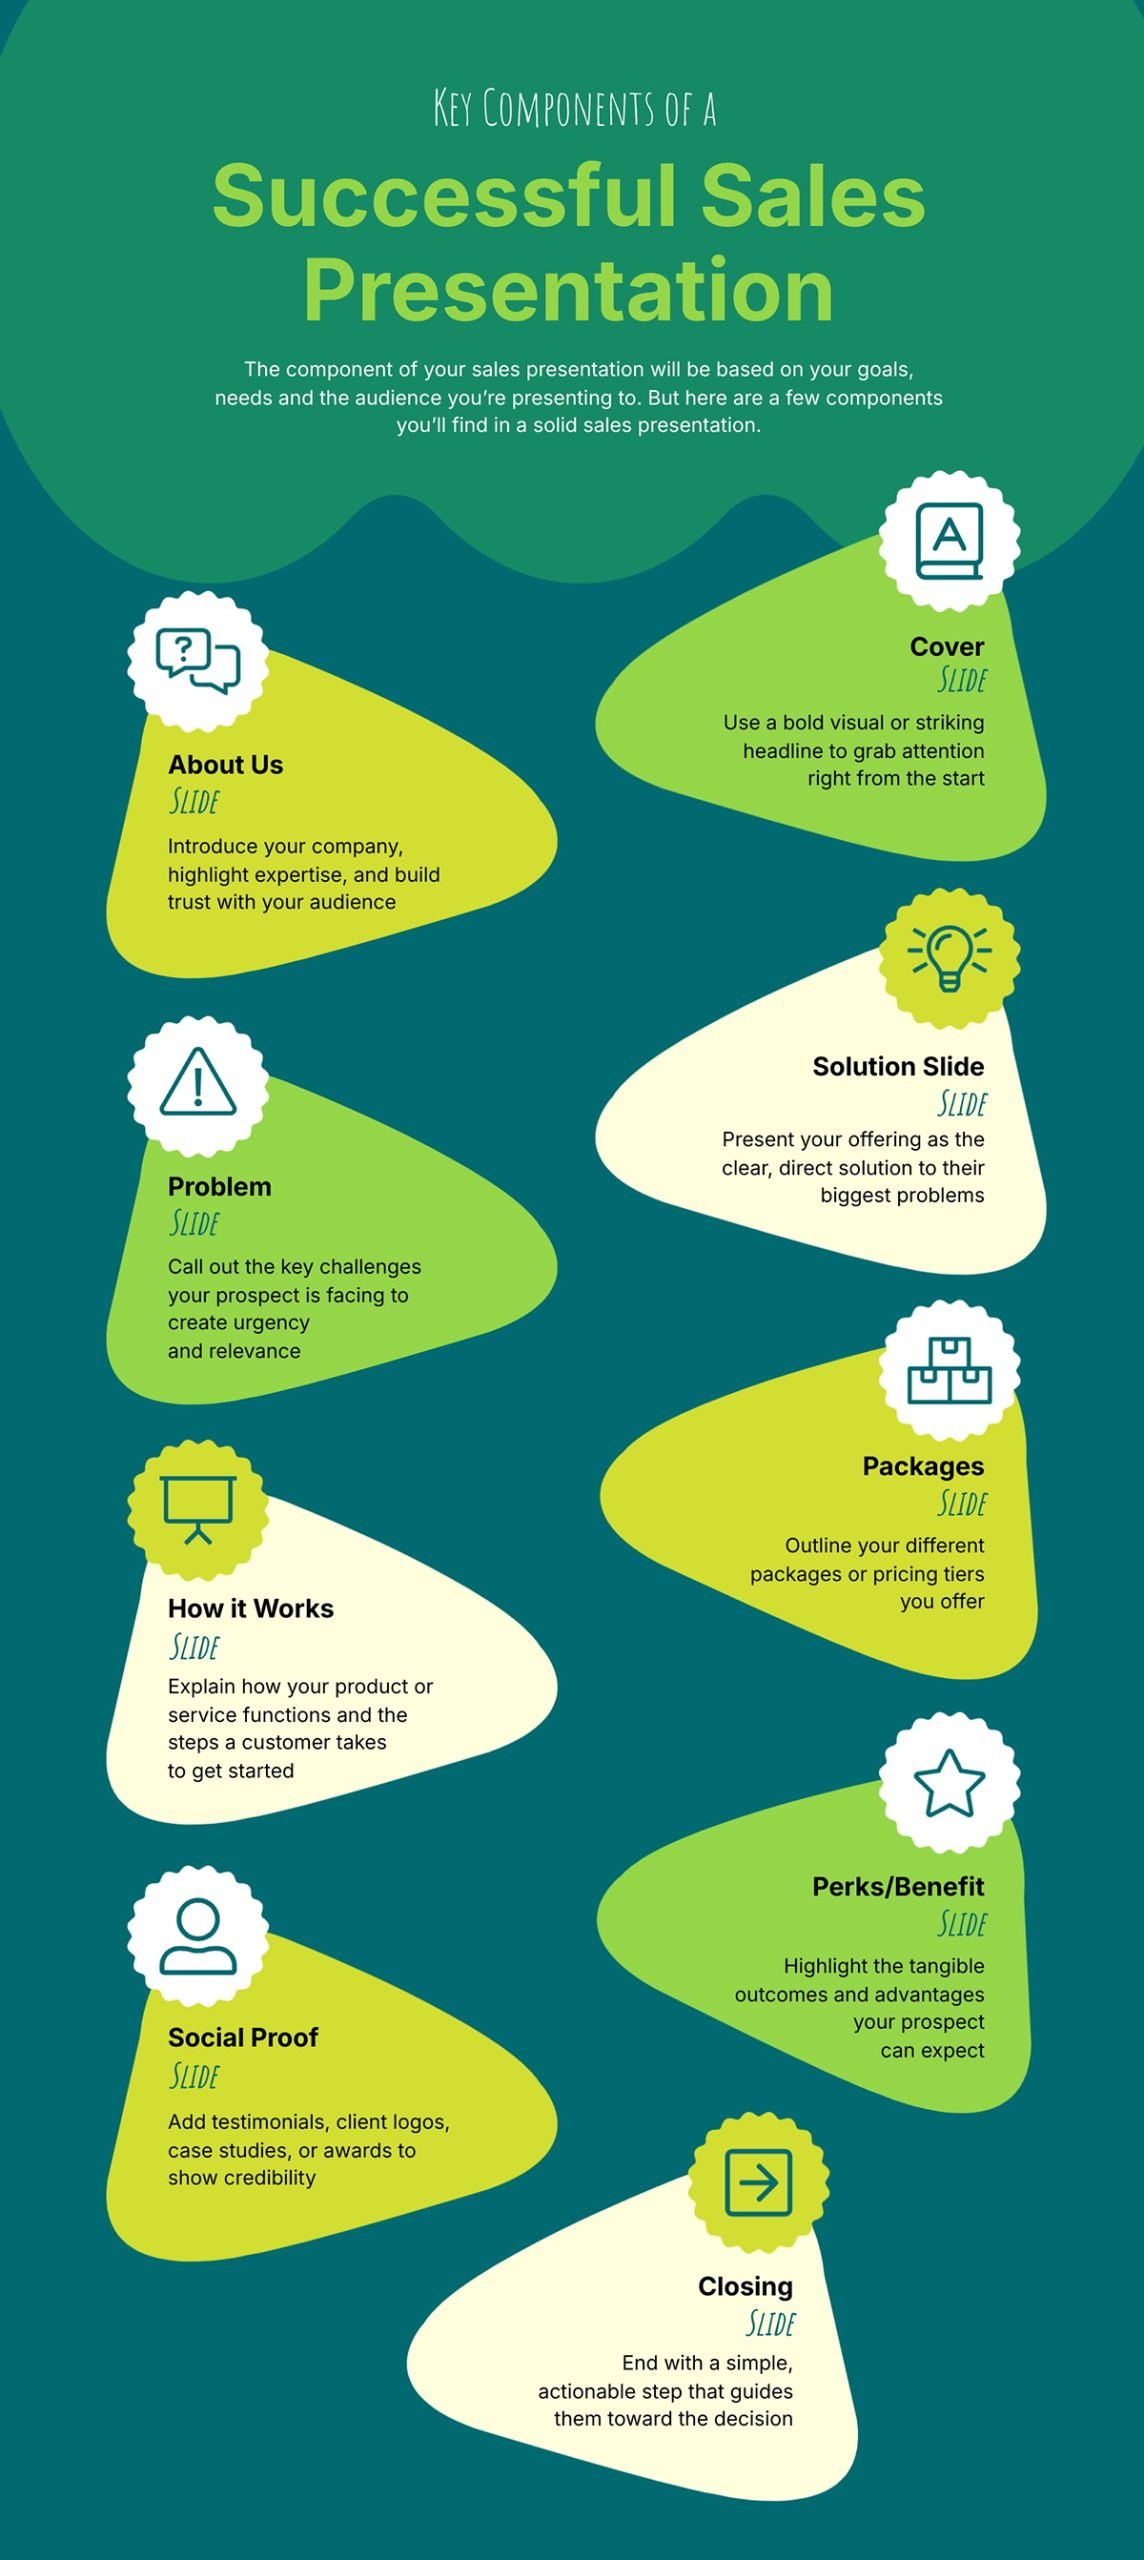
Here at Visme, we have several informational infographic templates for your campaigns, like the ones below.
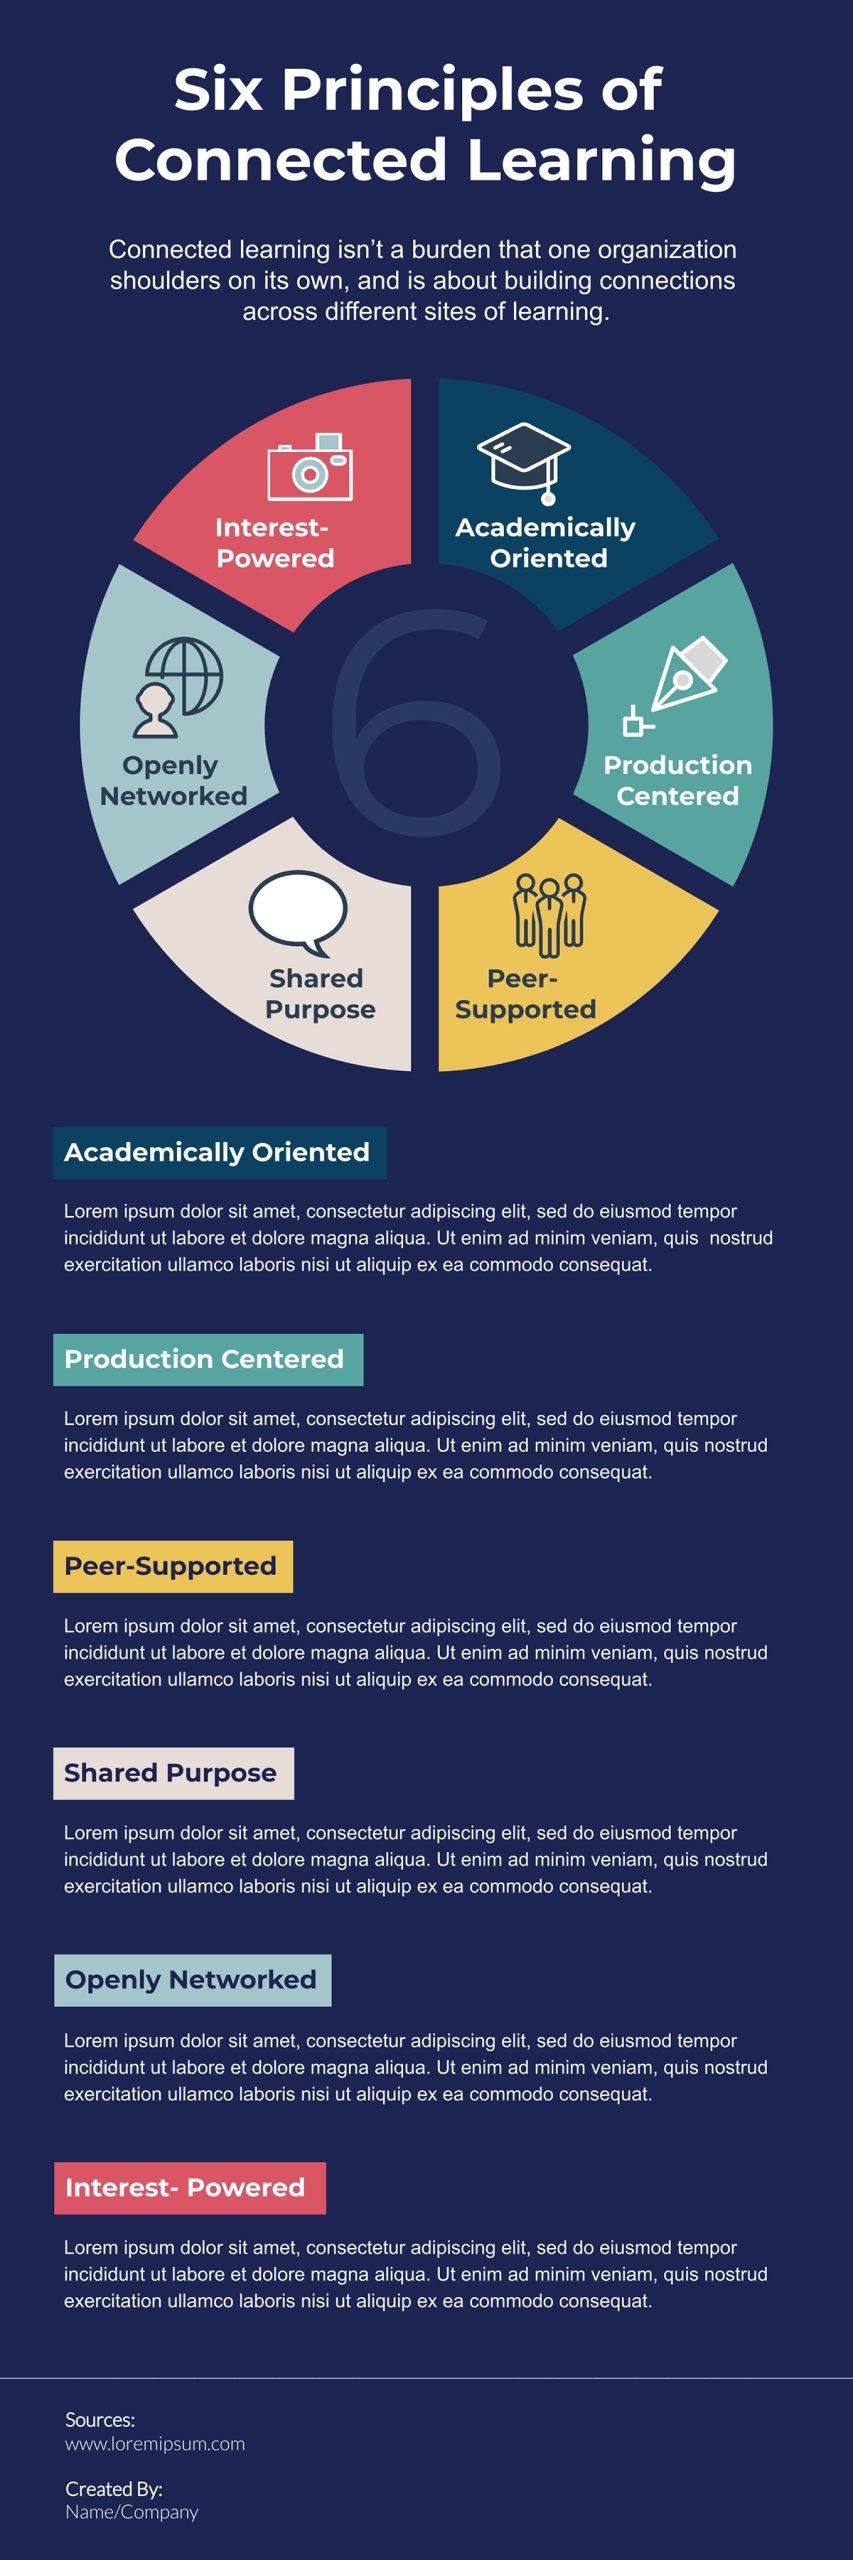
Six Principles of Learning
Types of Proposals Infographic
Key Components of a Successful Sales Presentation
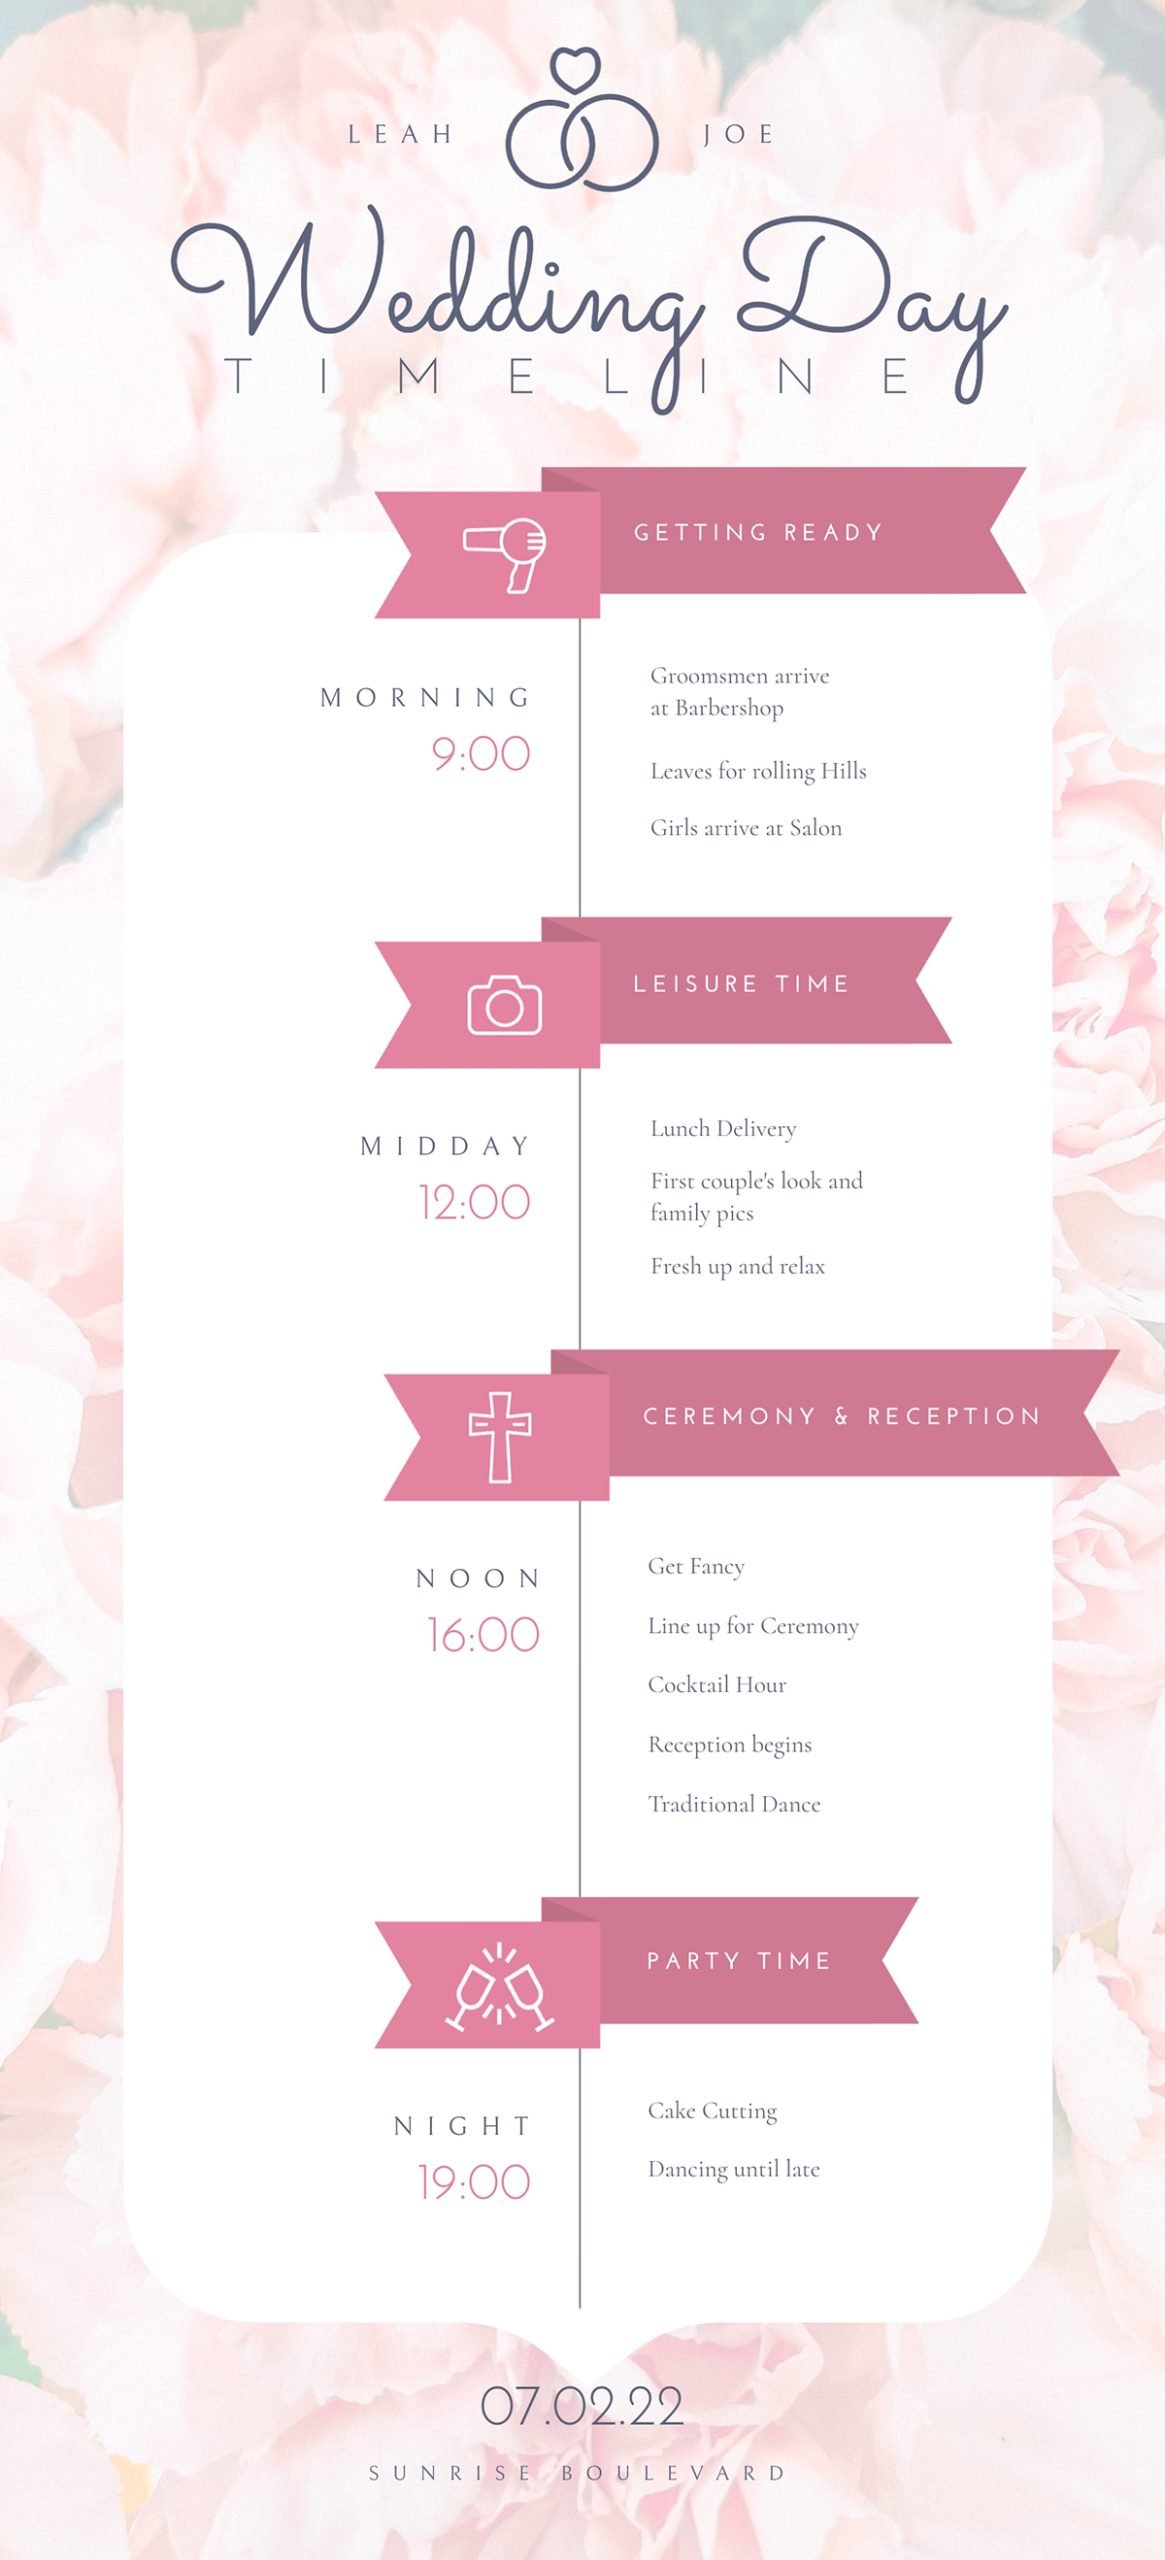
Timeline infographics and roadmap layouts visualize change over time. In a marketing aspect, these can show brand evolution, future plan mapping or launch countdown events.
These infographics are also great additions to trend analysis reports, blog posts that need historical context for current situations or product development newsletters for companies building in public.
When considering your distribution channel for a timeline or roadmap infographic, remember that vertical works best for scrolling on mobile, but horizontal is better for presentations or landscape-oriented content.
The example template below is ideal for a wedding planning company to share on Instagram or even in a newsletter. It shows potential clients what they can expect when hiring the wedding planning services.
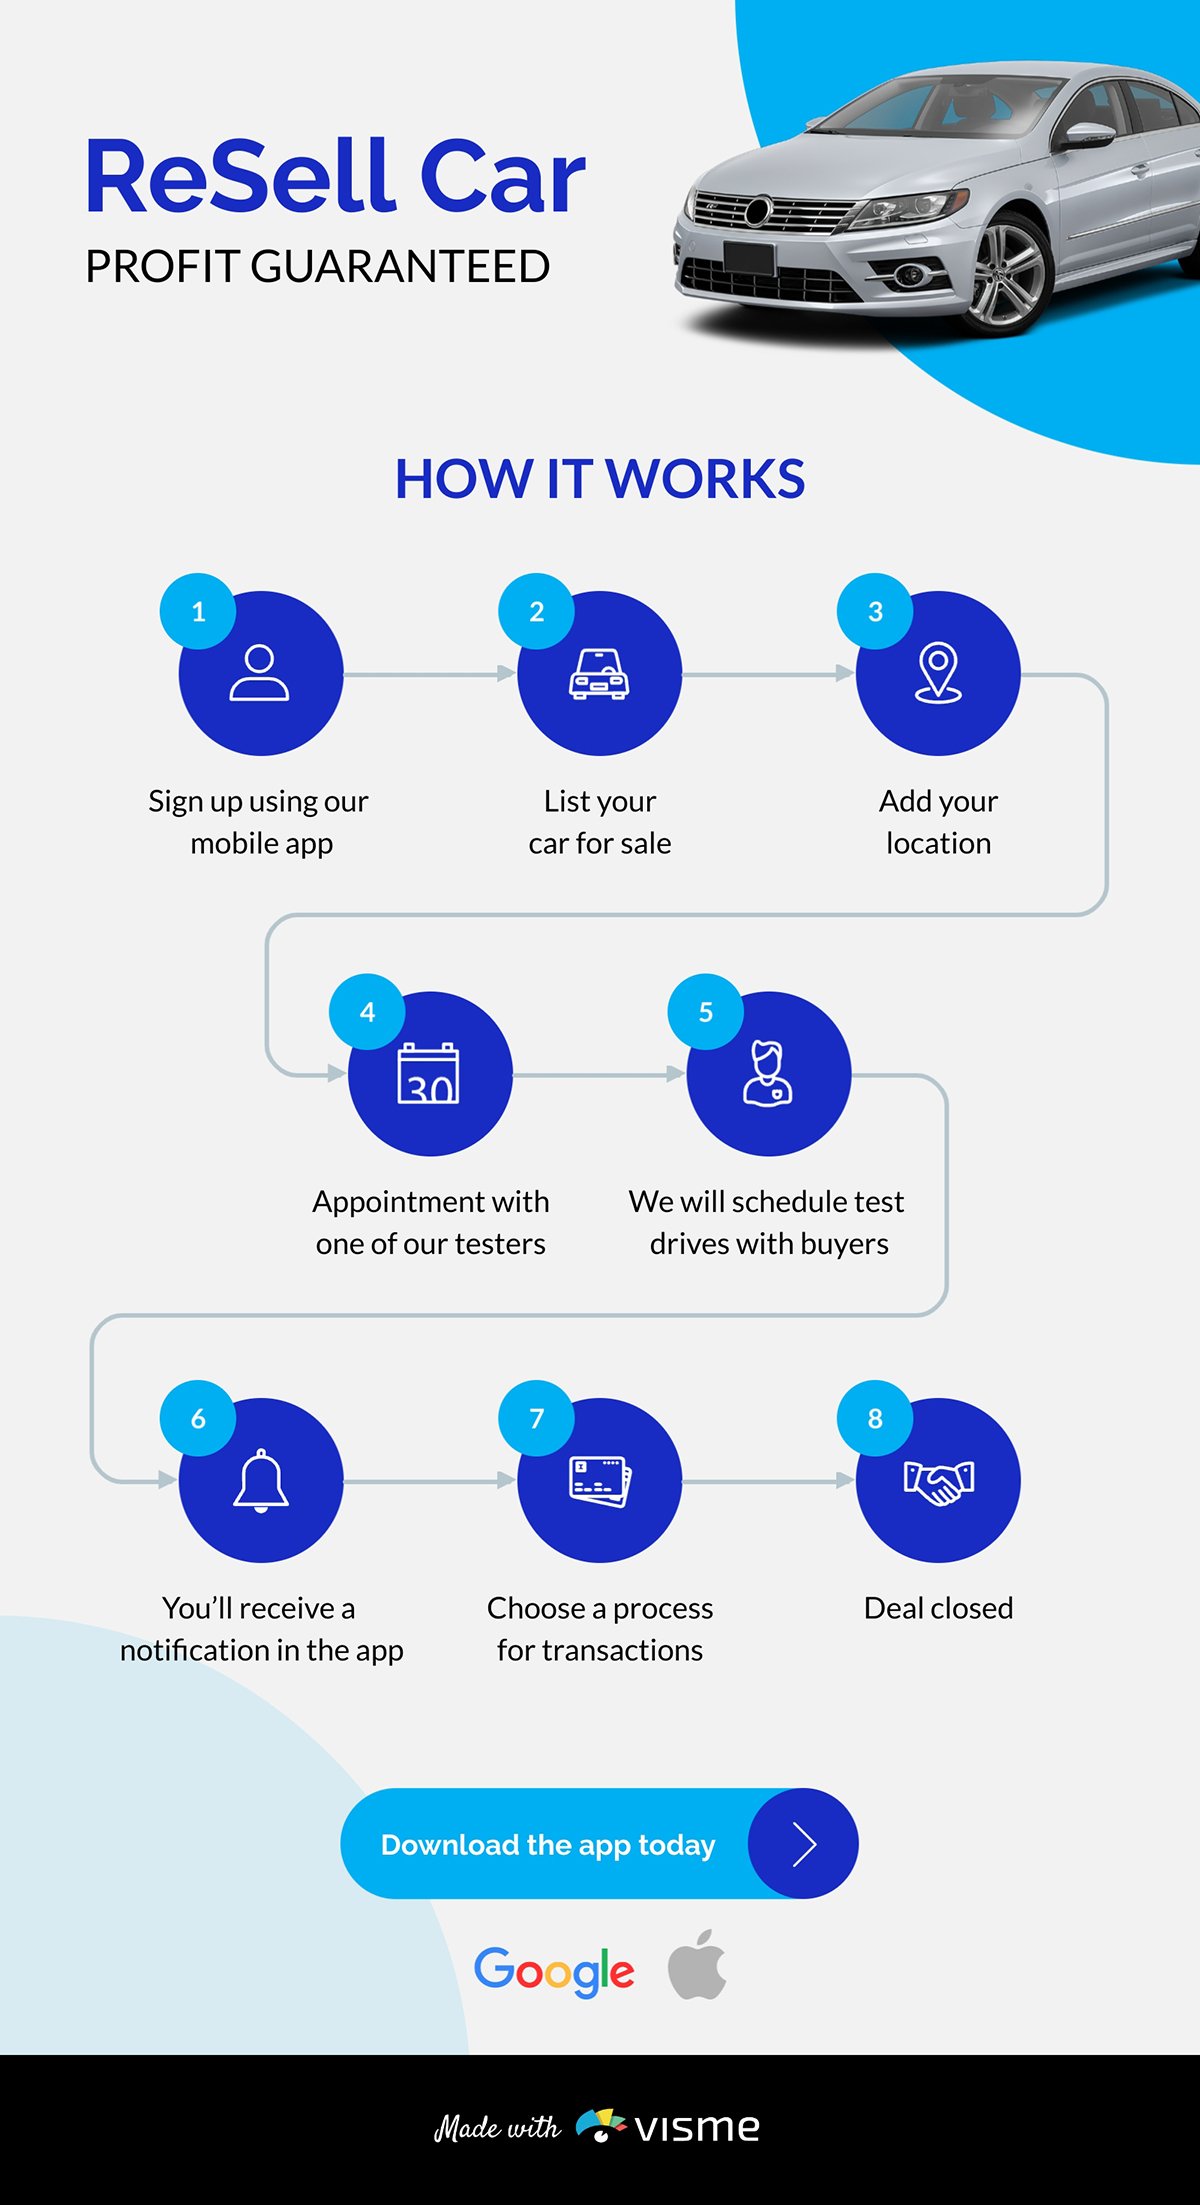
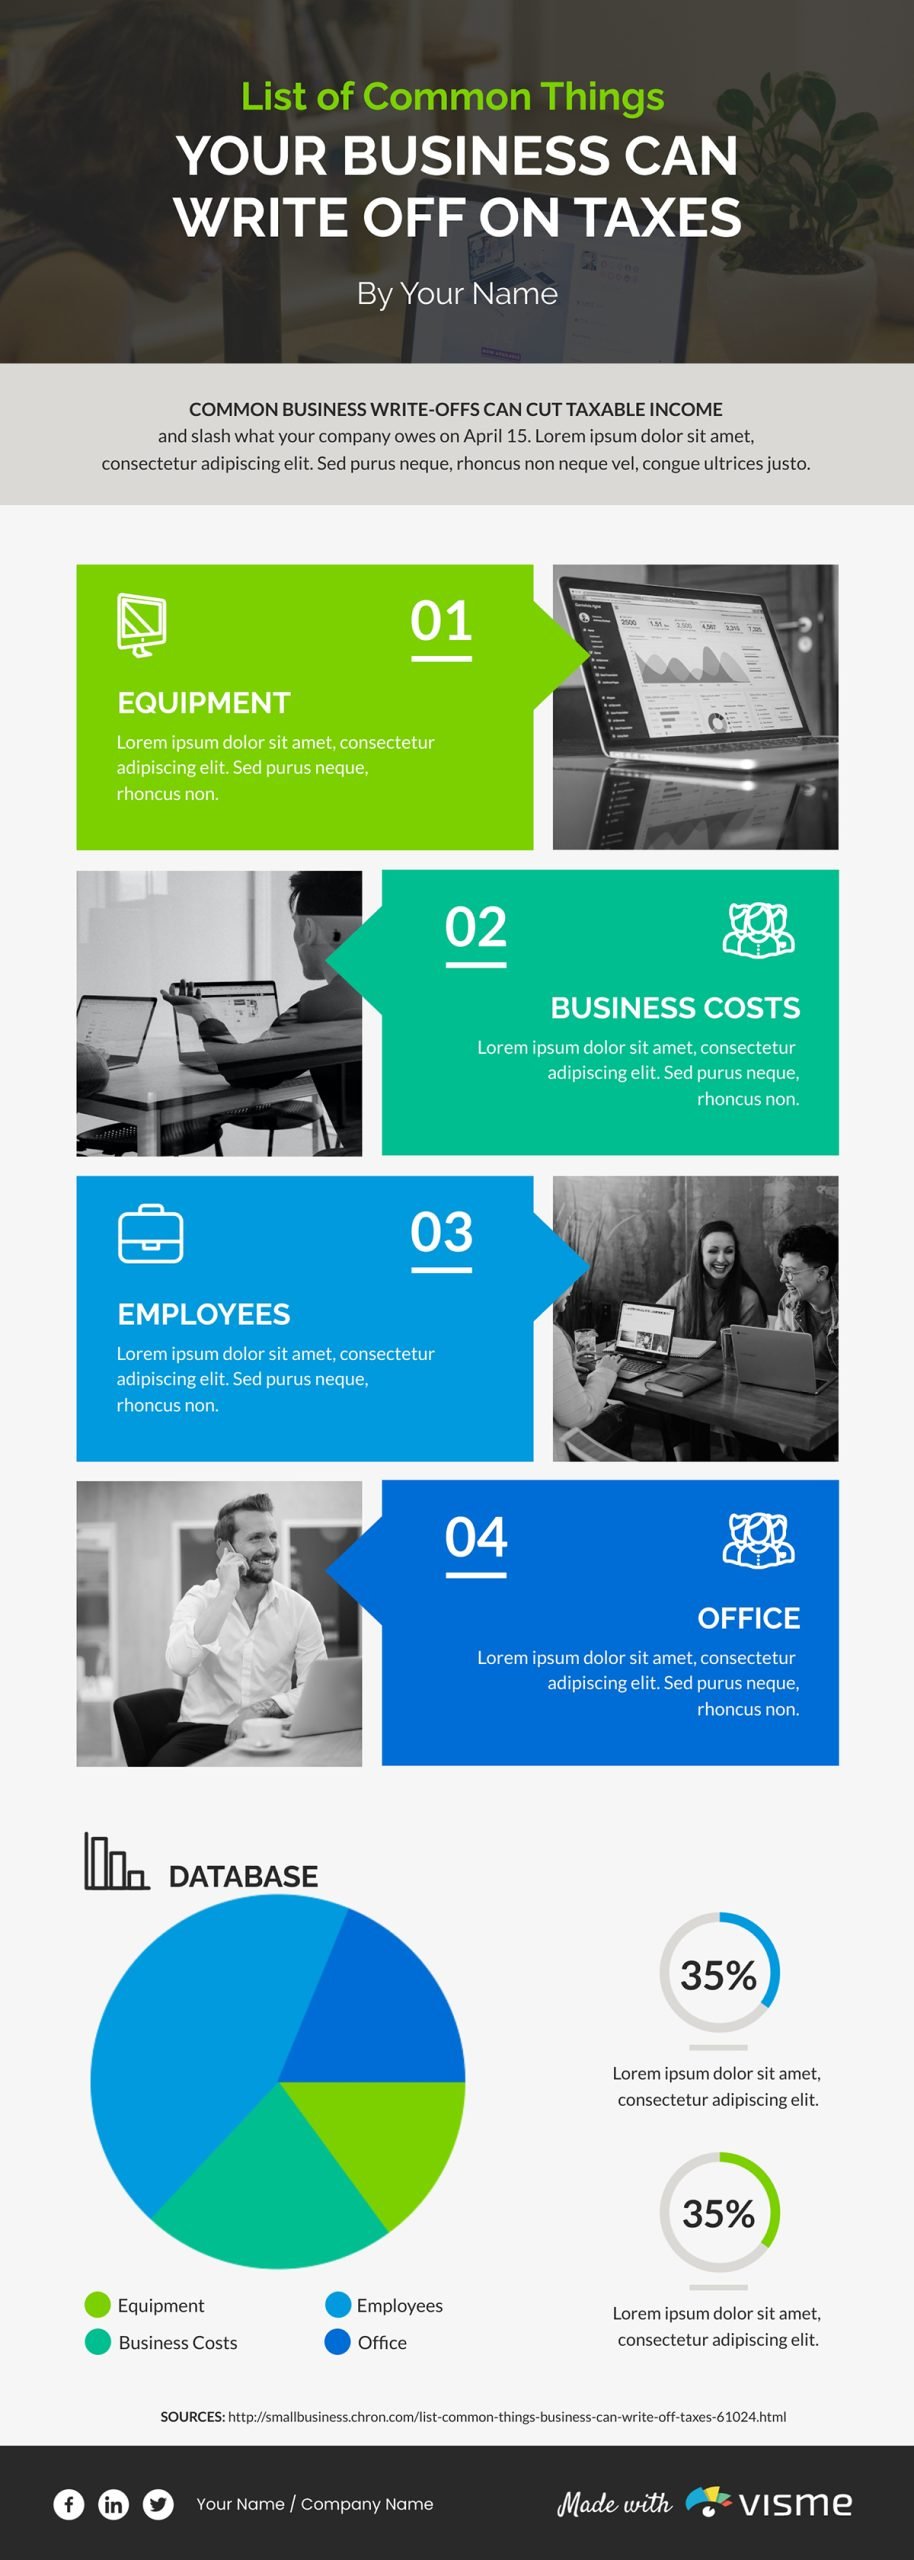
Create a process infographic to visualize step-by-step instructions, how-to guides or explain how something works. These infographics are a great opportunity for backlinking and can also be used as marketing collateral. They work well because they’re helpful for telling stories, and stories sell.
This process infographic template is ideal marketing content for a car reseller. It explains the process of using their app to put a car up for sale.
The list infographic was one of the most popular during the 2010s infographic craze. There were listicle articles with infographics everywhere. They’ve become less popular since then, but still work well in a marketing campaign.
Some content ideas for a list infographic include rankings, tips, collections, best practices, checklists or even infographic marketing ideas like the one below:
For optimal performance, maintain visual consistency across list items by keeping the formatting identical for each item. Make the progression clear by using visual separators, such as lines and alternating background colors.
Here’s a great example that incorporates images for each list item. This design is easy to repurpose into several slides because of its distinct horizontal sections.
Comparison infographics will help you place options side by side for easy evaluation. These help your audience see how your solution stands up to alternatives or highlights meaningful differences. Other ideas include:
When designing a comparison infographic, allocate space on the canvas based on how many things you’re comparing.
Create table-based comparison infographics using Visme and connect the empty table to a Google Sheet or Excel spreadsheet. You’ll save time by not having to enter all the approved information by hand, especially if you already have it somewhere else.
Here’s a simple and to-the-point comparison infographic that uses the table feature I mentioned. This would fit perfectly inside a blog post.
The purpose of an anatomical infographic is to describe the parts of a concept or object. Despite the medical-sounding name, they work for any subject that requires part-to-whole visualization.
Here are some infographic marketing ideas for this style:

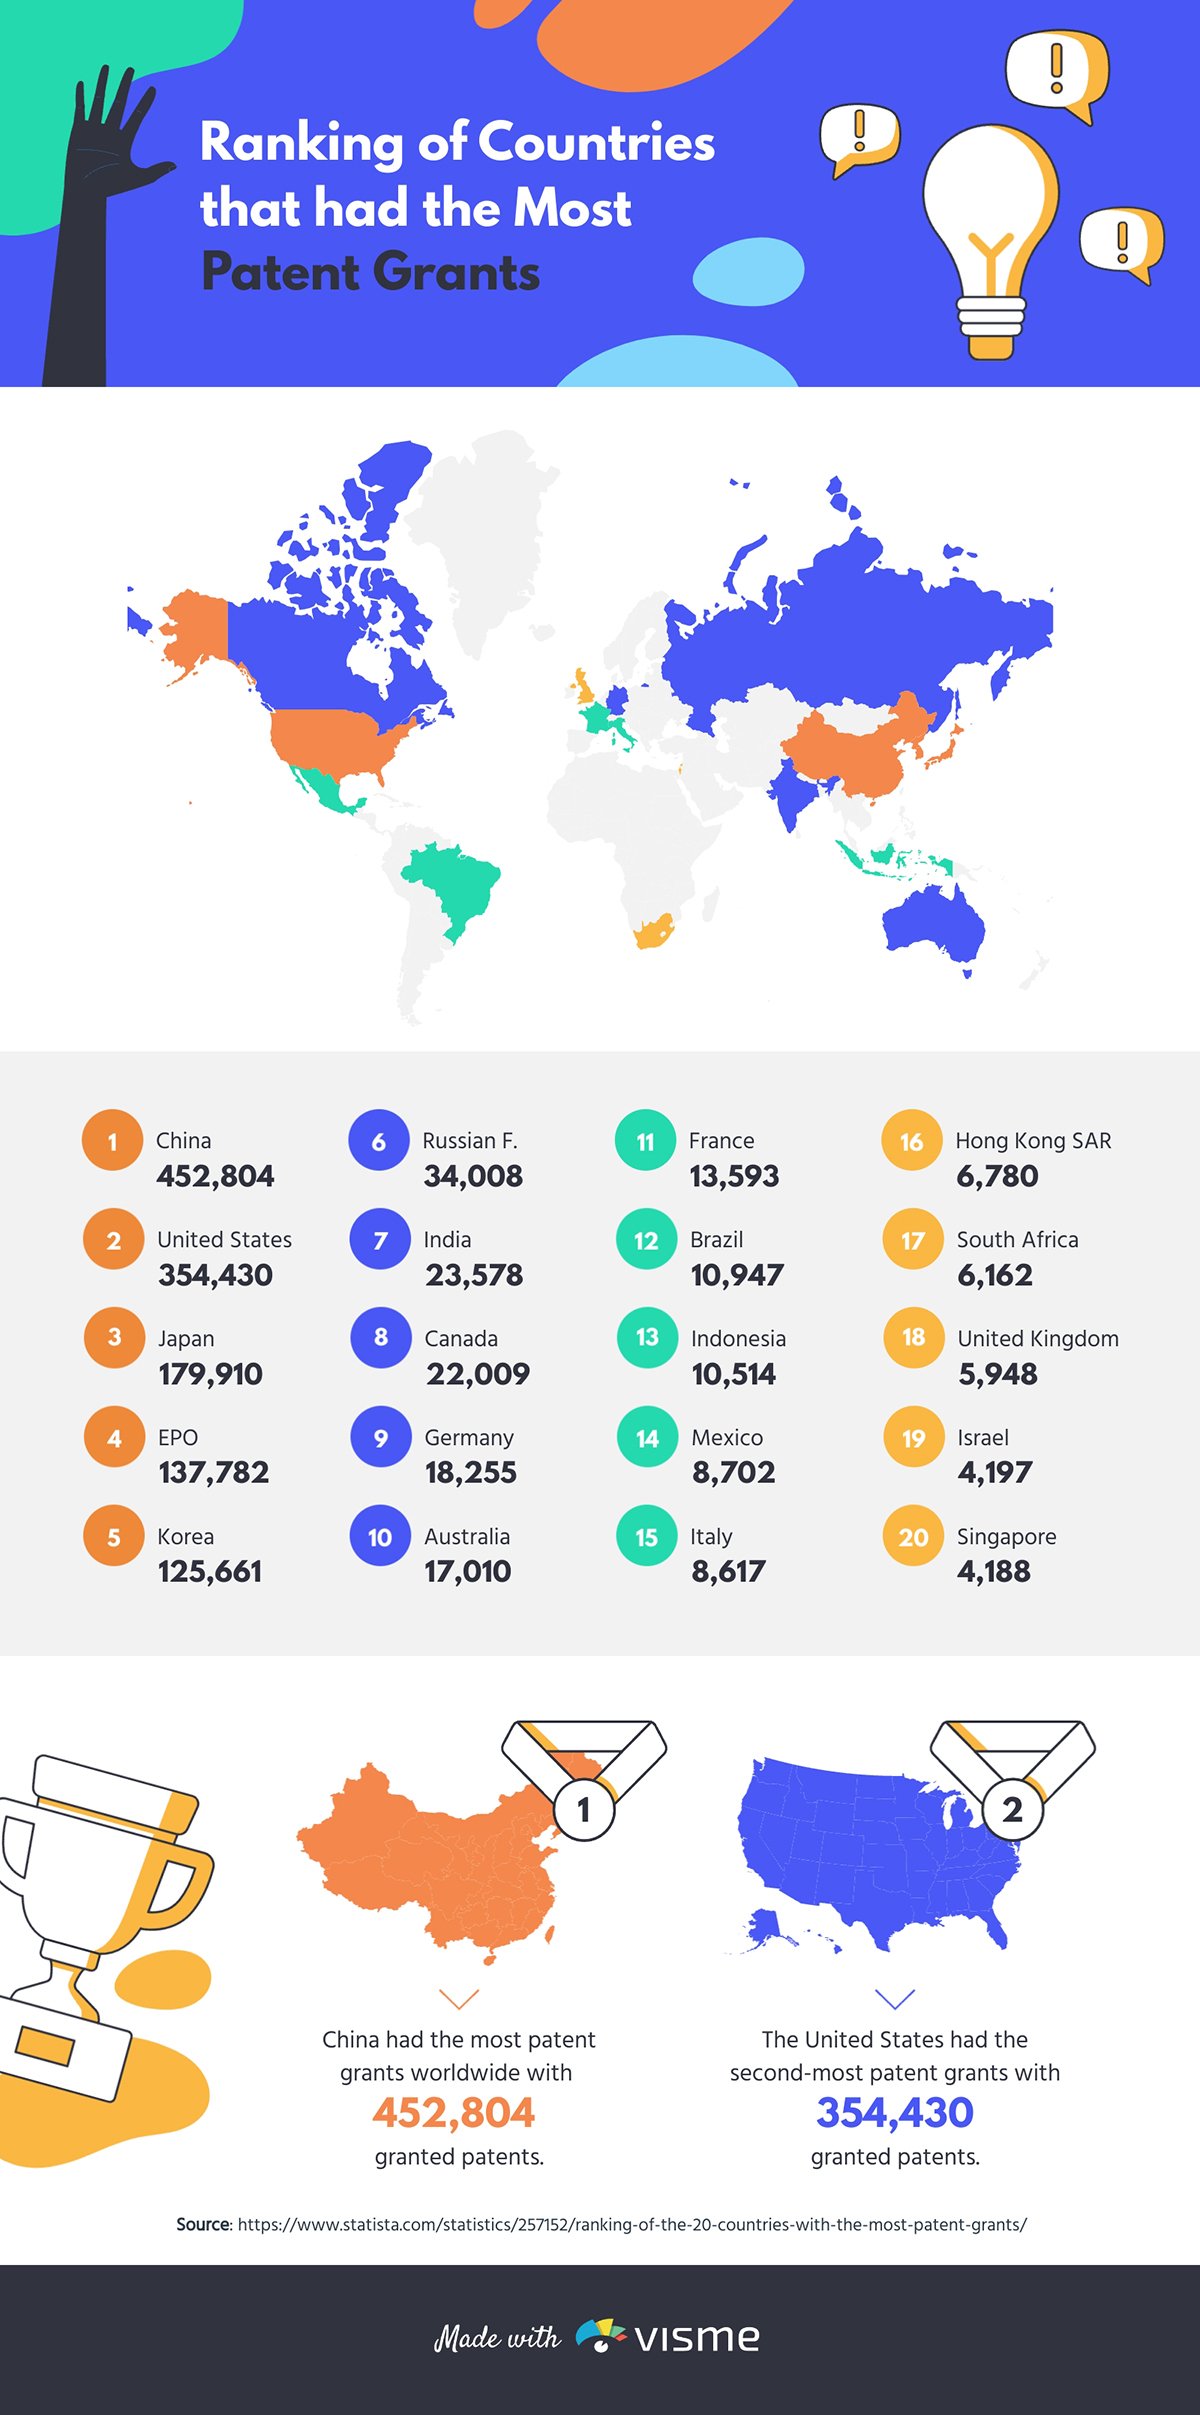
With a location-based infographic, you can create marketing material that shares information through maps and geographic content. Interactive maps, for example, are good for displaying store locations, a delivery area for your restaurant or the opening of a new HQ.
Another use for this type of infographic marketing is for city brands. A map infographic can be printed on postcards, foldable posters or put up as wayfinding signs.
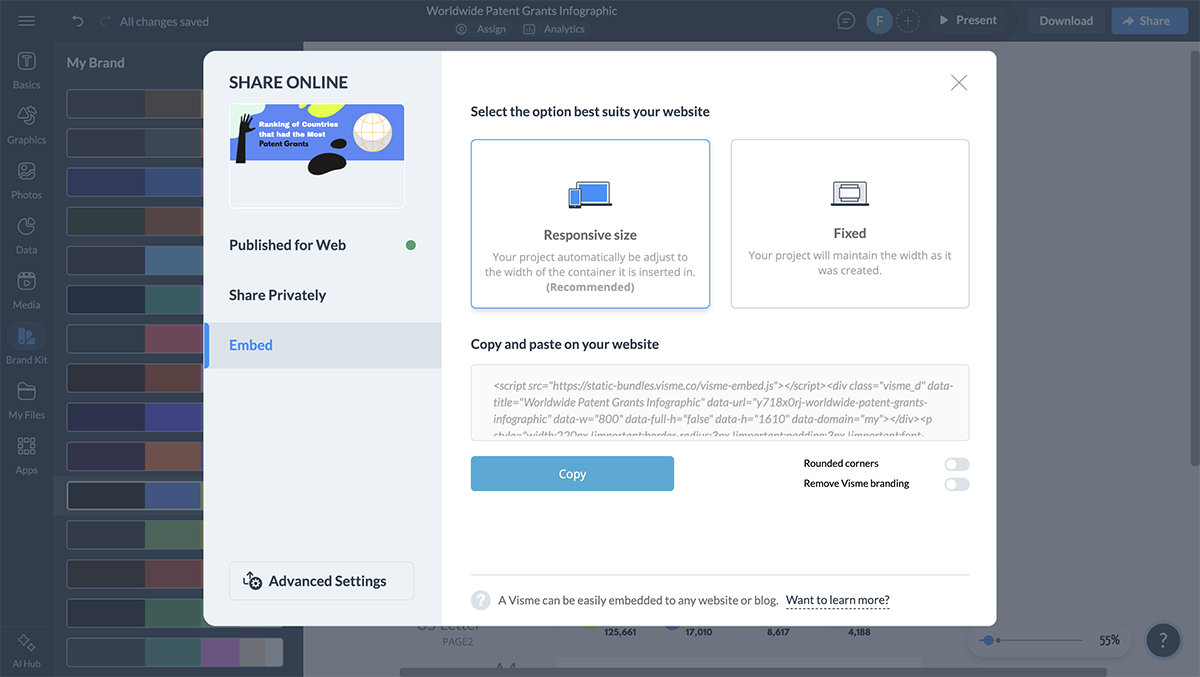
Visme has several map templates to choose from. This one highlights the countries with the most patent grants.
Marketers can make interactive infographics by adding animation, video, hyperlinks, popups, embedded Visme Forms or hover effects.
You can even turn your infographics into explainer or promo videos.
Use Visme as your infographics maker and take advantage of all the interactive features inside the editor. Like, for example:
Creating infographics that generate leads and drive results requires more than just making them look pretty.
Follow this framework for your infographic campaigns and you’ll see better ROI than if you just post and ghost.
Ready? Let’s get started.
Once you’ve figured out your campaign goal, the next step is to brainstorm the story you want to tell and how you'll tell it. With a clear idea of your objectives and goals, pick a topic relevant to your target audience and your brand.
For instance, if your goal is to let people know about an upcoming launch, then that’s your topic: the launch itself. But if you’re aiming for brand awareness, then the topic is more conceptual and you have more room to get creative.
Conduct a brainstorming session to come up with a great topic and some ideas for its execution.
Then, use storytelling techniques to draft an outline with the most essential points. Once you have a clear idea of what you want to convey through a specific topic, choose the best infographic type and layout for that purpose.
I wrote an in-depth article for this step; learn how to choose the ideal infographic layout for your needs.
Do you have all the information, content and visuals you need to build the infographic? Use your outline to identify what’s missing. Looking at infographic templates designed in the layout you chose also helps pinpoint what you’ll need to build the design.
For the text, source copy from your blog posts and publications. Work with your writers to craft short and concise text bites. If you need help, Visme’s AI Writer can help out with an initial draft. You can also use it to refine the tone or shorten long text to make it useful.
You’ll also need visuals. When using Visme, you won’t need to look anywhere else for icons, illustrations, shapes, graphics, stock images or characters and avatars. The editor comes fully equipped with all that. But if you do have branded visuals, all you have to do is upload them to your Visme workspace and keep them organized in a folder.
Moving on to the actual design. If you haven’t yet, log in to your Visme workspace. Once here, open a blank infographic canvas or select a template. Make sure to use the infographic editor, which has unique features specifically designed for creating infographics.
This article isn’t about creating the infographic itself, but the campaign around it. For a detailed step-by-step, read my guide on how to create infographics from beginning to end.
Here’s a quick rundown:
This video from our learning series will also help:
If you’re building an infographic with a team, take advantage of Visme’s collaboration tools, like the workflow feature that’ll help you assign tasks with instructions and deadlines. When the design draft is ready for stakeholder review, share a link with commenting access. Guests can leave feedback in notes right inside the design.
Remember what I said before about how an unrepurposed infographic is a waste of resources? It’s time to revisit that idea and now I’ll teach you how to do it.
To set the scene, content repurposing isn’t exactly a new marketing technique.
For example, we’ve been turning blog posts into videos for years. But I’m not going to lie, that type of repurposing takes a lot of time. Thankfully, using a single infographic idea and repurposing it across multiple channels is easier and faster.
Need convincing? The infographic below lays out the five main benefits of repurposing.

Ok, so how do you repurpose an infographic for marketing? Let’s get into it.
First, identify the distribution channels you’ll be working with, and list all the versions of the infographic you'll need. Take note of ideal sizes, dimensions and formats. With Visme, you can achieve all of them, don’t worry.
On to the design. Start with your main infographic, preferably a vertical one. This way, you can see the entire thing in one place, helping you stay consistent and cohesive with colors, fonts, sizing and spacing.
When you’ve finished your vertical design, make a copy and do one of the following, depending on its new destination.
Keep all versions of your infographic in a folder on your dashboard. Give access to the blog, newsletter and social media managers so they can collaborate and access the designs and use them for their part in the campaign.
With everything ready to go, it’s time to share and publish your infographic for distribution. Here’s a list of all your options:
Furthermore, you can share your social media marketing infographic directly to your social channels from the Visme dashboard using the social media scheduler.
When doing so, include a relevant caption with an engaging hook and description of the infographic. Invite viewers to share with their own followers to gain more exposure.
Infographic marketing needs ROI to be effective, so you’ll also have to track your infographic’s performance. There are several ways to achieve this, some with Visme and others with external tools.
Here’s a list of potential routes to take:
Aman Rangrass, the AI Revenue Leader at Skan AI, has an amazing repurposing strategy:
“The trick is to adapt the same infographic for multiple channels instead of posting one static file everywhere. On LinkedIn, I break it into a carousel; on Twitter (X), I post key stats as image snippets; in email, I use a simplified version to keep it lightweight. We also repurpose infographics as motion graphics or short looping videos to boost engagement."
Theory and execution without inspiration just aren’t as successful. That’s why I always like to show you examples from real businesses.
In this case, I’ve collected four infographic examples used in marketing campaigns.
Let’s take a look.
Using Visme as their tool of choice, Research for Scalable Solutions (R4SS) created an interactive informational infographic for their newsletter. They shared it via the live Visme link, allowing them to track opens and views to measure performance.
The design begins with a navigation menu in case you don’t wish to scroll through the entire infographic. Throughout each section, R4SS shares vital information about their cause with visuals, text and hyperlinks to detailed publications.
Check it out below and try the navigation controls, hyperlinks and interactive map.
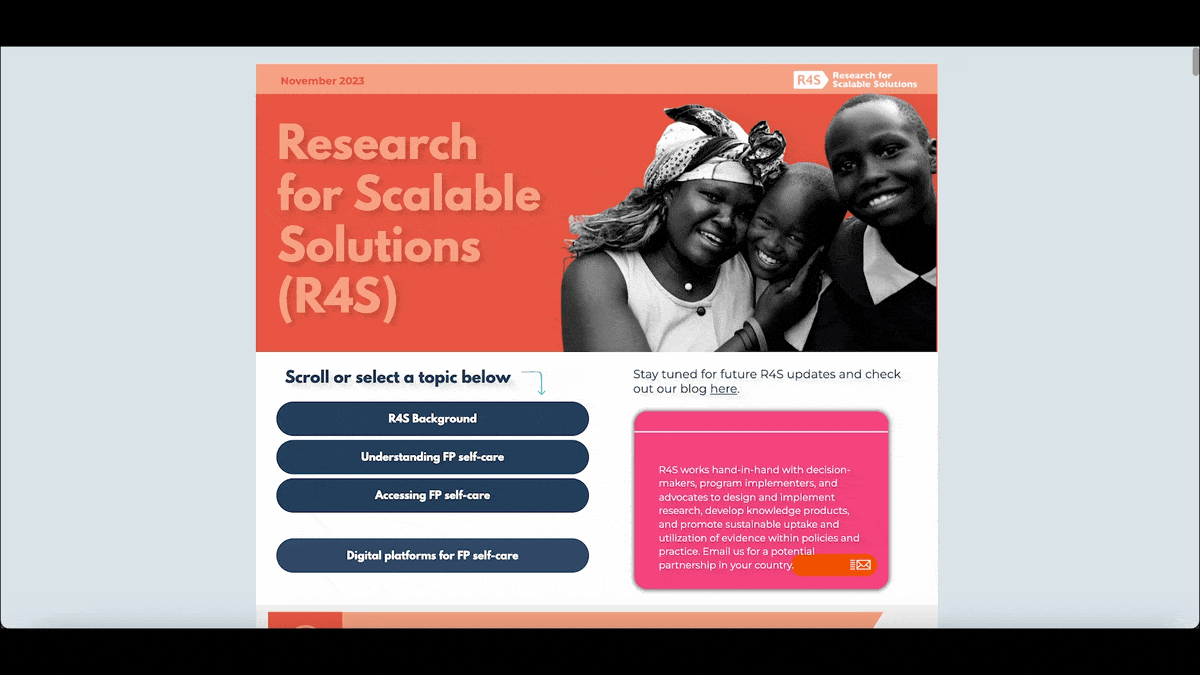
Source: Research for Scalable Solutions
Here’s an infographic template from our gallery that you can customize to make it interactive like the one above. For example, add content popups that provide more information in text, video or audio formats. Or animate the info points to enter the screen as you scroll.

Comparison infographics are great marketing tools for ecommerce businesses. This one, from Style Korean, compares four non-comedogenic sunscreens. They offer all of them in their store, which you can reach through their Instagram link.
Notice how the background color behind each product contrasts with the packaging color. Plus, each bottle has a shadow. These visual techniques make the products stand out, making them easy to look at individually.
Since this is a fun, young brand, they use emojis in their design to make it relatable to their audience. They were smart to include each product’s brand logo to increase memorability for the viewer.
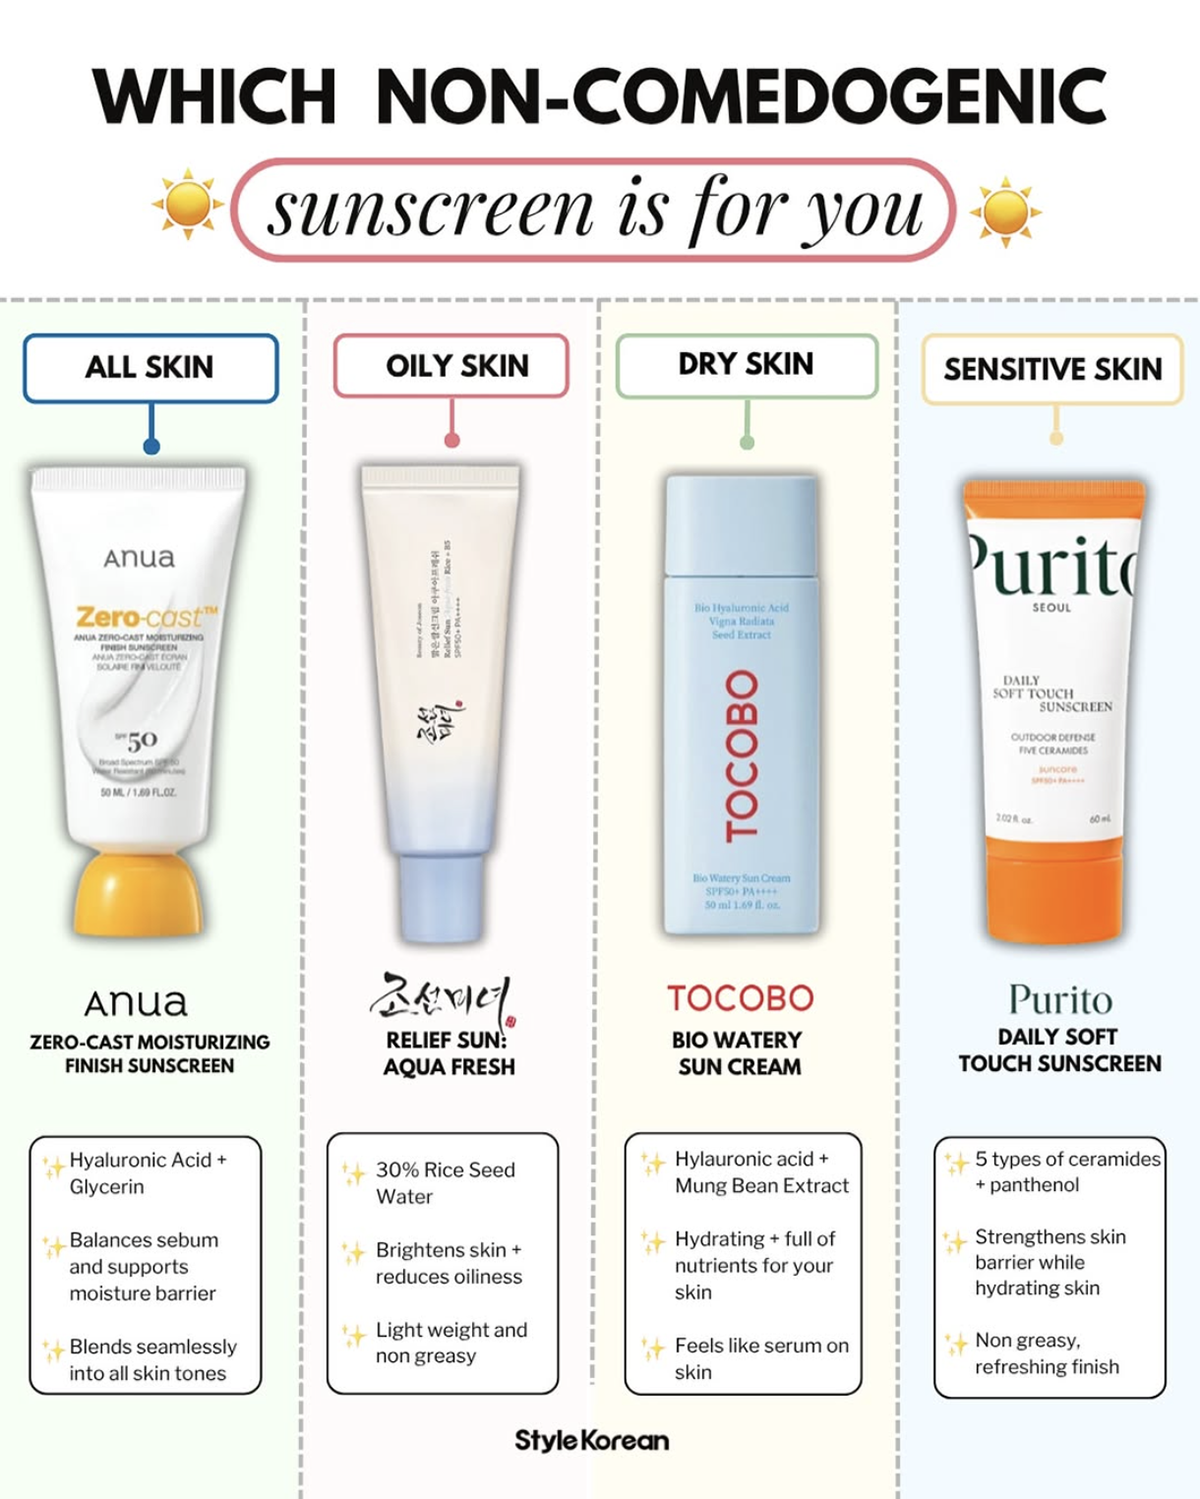
Source: StyleKorean via Instagram
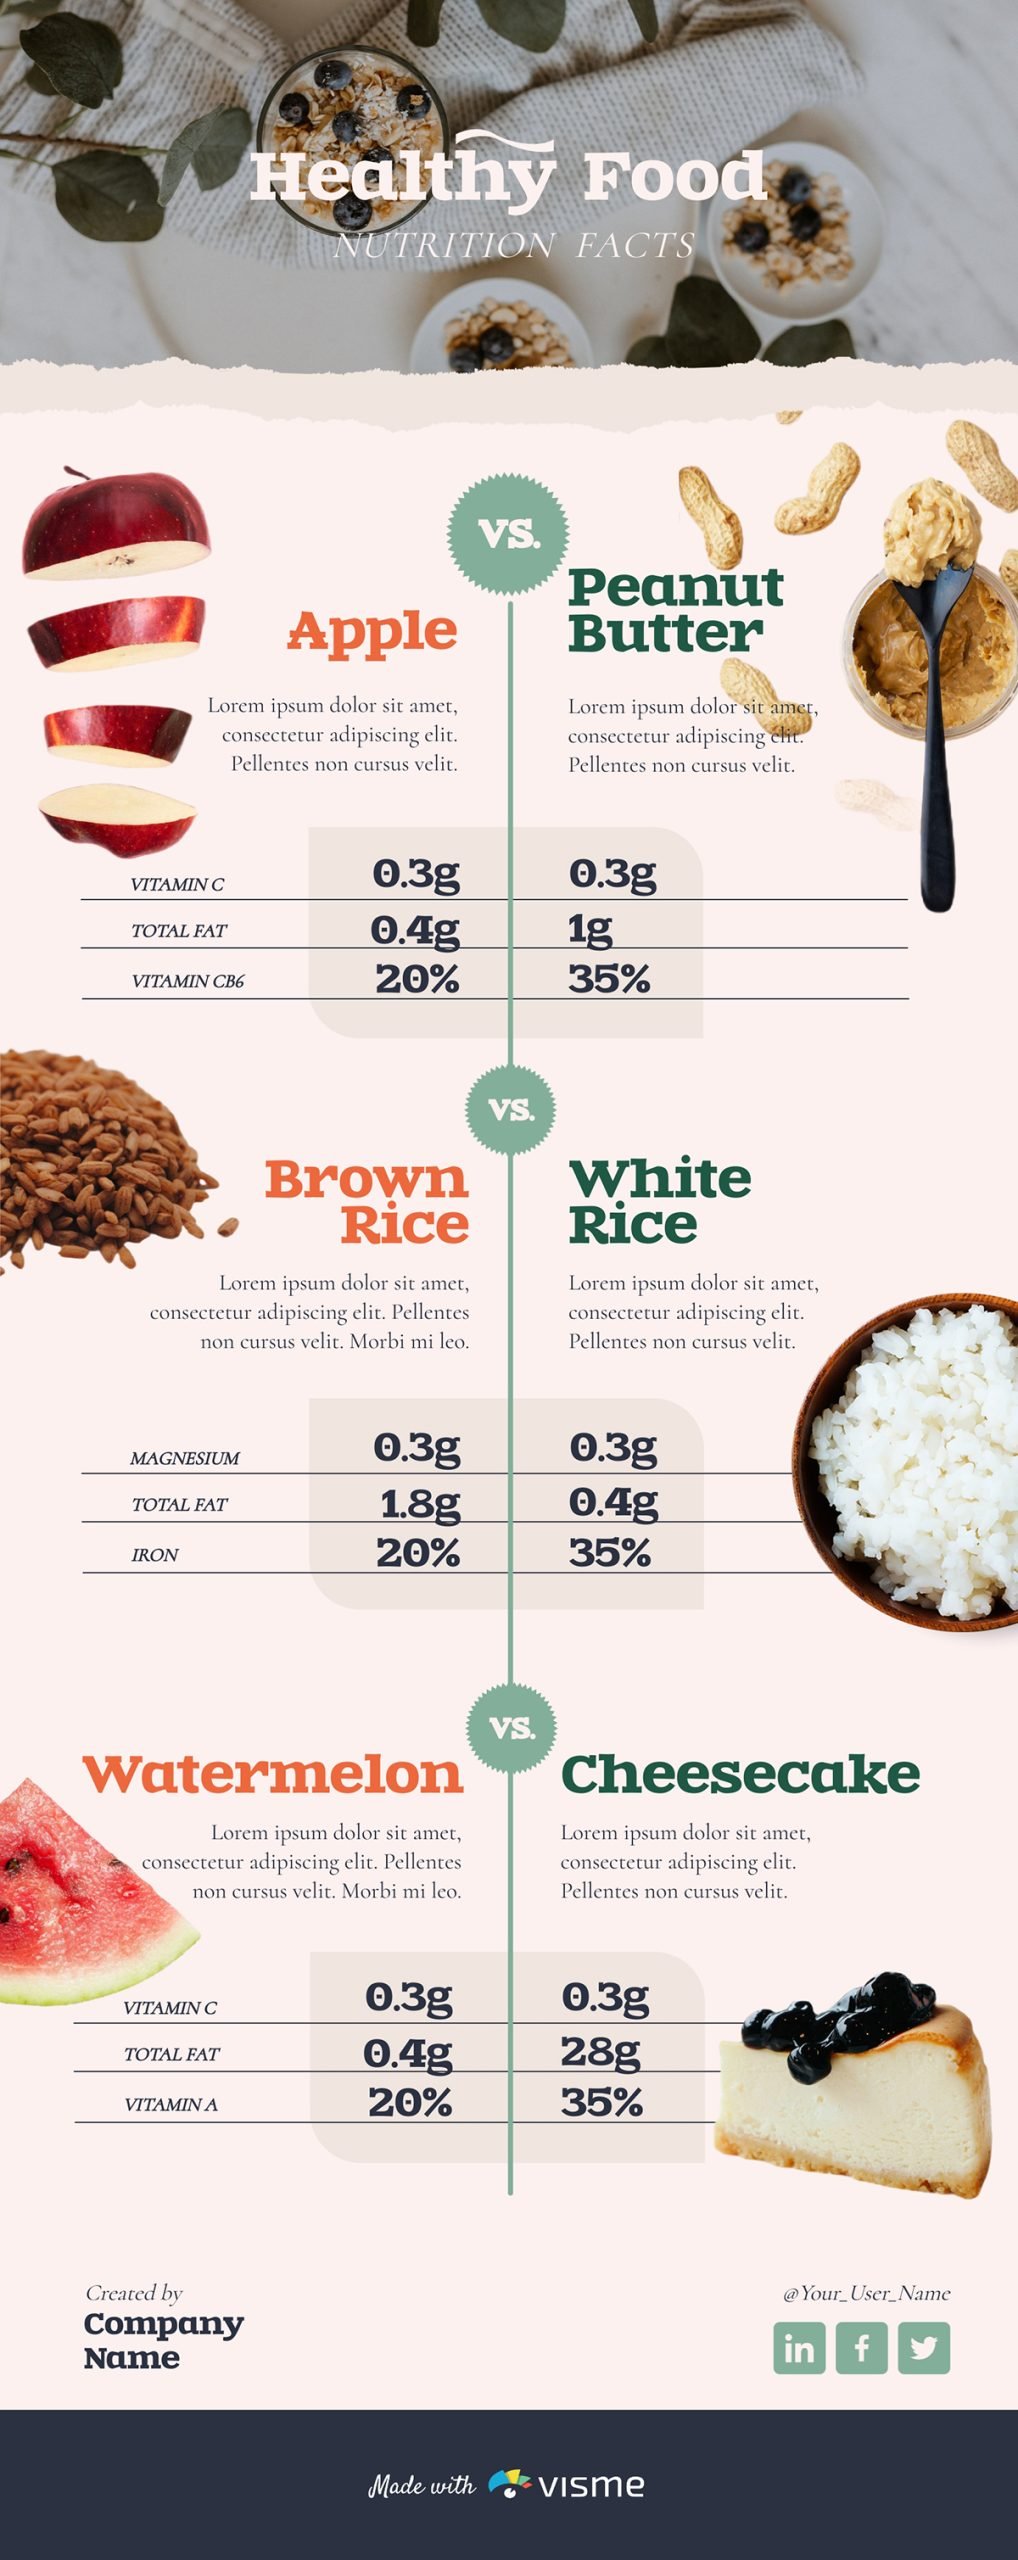
Comparison infographics with images instead of icons and illustrations make a greater impact when the things being compared are actual physical things. In the template below, our designers set up a comparison of different healthy foods, using cutouts of the ingredients.
Location-based infographics, like illustrated maps, also work well in marketing strategies. Adriana Danaila, expert infographic illustrator, designed this map for the town of Flushing in New York City.
Flushing.com published the map on its website, and according to Adriana, it was also printed on postcards and distributed around town for tourists.
When I spoke with Adriana, I asked her specifically about how this style of infographics is used by the businesses that hire her. She shared that “Hand-drawn infographics work best when a brand wants to connect on a human level, not just push information. They’re perfect for topics that might otherwise feel dry or overly technical, because the hand-drawn style instantly makes things feel approachable and authentic.”
I asked whether she saw a trend in which types of clients asked for creative infographics. Turns out she’s actually created this type of infographic for clients across several industries like tech and finance, as well as culture and sustainability projects. She found that the common thread wasn’t the industry, it was the intent: they wanted to communicate in a way that felt human, not corporate.
Over time, she discovered that these illustrations were used for internal communication, educational content, social media storytelling, and even event visuals or explainer campaigns. Her deduction is that they’re used wherever businesses want people to actually enjoy looking at the information, not just skim through it.
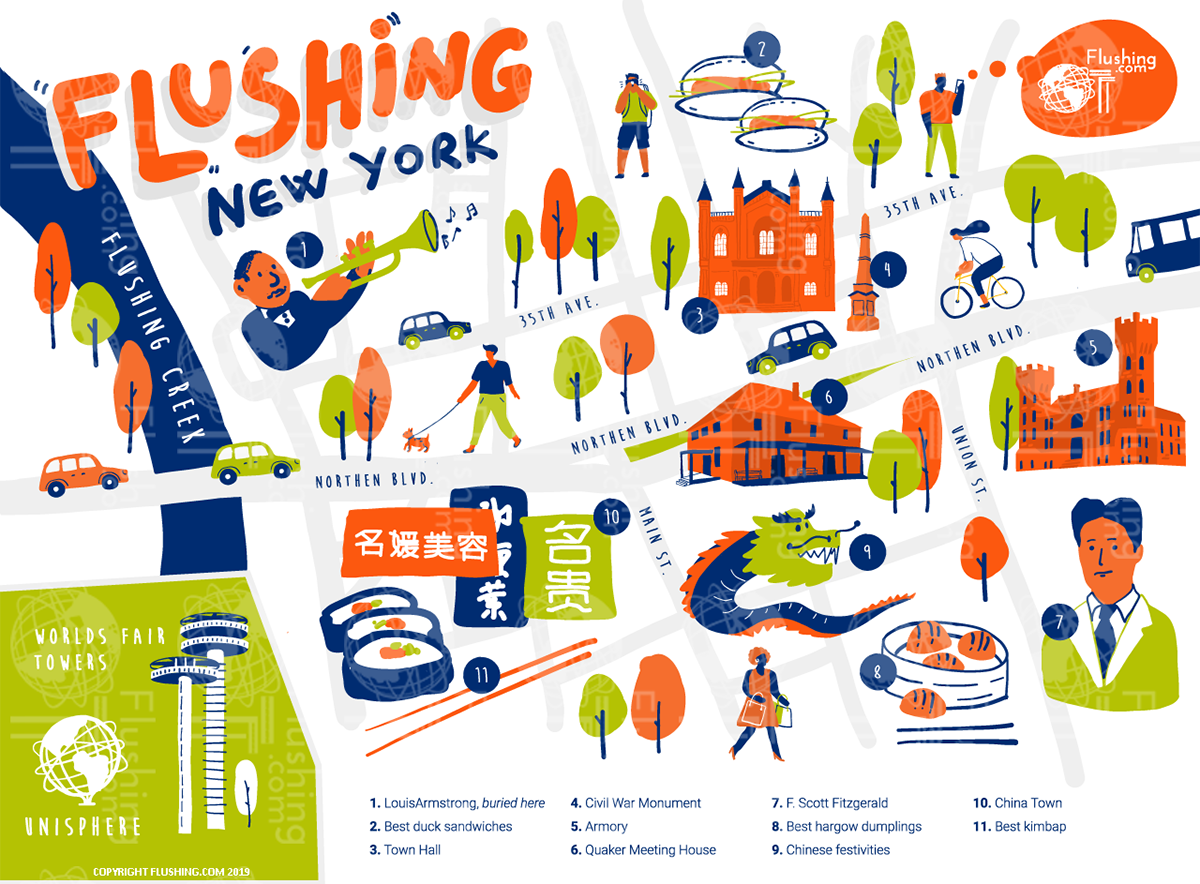
Source: Adriana Danaila
We’ve looked at the possibilities of infographics in marketing, how to create a campaign and some real-life examples. Now it’s time to talk about how sharing your infographics is also a part of the puzzle.
We touched on this a bit in the how-to section, where I talked about distribution. But sharing goes beyond that into other realms, both digital and physical.
So, aside from blog posts, newsletters, social media and print, you also have the following options for sharing your infographic to a wider audience:
Rachita Chettri, co-founder and media expert at Linkible, has learned how to best share their infographics through trial and error. “At Linkible, instead of mass posting to all contributors, we focus on industry-specific publishers and influencers. A well-placed infographic in a niche LinkedIn group or professional newsletter does much better than a general social posting.”
As you have likely noticed, marketing your infographics takes several steps and can take many directions. Thankfully, there are resources that can help make it easier. I specifically mean AI and design tools with features designed especially for infographic creation.
Save time during the beginning stages of your infographic marketing campaign. We don’t suggest using AI to generate your final design; it’s not good enough for that yet. Maybe it will be in the future.
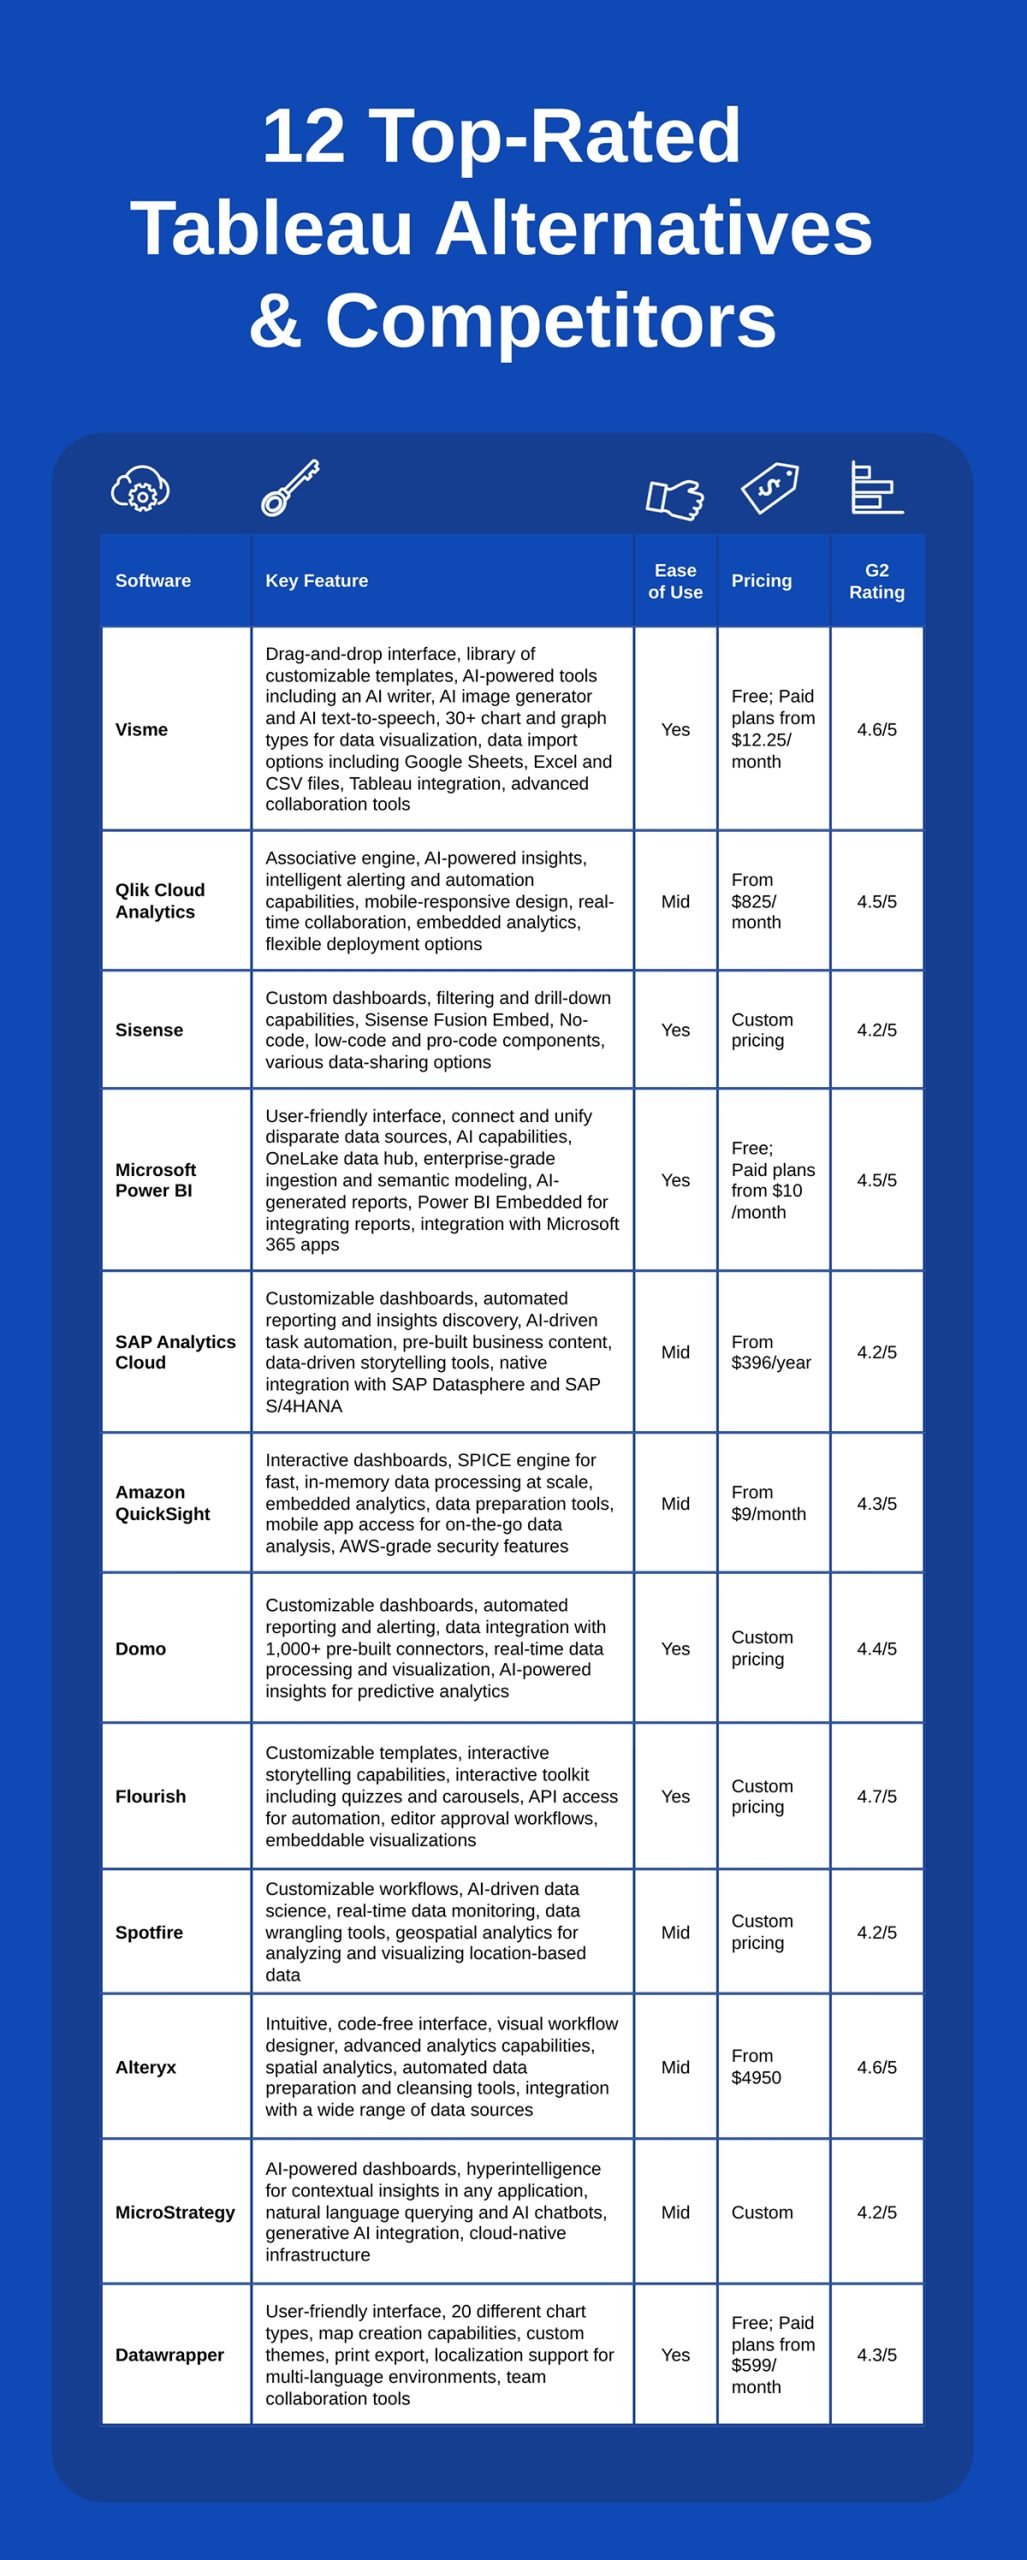
Below is a list of the best tools for your infographic marketing efforts.
*Disclaimer: The comparisons and competitor ratings presented in this article are based on features available as of November 6, 2025. We conduct thorough research and draw on both first-hand experience and reputable sources to provide reliable insights. However, as tools and technologies evolve, we recommend readers verify details and consider additional research to ensure the information meets their specific needs.
| Key Features | Pricing | G2 Rating | |
| Visme | Drag-and-drop editor, AI tools, interactive & animation features, data visualization tools, brand wizard, templates library, embedded media, collaboration & workflow tools, analytics, SCORM & xAPI export. | Free plan available; paid plans start at $12.25/month | 4.5 / 5 (450+ Reviews) |
| Venngage | Infographic templates, drag-and-drop editor, icon & stock photo library, AI text-to-design, real-time collaboration, branding tools | Free plan available; paid plans start at $10/month | 4.7 / 5 (120+ Reviews) |
| Canva | Low learning curve, AI infographic generator and editor | Free plan available; paid plans start at $15/month | 4.7 / 5 (6080+ Reviews) |
| Piktochart | User-friendly with an intuitive interface, AI infographic generator, Charts & graphs, templates, AI tools, design elements and collaboration tools | Free plan available; paid plans start at $14/month | 4.4 / 5 (160+ Reviews) |
| VistaCreate | Standard editor with simple features, AI image generator included | Free plan available; paid plans start at $10/month | 4.5 / 5 (170+ Reviews) |
| Infogram | Simple editor, templates, AI infographic generator, design assets. | Free plan available; paid plans start at $19/month | 4.7 / 5 (180+ Reviews) |
| Genially | User-friendly but with a learning curve, AI voiceovers, image generator, translations, text editor | Free plan available; paid plans start at $10/month | 4.7 / 5 (55+ Reviews) |
Infographic marketing has grown more prevalent over time and it’s undeniable that it will keep going. If I were to list all the directions that infographic marketing will go towards in 2026 and beyond, I’d have to write another article entirely.
So, to give you a little sneak peek, here are two predictions you can look forward to right now.
Generative AI gets better every day and that includes creating infographics. Tools like Visme continually improve their AI tools. Venngage and Piktochart already have this feature and work quite well.
The fact that Coursera now offers a course on creating infographics with GenAI for marketing is proof that this is evolving into something much bigger.
Pretty soon, you’ll be able to create almost-ready infographics that you’ll only need to tweak a tiny bit before they’re ready to use.
On top of that, social media and other marketing tools are also incorporating AI for social listening, content generation, analytics and much more. Incorporating infographics into your marketing strategies will only make them more powerful, thanks to AI.
With mobile devices accounting for 63% of global website traffic in Q1 2025, the future of infographic marketing is definitely mobile-first. Traditional vertical infographics were always somewhat mobile-compatible, but the next generation of infographic marketing will be designed for the mobile experience from the ground up.
One of the most important design techniques that will change the way we create mobile infographics marketing assets is thumb-optimized interactive elements. This means larger tap targets, gesture-based navigation (swipe, pinch, drag), and interface elements positioned within easy thumb reach.
While there are actually 10+ infographic types, the four most commonly used for marketing are:
Every effective infographic includes these five core elements:
A complete infographic typically includes:
The specific elements will vary based on infographic type and distribution channel. A social media infographic might skip some text to prioritize visual impact, while a blog post infographic might include more context.
Creating an effective infographic requires both strategy and design:
Read our complete guide on how to make an infographic for detailed instructions and examples.
See 100+ best infographic examples across different industries and use cases.
The main purpose of an infographic is to communicate complex information quickly and memorably through visual design.
Specific marketing purposes include:
Remember those infographic marketer types? You have to be both.
As Jin Grey, SEO expert, says, "Good design should educate and sell at the same time."
Your infographic needs to look good enough to stop the scroll. But also be strategic enough to turn that stop into a decision.
But a beautiful design with no distribution strategy will sit in your content library gathering dust. And a smart distribution of bad design gets ignored before it can do its job.
Use Visme and all our practical design features to build infographics that do both.
Then, using our editors and the AI Resize tool, turn them into carousel slides, email headers, Pinterest pins, sales comparisons, lead magnets and social snippets.
Put them everywhere your audience makes decisions, like by sharing directly on social media from the Visme social media calendar. Track what works. Do more of that.
The marketers driving real results from infographics aren't choosing between design and strategy. They're fueling both.
Take advantage of all Visme's features and start creating infographics that boost your ROI.
Design visual brand experiences for your business whether you are a seasoned designer or a total novice.
Try Visme for free


![How to Make an Interactive Infographic [+Templates]](https://visme.co/blog/wp-content/uploads/2023/11/How-to-Make-an-Interactive-Infographic-Quick-Guide-8-Customizable-Templates-Thumbnail.jpg)


