


Typography Infographics: 12 Inspiring Examples & Techniques


There’s a reason top-ranking websites keep investing in visual content like infographics that people want to link to and share.
Studies show they generate a staggering 178% more inbound links than text-only content and it’s easy to see why.
They’re visually engaging, simplify complex ideas and are infinitely more shareable than walls of text.
Year after year, we hear that “infographics are dead” and that marketers should move on to other link-building tactics. Yet, time and again, the data proves them wrong.
This strategy has never really died; it just evolved.
Despite shifting algorithms, changing content formats and evolving search trends, infographic link building remains one of the most reliable ways to earn backlinks and boost domain authority.
It continues to stand out because visuals naturally attract attention and make your content far more engaging, not just for your audience, but for publishers looking to share valuable resources.
That said, infographics aren’t a magic shortcut. You could spend hours designing a gorgeous visual only for it to sit unnoticed, unshared and unlinked.
In this guide, we’ll break down a practical and proven approach to infographic link building. You’ll learn how to create, promote and position your infographics so they actually earn backlinks and elevate your site’s authority.
Infographic link building is a strategy where you create and distribute visually engaging infographics to earn backlinks.
Each backlink earned through these shares signals to Google that your website is credible and authoritative within its niche.
Here’s an image that shows how infographic link building works.
Made with Visme Infographic Maker
Infographic link building comes with lots of perks.
Here are some of them:
There are many types of infographics designed for different purposes.
The table below outlines the seven main types, explaining what each one is and when it’s best used.
| Type of Infographic | What It Is | When to Use It |
| Statistical or Data Infographics | Visual representation of data that turns complex numbers into easy-to-understand charts, graphs and visuals | Presenting research findings, survey results or performance metrics |
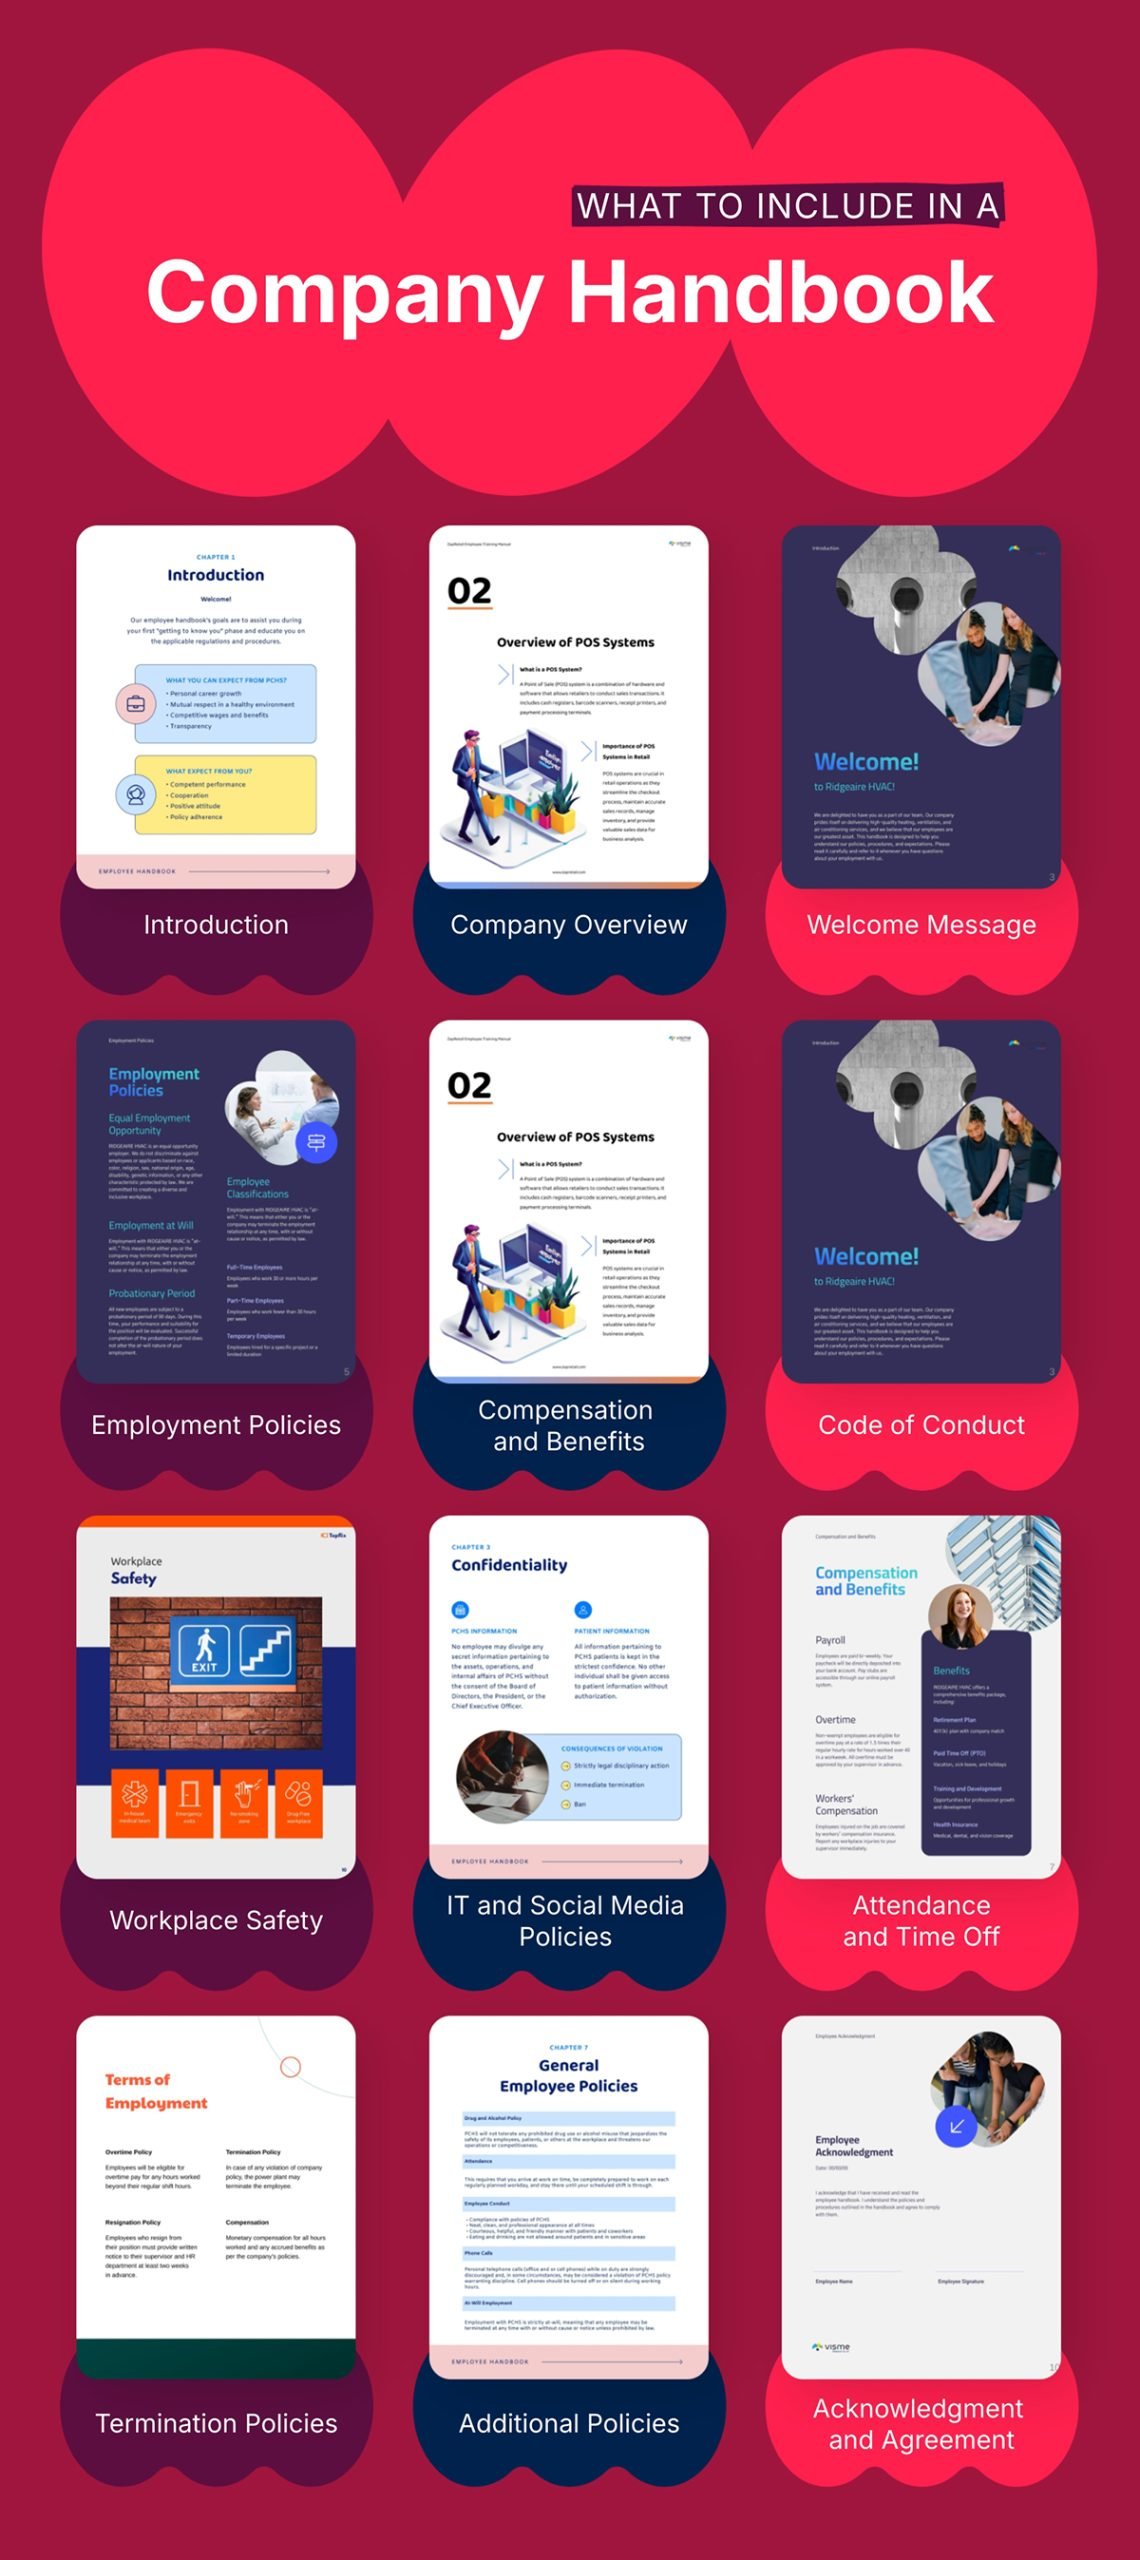
| Informational Infographic | Text-focused infographic that summarizes detailed content into concise, digestible key points | For simplifying long-form content like reports, guides or white papers for quick understanding |
| Timeline Infographic | Chronological visual showing events, milestones or growth over time | When you need to highlight progression, history, evolution or project roadmap |
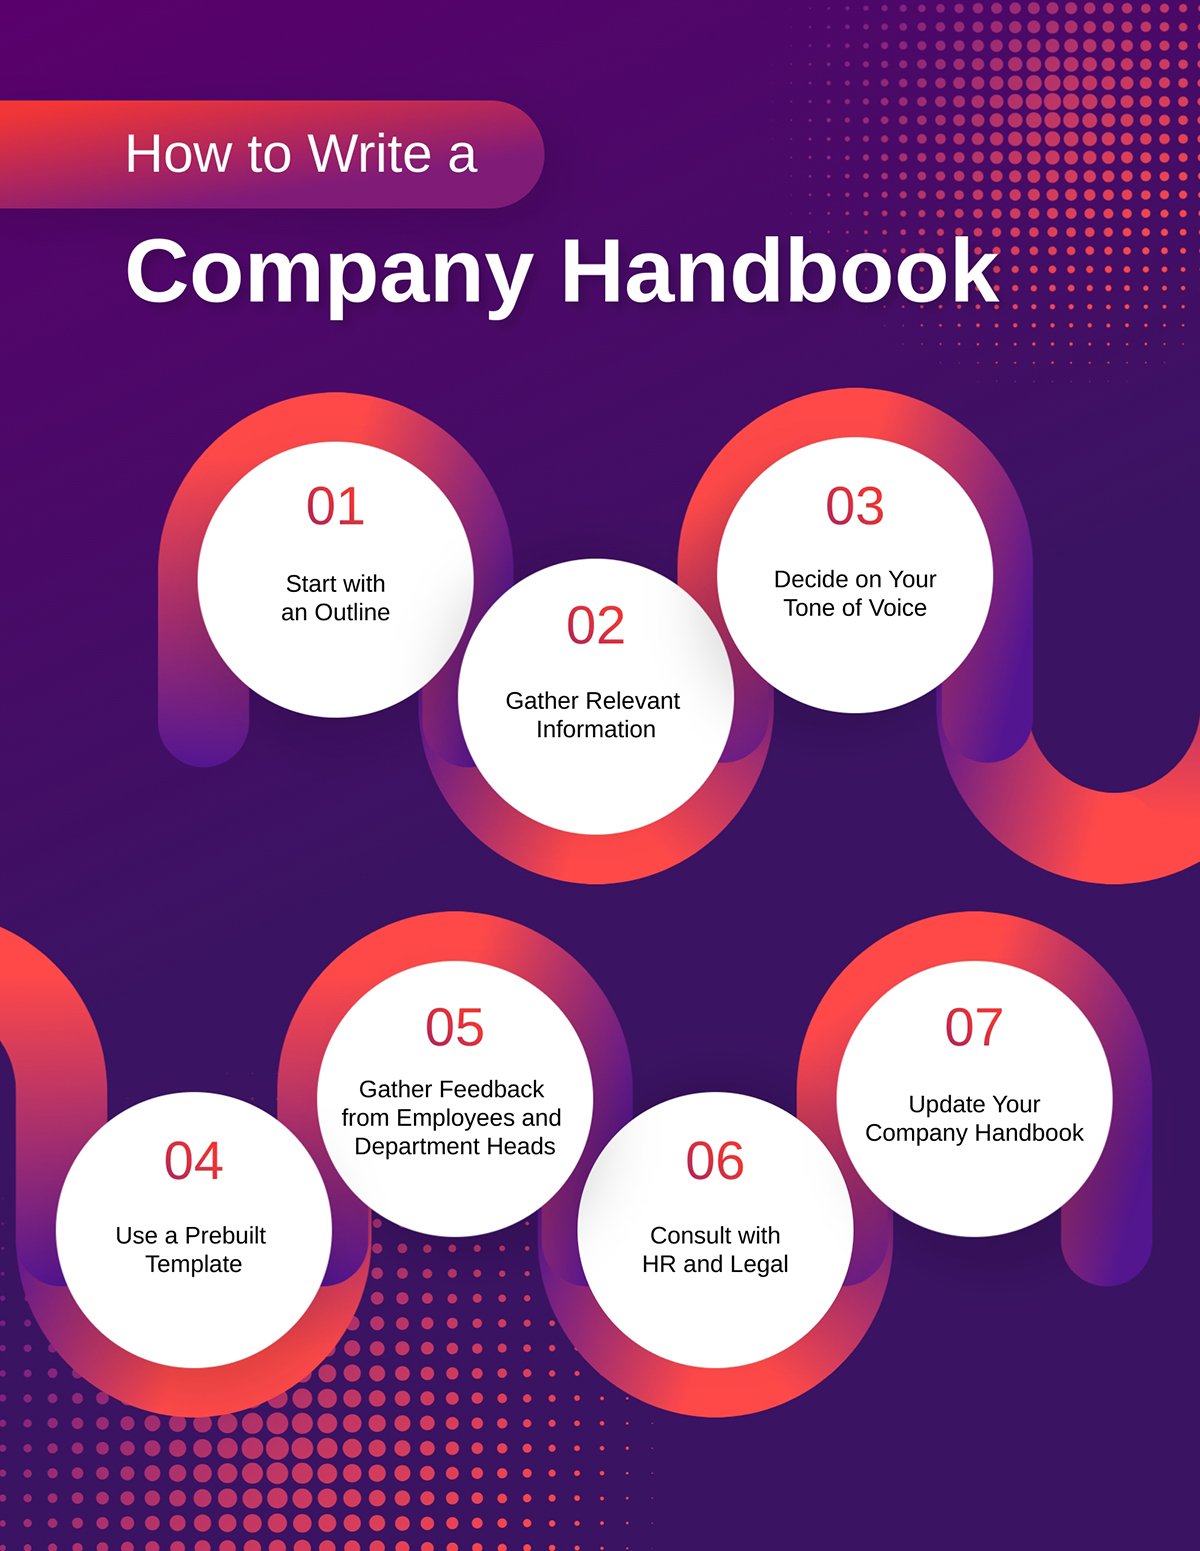
| How-to Infographic | Step-by-step visual guide that explains how to complete a process or solve a problem. | To teach, instruct or simplify procedures and make them easier to follow |
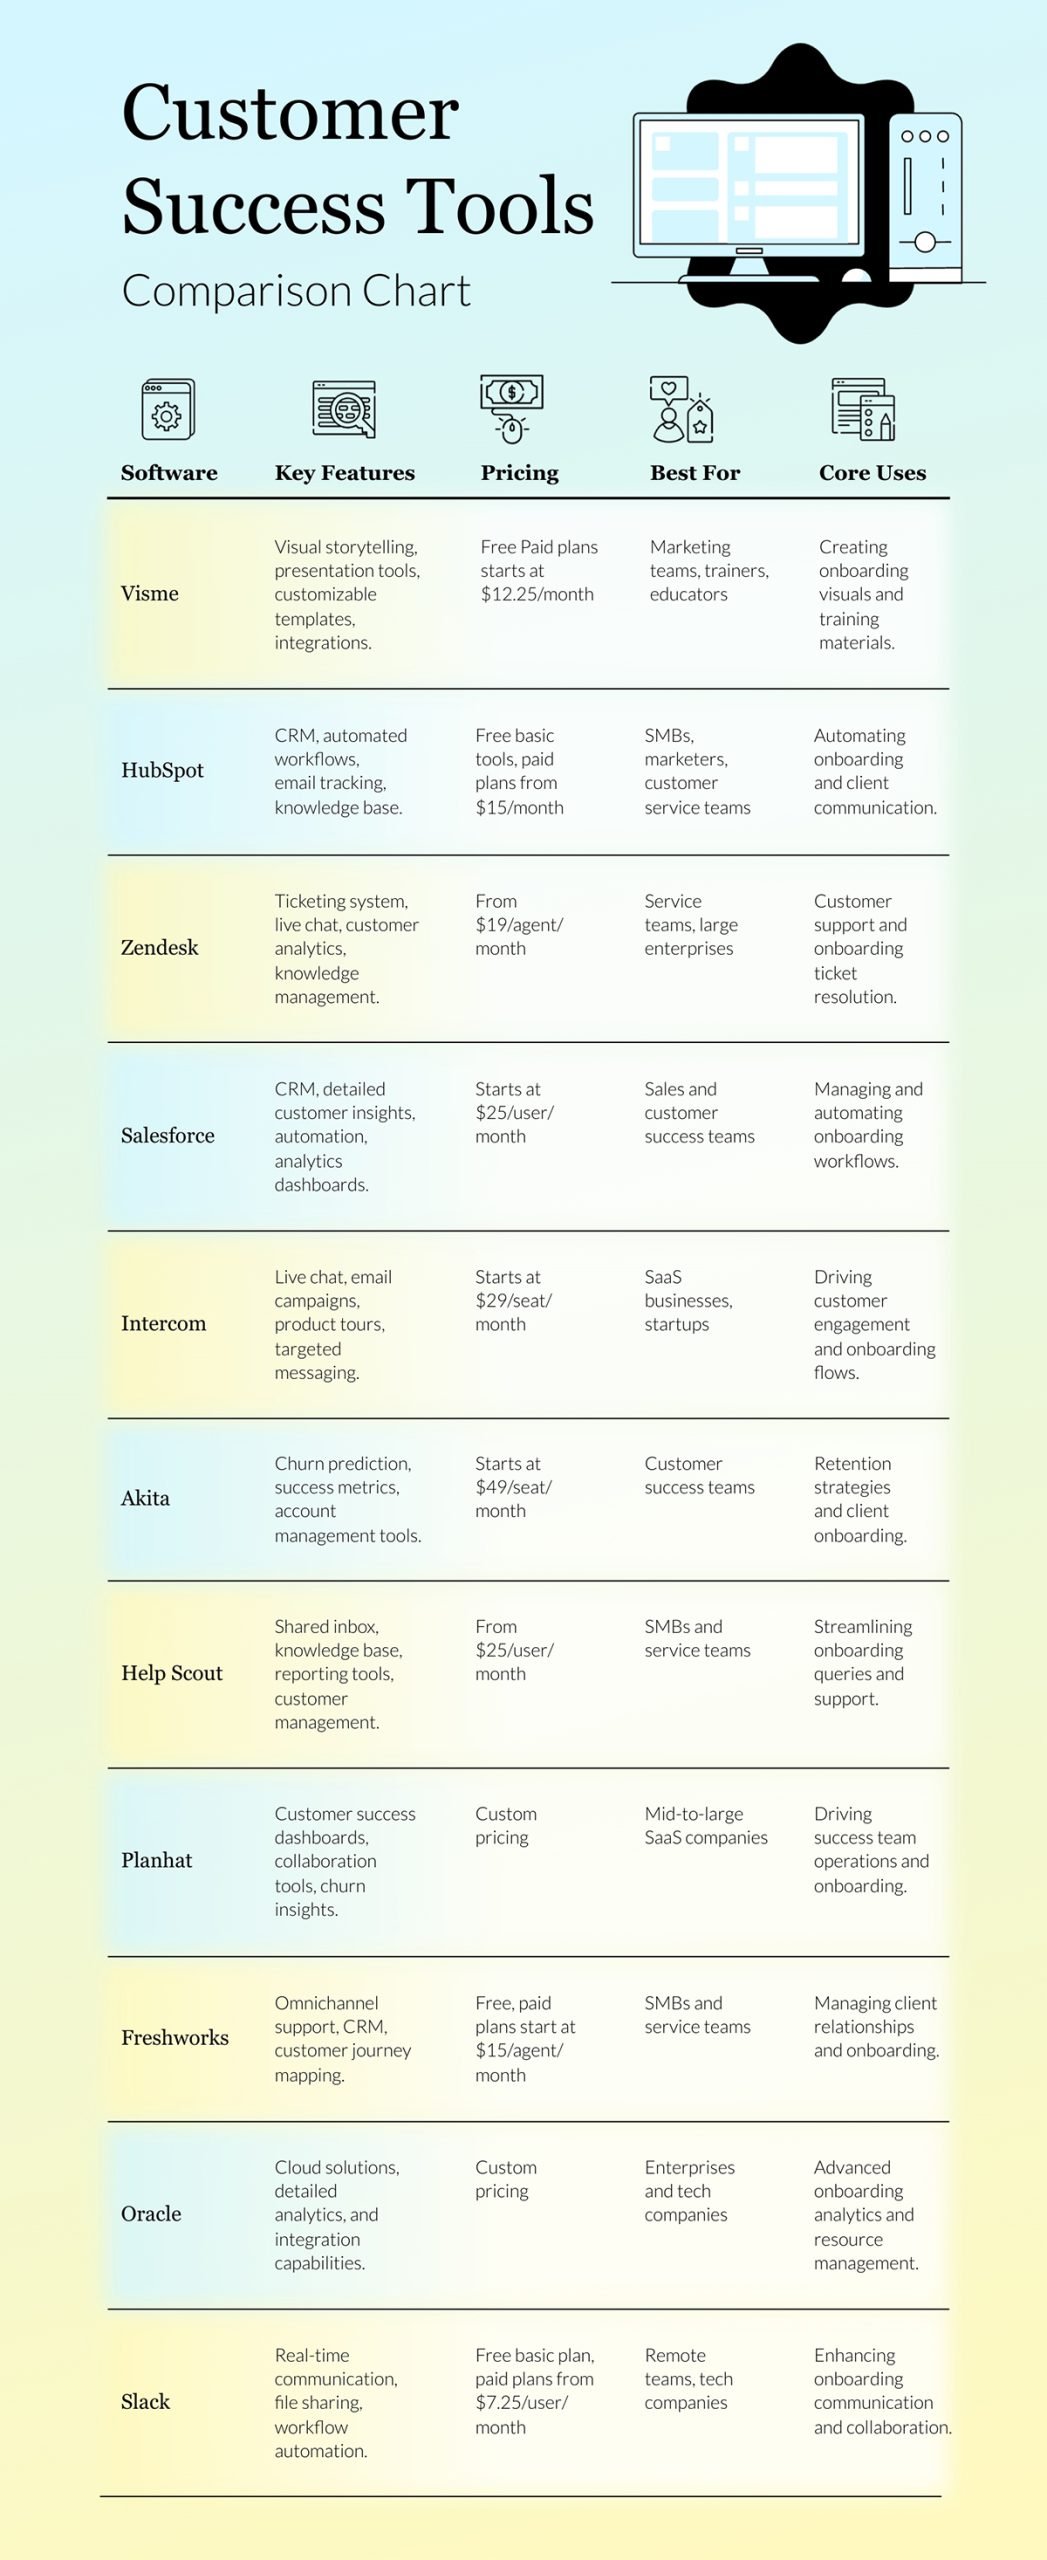
| Comparison Infographic | Side-by-side layout that highlights differences or similarities between two or more items | Comparing products, ideas, regions or pros and cons to help audiences make informed choices |
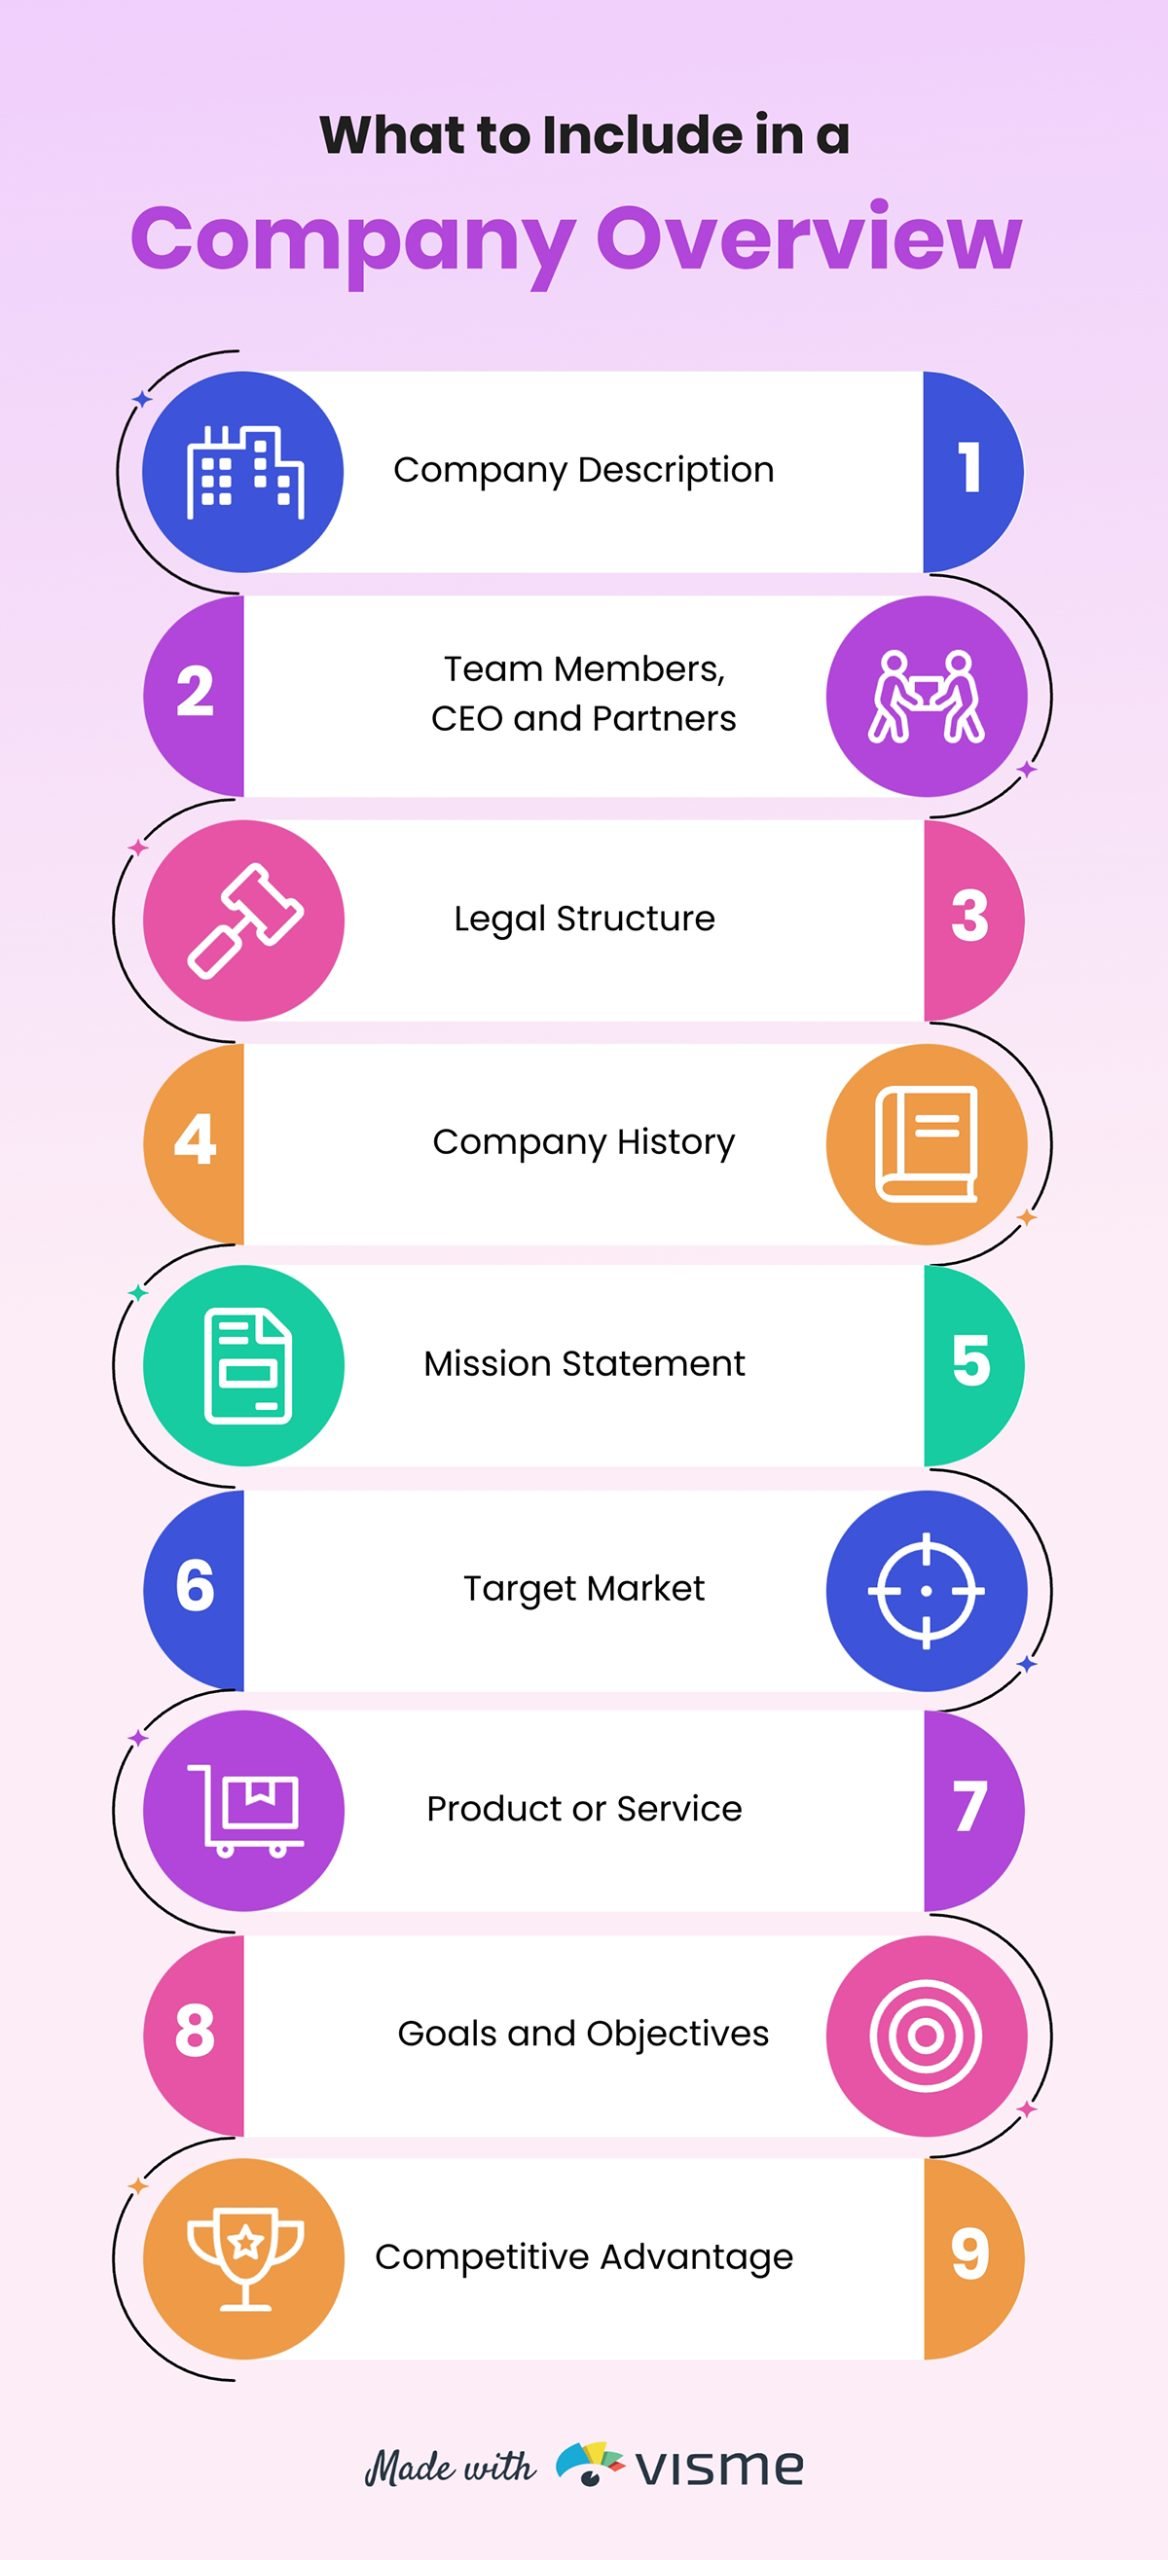
| List Infographic | Structured layout that organizes information into lists, tips or checklists with icons or visuals | Sharing short, skimmable content like tips, tools or key takeaways in a visually engaging way. |
| Anatomical Infographic | Detailed breakdown of a concept, system or object into labeled parts that explain how it works | Explaining the components of something such as a product, tool or creative process. |
Now, let’s explore each type of infographic along with customizable infographic template examples you can quickly use to create yours:
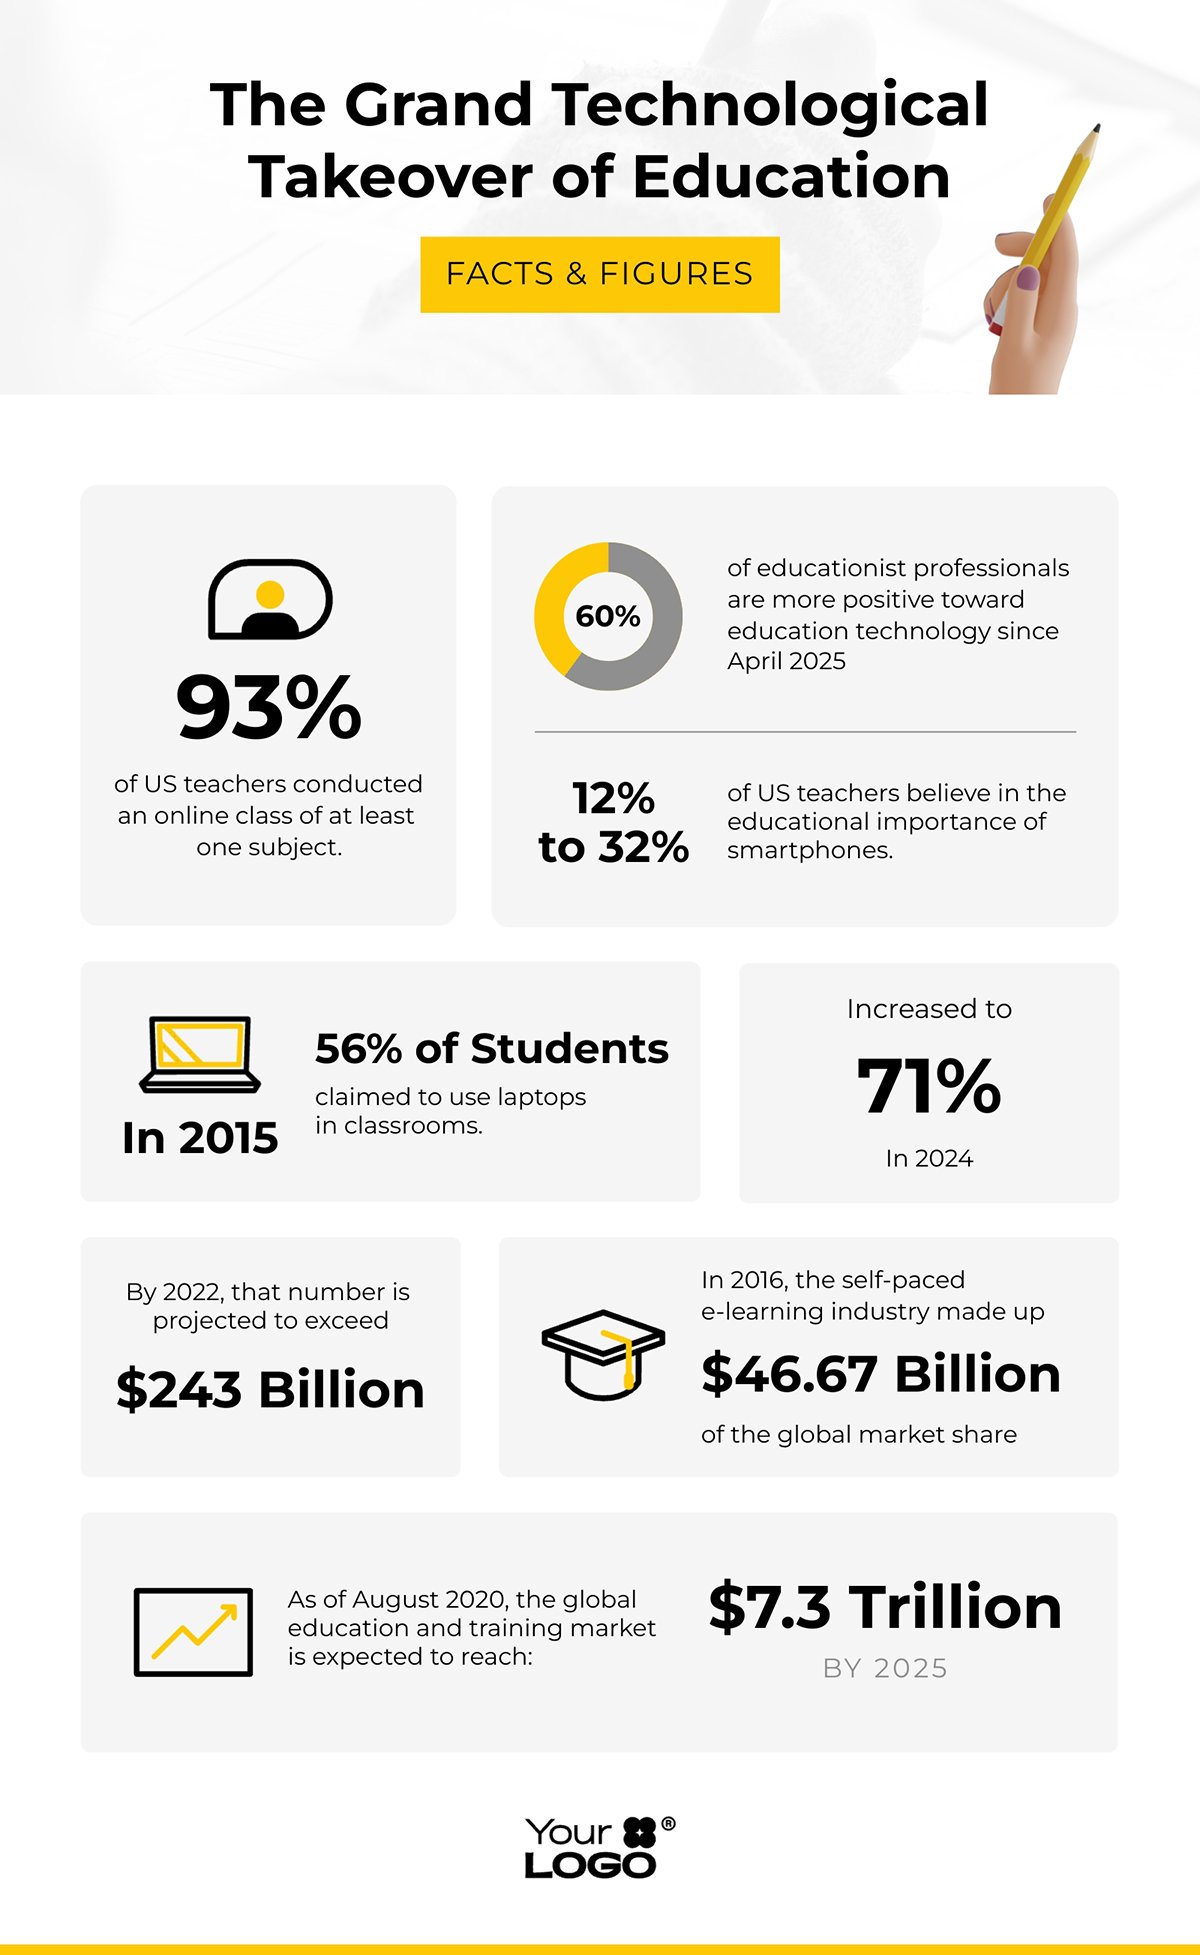
Best for: Presenting research findings, survey results and data analysis.
When it becomes overwhelming to present raw data, you can use statistical infographics to turn it into visuals that are easy to understand at a glance. With charts, graphs and visual patterns, your audience can quickly identify the key insights of your data.
Want to see a good example? Check out this easily customizable statistical infographic template.
Best for: Summarizing word-heavy content such as guides, reports, blog posts, eBooks or white papers.
If you need to turn your long-form content into concise, easy-to-read visuals, then informational infographics are your go-to.
These types of infographics come with a text-focused layout that highlights the important takeaways so readers can grasp essential information quickly.
Here’s an informational infographic that you can customize right away:
Best for: Showcasing events over time, illustrating growth, evolution, historical progression or milestones.
Timeline infographics help visualize how things change or progress. You can outline information chronologically so that it’s easier to understand development stages, historical trends or project roadmaps at a glance.
To create your own timeline infographic, you can use this template as your starting point.

Best for: Tutorials, product demonstrations and training materials.
How-to infographics break down complex procedures into clear, visual steps that are easy to follow. They are great resources for explaining a process or guiding users through a step-by-step solution.
Here’s a classic how-to infographic template that you can use to create yours.
Best for: Comparing products, services, regions, trends or pros and cons.
Comparison infographics present two or more items side by side, making differences and similarities instantly clear.
Whether it’s comparing your product features, before-and-after results of your product or competing tools, this layout will help your audience evaluate options and make decisions faster.
Use the template below as an inspiration to create your own comparison infographic.
Best for: Sharing tips, ideas, tools, stats, benefits or features.
List infographics use a vertical or grid layout to organize information into bullet points, numbered steps or checklists. They turn plain lists into engaging, skimmable visuals by incorporating icons, colors, shapes, numbers, illustrations and more.
This infographic template provides a good foundation for creating your own.
Best for: Breaking down an object, system or concept into its components and explaining how each part works.
Anatomical infographics dissect and label the internal structure of a concept, a product or even a creative process. They make complex systems easier to understand and help you connect the different parts of the process to the bigger picture.
You can easily personalize the anatomical infographic below to create yours.
If you want people to share your infographic and use it to build links for your SEO strategy, it needs to be compelling and well-designed.
Here’s a step-by-step look at how to plan and create an infographic that guarantees shares, boosts engagement and attracts links:
An awesome infographic starts with awesome content.
To increase your chances of getting picked up by popular bloggers and larger news outlets, create content that is completely original and never before seen.
But how do you get your hands on exclusive content? The best way to do this is to use your proprietary information or conduct your own poll or study.
Nayana Bhasurasen, Visme’s SEO Manager, explains this better:
“We need to find what’s trending in our niche and plan content that is linkable. Researching existing articles on trending topics will help us plan something both valuable and visually unique. Many brands create engaging content on their websites, but often overlook adding an infographic, which can make it easy for readers to understand the topic. Here lies an opportunity for us to create and promote an infographic.”
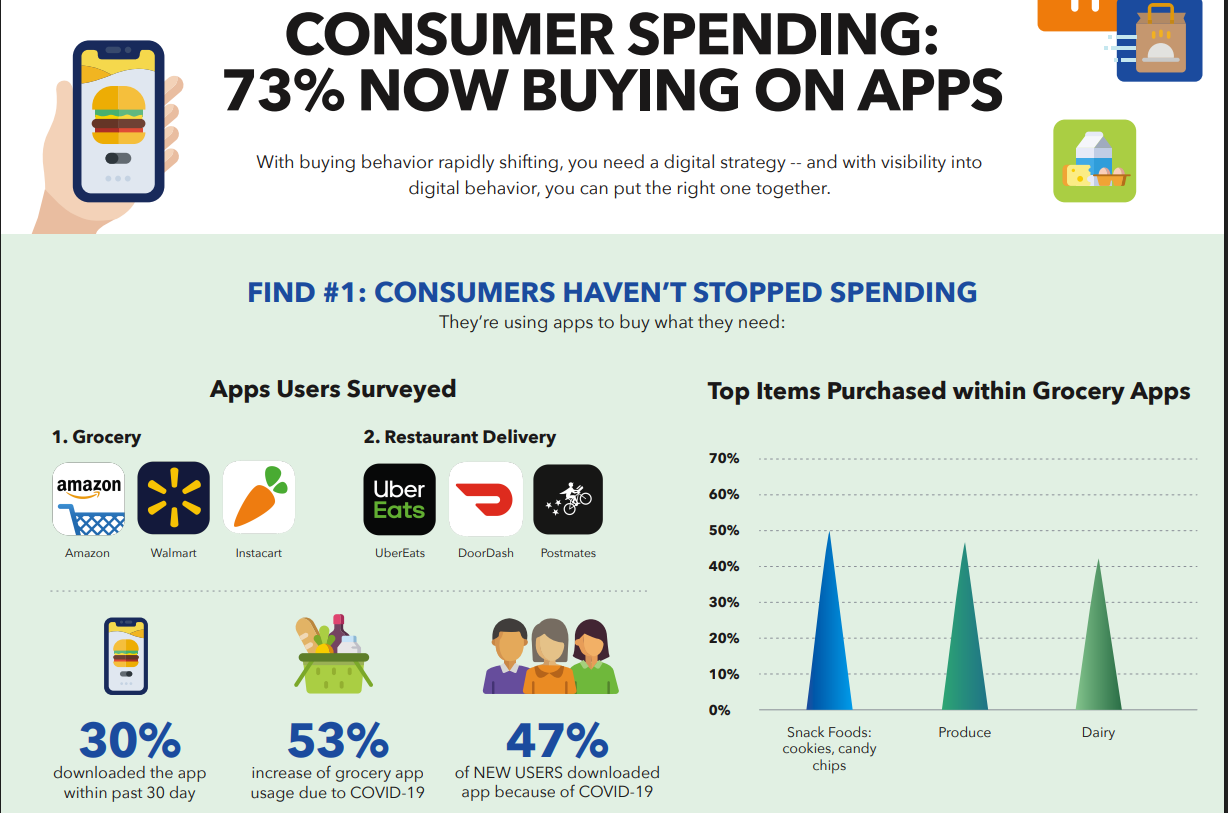
Check out this infographic example from MFour, a company that helps businesses access expert consumer insights and behavioral data.
Antonio Gabric, Outreach manager at Hunter.io, also added some insights based on his experience:
“We approach topic research much like keyword research — analyzing search volume and topical relevance. The higher the volume and competition, the better. That signals demand for content that stands out. One effective way to differentiate is through unique visuals, videos and rich, engaging assets.
In our niche, people often search for “cold email” and “email deliverability.” These are perfect opportunities to study existing infographics and spot content gaps we can fill. When we decide to create an infographic, we either dedicate a full article to it or embed it within an existing one that’s already performing well.”
Now, let’s explore some of these practical strategies to find your infographic topics:
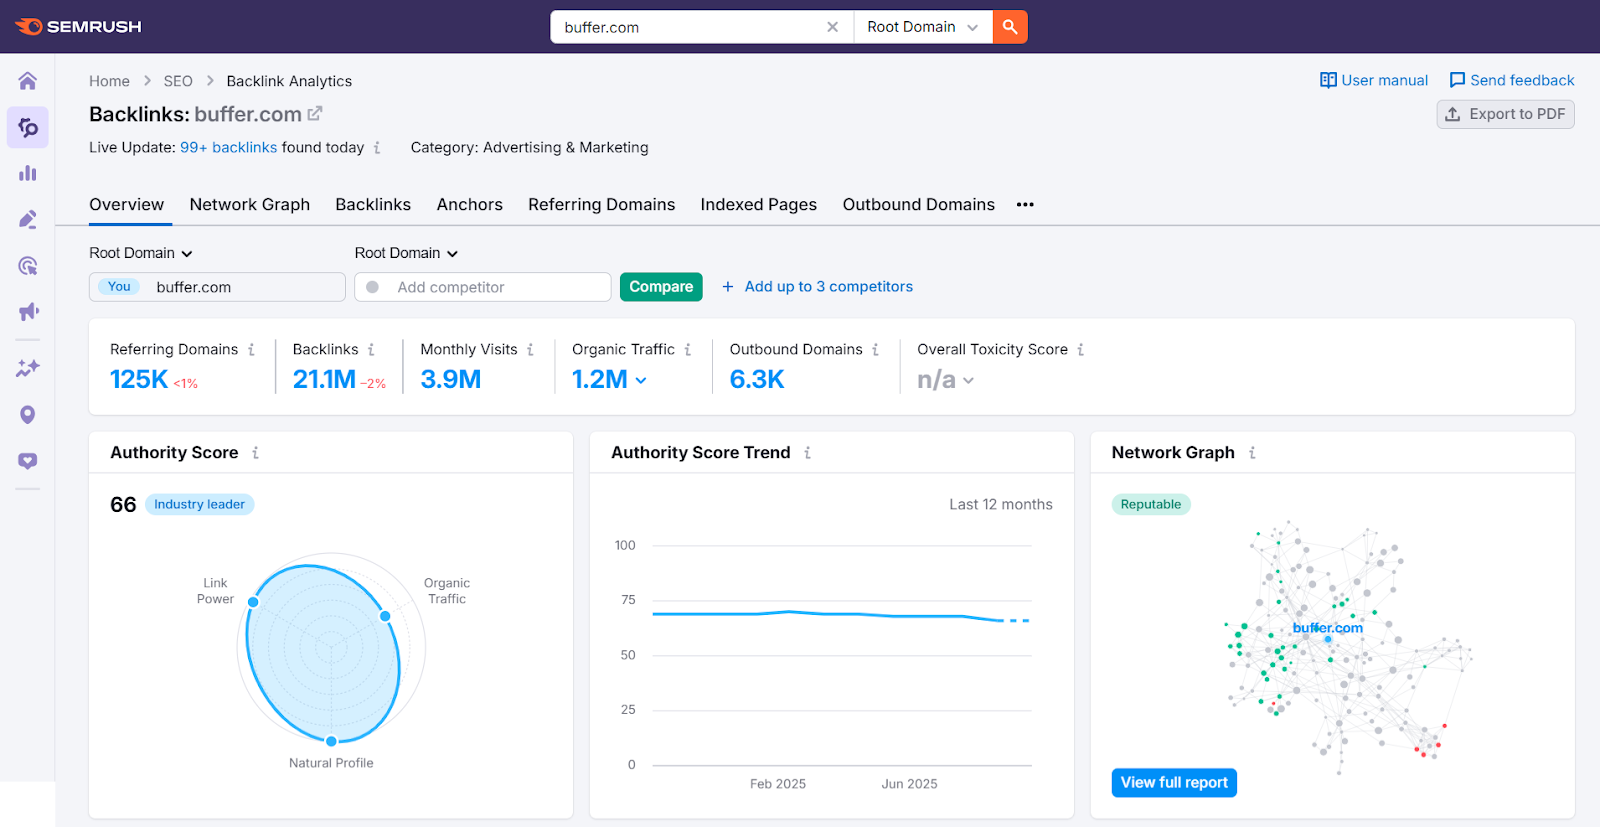
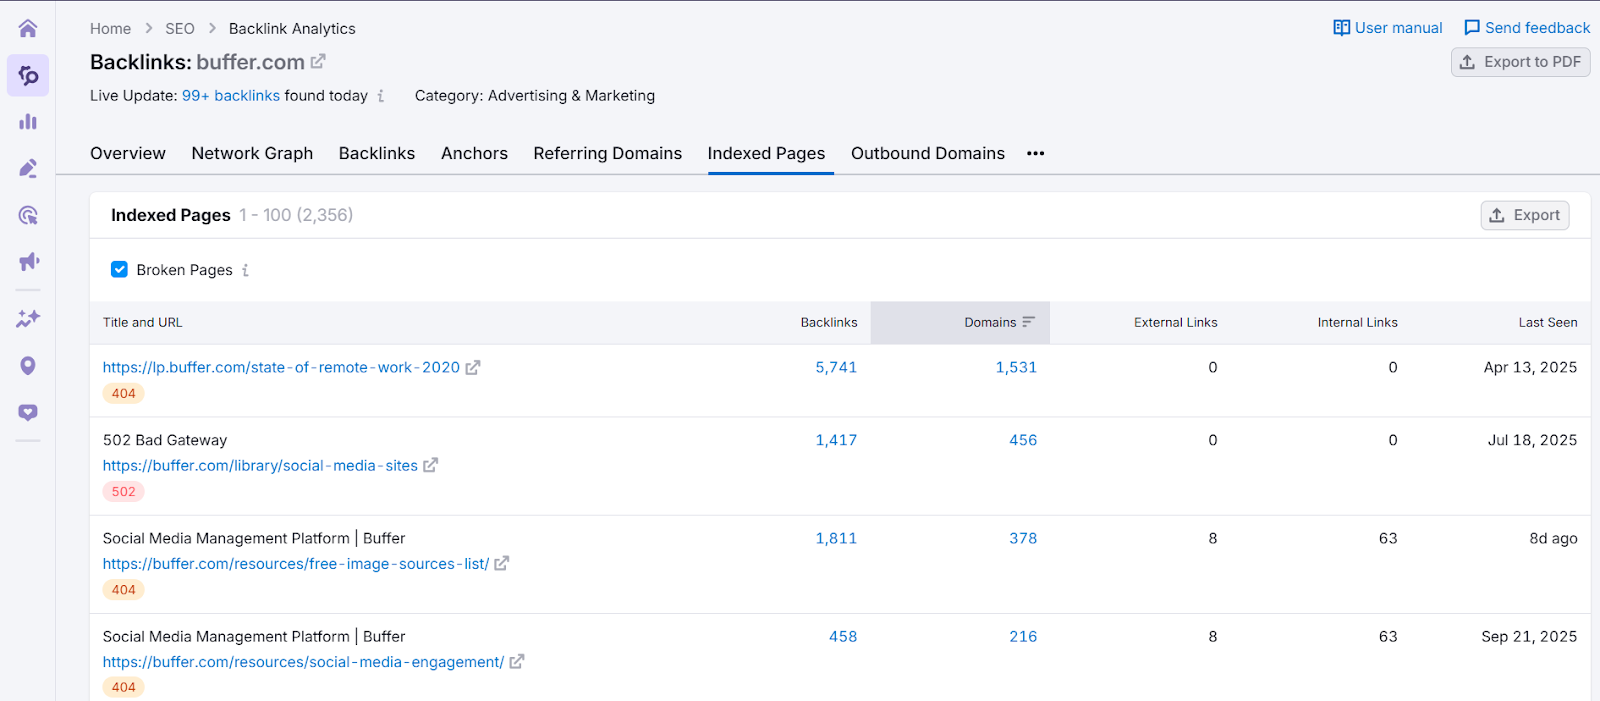
Here, you want to identify what types of infographics are already performing well in your niche. I used the SemRush tool for this guide.
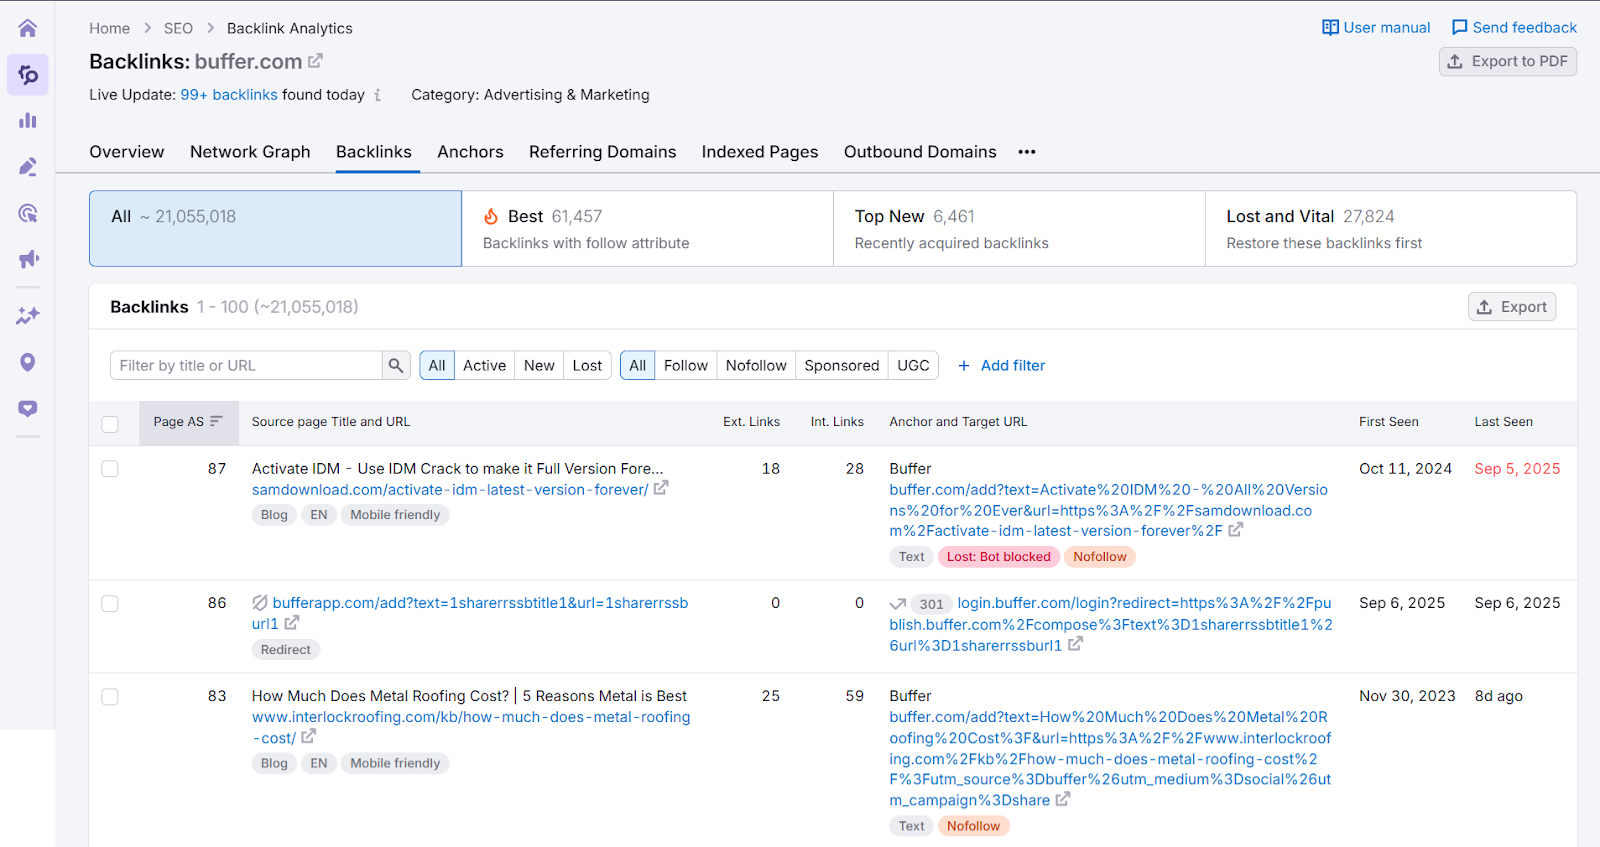
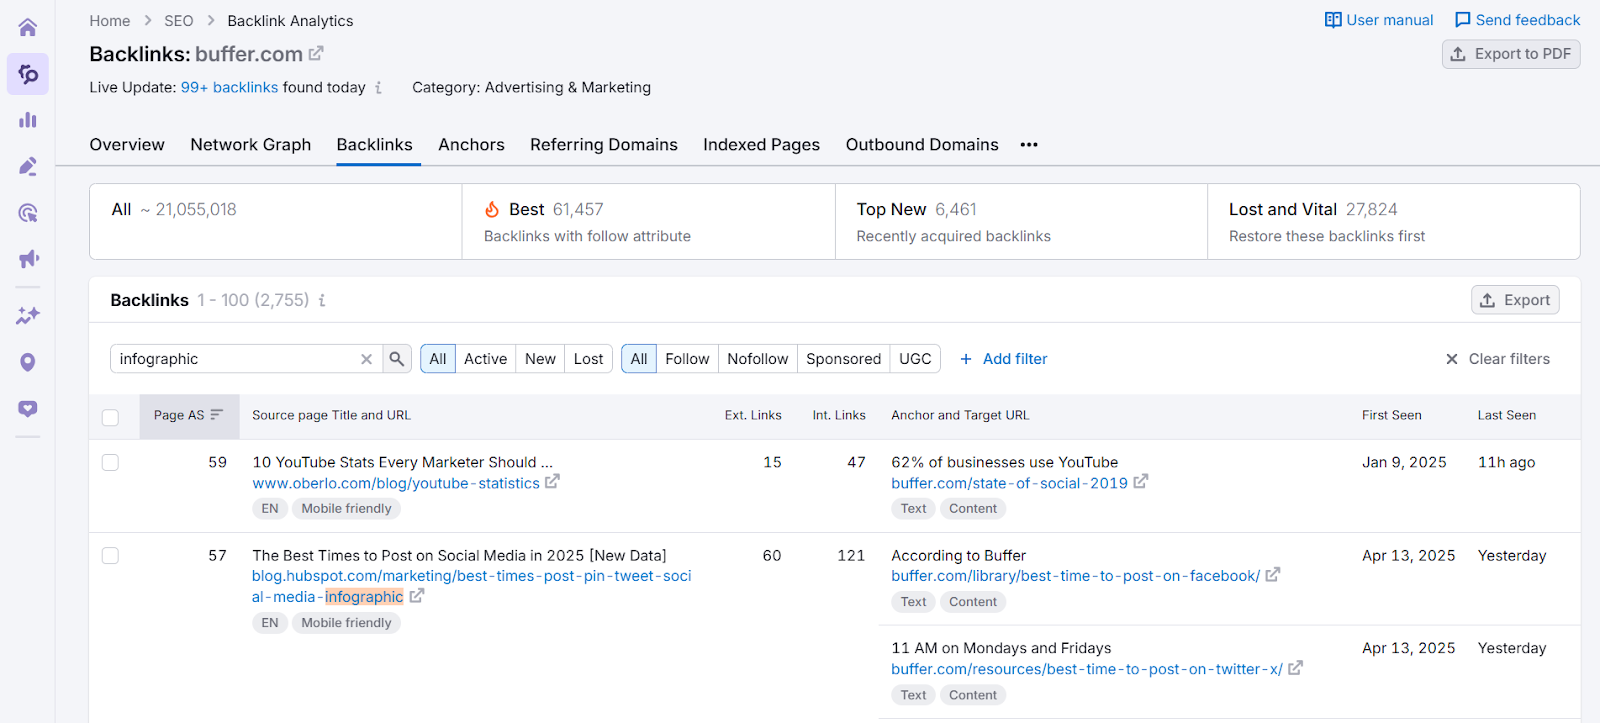
Bonus Tip: You can also use the Indexed Pages tab under Backlink Analytics to quickly see which of your competitors’ pages (including image assets) earn the most backlinks. Combine this with the keyword “infographic” to narrow it down.
Your research shouldn’t stop at existing infographics. Some of the best linkable infographics topics may come from other high-performing non-visual content.
Use your SEO tool to find the best-performing competitor’s pages that have earned the most backlinks — whether they’re articles, studies or visuals.
Look for:
These topics are proven link magnets. Turning them into visual summaries or infographic versions can give you an edge.
Example: If you find a competitor’s post titled “25 Stats About Remote Work in 2025” with 300 backlinks, you could create “The Remote Work Shift in 2026: Data, Insights and What’s Next [Infographic]”
Once you’ve identified the topic, you need to focus on filling existing gaps on that topic, whether that’s through fresh statistics, unique visual storytelling or original insights. This way, your infographic becomes more relevant and valuable.
The next step is to dive deep into research.
Your audience isn’t looking for recycled information; they want something fresh, credible and genuinely useful. This is where thorough, high-quality research makes all the difference.
When it comes to sourcing data, here’s what Nayana advises:
“Collecting our own data and sharing original research or survey content makes others more likely to use our infographic and cite our website. If we plan to include data already available on the web, we ensure we compile the scattered data into a single and simple infographic.
There are many ways to source data depending on the topic of your infographic, your industry and your goals. But here are a few ideas that’ll help whether you’re looking for existing or fresh data:
These include databases and websites where you can find original research and reports, such as:
Even small original datasets can make your infographic uniquely linkable because they offer insights no one else has published.
Here are a few ideas to get fresh data:
Weaving in expert perspectives or quotes into your infographic can improve its authority and credibility.
You can:
A powerful way to make your infographic creation process smoother and more effective is by using storyboards.
A storyboard allows you to organize and visualize your ideas before you dive into design.
You’ll see how your data, visuals and story connect, so the final piece looks organized and easy to follow.
Here’s a guide to creating your own infographic storyboard:
Once your storyboard is ready, you can move into the design phase. This is the most exciting part about creating an infographic, especially if you’re using a tool like Visme.
Follow the following steps to design your infographic:
With a tool like Visme, it’s easy to design a professional infographic, even if you’re not a designer. To get started, sign up or log in to your Visme account and create a new project.
You can choose to start your design from scratch or navigate to the Infographics section, where you’ll find hundreds of customizable templates designed for different topics, industries and goals. Browse through the options and pick a template that best fits your message and audience.
Once you’ve selected your template, open it in Visme’s drag-and-drop editor. From there, you can personalize every detail, adjust the layout, change colors and fonts, add your data and replace placeholder visuals with your own.
Ensure that your elements are organized in a logical flow, so readers can move naturally from one section to the next without confusion.
Stick to one dominant color and one or two complementary accents to maintain a cohesive and professional look.
Maintain visual contrast to improve readability. Use light text on dark backgrounds (or vice versa). Avoid using too many bright or clashing shades, as they can distract from your message.
Choose one or two clean, legible fonts that align with your brand personality. Use one for headings and another for body text and apply them consistently throughout the design.
If you want your infographics to stay on brand, use Visme Brand Kit. Simply enter your website URL and the tool will automatically pull in your brand logo, fonts and color palette.
To improve visual appeal and engagement, explore Visme’s extensive library of stock images, icons, illustrations and 3D graphics.
You can also upload your own visuals or enhance them with the AI image editor or generate entirely new images using the AI image generator.
Need to turn data into visuals? Visme provides over 20 types of charts, graphs and maps, along with more than 30 widgets, tables and data visualizations to help you present complex insights in a simple, engaging way.
If you’re designing a digital infographic and want to add interactive elements, Visme lets you add pop-ups, buttons, transitions and animated characters.
Alex, Visme’s Design Manager, shares some insights on how to make your infographic interactive in Visme:
“One of the most underrated tools in Visme is in the "Actions" panel. There is also a section where you can link a specific slide to specific objects/elements in your design (when you preview your project, you can click on that object and it will take you to that particular slide) and finally there is a "Hotspot" section which gives you the option to create pop-ups. You can link elements and have them appear on hover or click. This feature can also link audio and video, which you can record as you are designing if necessary. With Visme, the options are endless; you just have to take the time to really think and get creative with these, too.”

If you want to learn more about how to create infographics for marketing, check out this video:
The truth is, bloggers, journalists and website owners are busy; if embedding your infographic takes more than a couple of clicks, they’ll probably skip it.
Here’s what Isaac, Marketing Director at 3wh, recommends:
“Design it for easy copy-and-credit, using one headline figure per panel and make the infographic landscape 1200 × 675 px with a discreet ‘Source: Brand.com’ footer so even lazy embeds will send a link.”
In other words, make sharing a no-brainer. You can place a little box right below your infographic with a simple HTML code anyone can copy and paste into their site.
In Visme, you can easily generate embed links via URL, HTML or iframe. Visme also lets you download your design in various formats, including HTML5, PDF, PNG, PPTX, video, GIF and even print-ready files.
Optimizing your infographic for SEO ensures that both users and search engines can find it easily. Here’s how to do it:
Before uploading your infographic, rename the image file to include your primary keyword and describe the content. For example: (remote-work-statistics-2025-infographic.png)
Search engines can’t “see” images, but they can read alt text, which describes what the image shows.
Add a short, descriptive sentence that includes your target keyword naturally.
For example: Infographic showing key remote work statistics for 2025, including global adoption rates, productivity trends and employee satisfaction levels.”
This improves visibility in image search results and enhances accessibility for visually impaired readers.
If you’re using Visme, you can easily rename your file and add alt text using its built-in accessibility tools.
Now we’re getting to the good part. Here’s what you’ve all been waiting for—how to build links with your newly designed infographic.
Let’s jump into our step-by-step guide on promotion and infographic link building.
First things first, you need to publish your infographic so that other bloggers and creators have a place to link back to. The best way to do this is by creating a new page or blog post on your website to house your information.
If you take a look at our Game of Thrones post, where we published three different infographics, we also include a written narrative that explains our thought processes when finding and creating these infographics.
This is the perfect example to emulate in your own infographic publication. You don’t want to share the infographic by itself.
First of all, Google wants to see some text within a web page or blog post. While the search engine might say that word count is not a factor, it’s plain to see that longer pieces of content tend to rank higher.
While a higher word count is by no means indicative of quality content, there does seem to be a correlation between the two.
A good strategy is to publish a new post with your infographic, some copy explaining your process and your findings within the infographic, alongside an embed code to make it easy for others to share your infographic.
Last, but not least, end your blog post with a call-to-action, asking your reader to share the infographic on their site. While this isn’t a guarantee, it will help increase shares better than ending without a CTA.
The next big question is: How will you get your infographic in front of the right audience and attract the links?
Focusing solely on organic link acquisition can take months and might not be effective at all if you don’t have a strong DR (Domain rating).
One of the most effective ways to promote your infographic and earn quality backlinks is through targeted email outreach.
Instead of waiting for people to discover your content organically, this approach helps you connect directly with bloggers, journalists, content managers and more who need your infographic.
Nayana Visme’s SEO Manager, affirms this below:
“I would prefer direct email outreach. As we already do research on the available articles on reputable sites during the planning stage, we can have a list of the articles without an infographic and directly reach out to them when our infographic is ready, to see if they are open to adding our infographic. This is one successful strategy I have executed for my old clients, as Content Managers are always looking to enhance their readers’ experience by providing engaging visuals.
The outreach should not be limited to those sites, though. We need to find all the sites that cover topics related to our infographic and this approach should include bloggers, journalists and industry writers who may find value in incorporating our visual content says Nayana.”
We’ve already seen how to research reputable websites that have published content related to your infographic during the planning phase.
Start by compiling that list, then follow the steps below to find more sites to pitch.
You can run targeted queries to uncover sites that:
Try search strings like:
Browse the first 3–5 pages of Google results and collect URLs of relevant sites in your spreadsheet or CRM.
You can also find broken infographic links that you can replace with your own.
Review the backlink sources pointing to those broken pages. If your infographic or resource fits the same topic, you can reach out to these referring sites and suggest your content as a replacement.
You don’t want to waste time sending outreach emails to sites that will not help your backlink profile. Qualify the sites based on the following:
Once reviewed, click Export in Semrush to download your backlink list. Import it into your spreadsheet or outreach CRM.
Once you’ve built your list of target websites, the next step is identifying the decision-makers—the people who have the authority to publish or embed your infographic. These are often content managers, editors or outreach coordinators who handle guest posts and external collaborations.
A tool like Respona will help you find verified email addresses and job titles associated with these contacts and automate the entire outreach.
You can also search each organization on LinkedIn to find the relevant ones and engage with their content before sending a message. This approach helps you warm up your prospects and build rapport before pitching your infographic.
However, while it’s personal, it’s also time-consuming, especially if you’re reaching out at scale.
Pro Tip: When you find multiple contacts for a site, prioritize the one most aligned with content or SEO. If you’re unsure, send a short, polite email asking who the best person is to contact about pitching your infographic.Now you need to craft personalized outreach emails that capture attention and clearly communicate the value of your infographic.
Your pitch should show genuine interest in your contact’s work and show why your infographic adds value to their audience.
Here’s what Nayana recommends:
“The subject line of your email should indicate that you are interested in visualizing their blog with an infographic. Avoid generic intros like “I thought you might like this.” Ensure you refer to their relevant article while sending the infographic design and explain how it adds value to their content or how it matters to them and their audience."
You can share one or two example blogs with infographics to show them how appealing it is when the content has an infographic. Keep the email simple and easy to read.
In addition to attaching the infographic, include a direct link to the file near the article link, giving recipients a convenient way to review and embed it. You can also offer the infographic embed code or an HTML snippet to make linking easier.”
Here’s a sample pitch that you can personalize:
Subject: Loved your post on [Topic] – Have an Idea That can get you 30% more traffic
Hey [Name],
I recently read your article on [specific topic or title] and loved how you broke down [mention something specific].
We just created a visual summary titled “[Infographic Title]”, which turns the latest [industry/statistics/trends] into an easy-to-digest visual your readers can quickly absorb and share.
It could be a perfect complement to your post — especially since it highlights [specific angle that connects to their article].
You can preview the infographic here: [link].
If you think this is a fit, you’re welcome to feature or embed it — here’s the ready-to-use HTML embed code.
Regards,
[Your Name]
One email isn’t often enough to get a response because inboxes are busy. Following up can be the difference between your pitch being ignored and getting featured on a high-authority site.
In fact, according to Belkins, the first follow-up email can increase reply rates by an impressive 49%.
However, avoid spamming your contacts with daily messages. Send at most 3-4 follow-ups, spacing them by 2–5 days. This gives them time to review your email and consider your request.
Social media is a powerful channel for promoting your infographics and earning backlinks, but you need to lead with value and not just promotions. Your posts should engage your audience and naturally lead them to explore the full infographic on your site.
You can repurpose your infographic into multiple, shareable assets that point back to your original post.
Use these tips to repurpose your infographic:
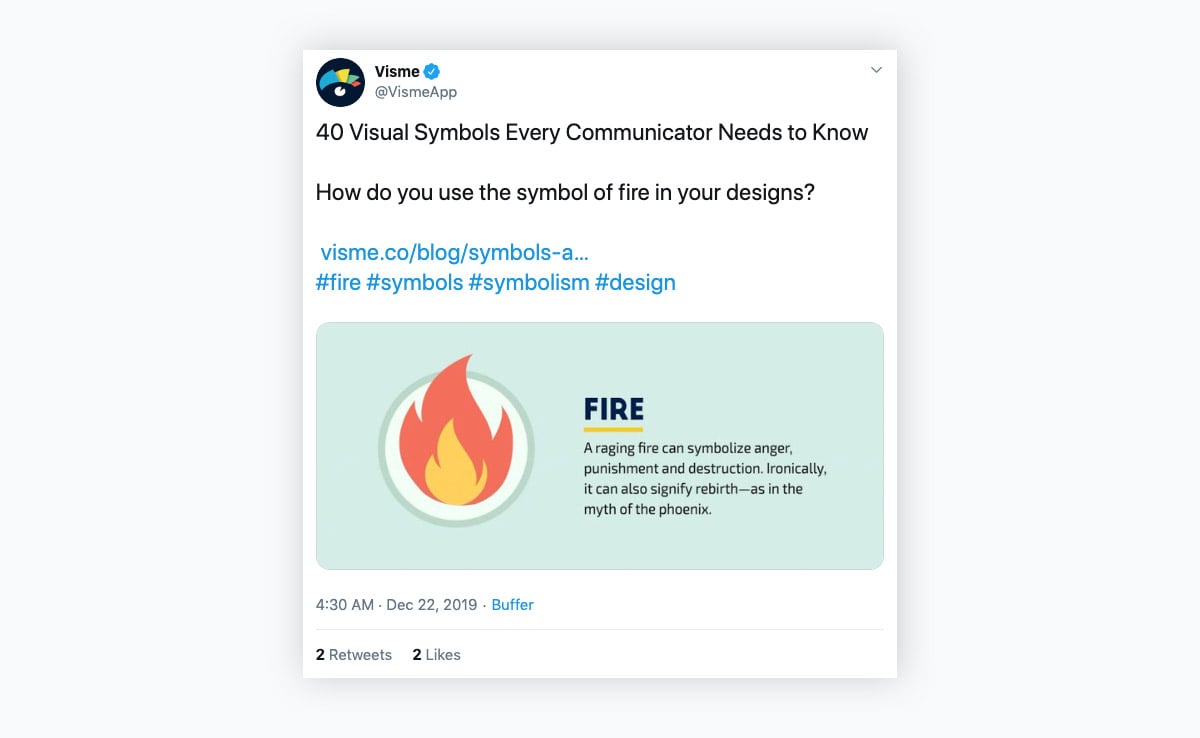
To get an idea of how you should design your ad, take a look at how we’ve shared a snippet of a much larger post and infographic on our X(Twitter).
This is a great way to increase views on your content and chances that others will share it on social media. You want to emulate this idea and do the same on your own social platforms.
However, both organic and paid social media are just for planting a few seeds and getting your content out there. Our remaining strategies are better for actually building links.
Read this guide to learn more about how to create infographics for social media.
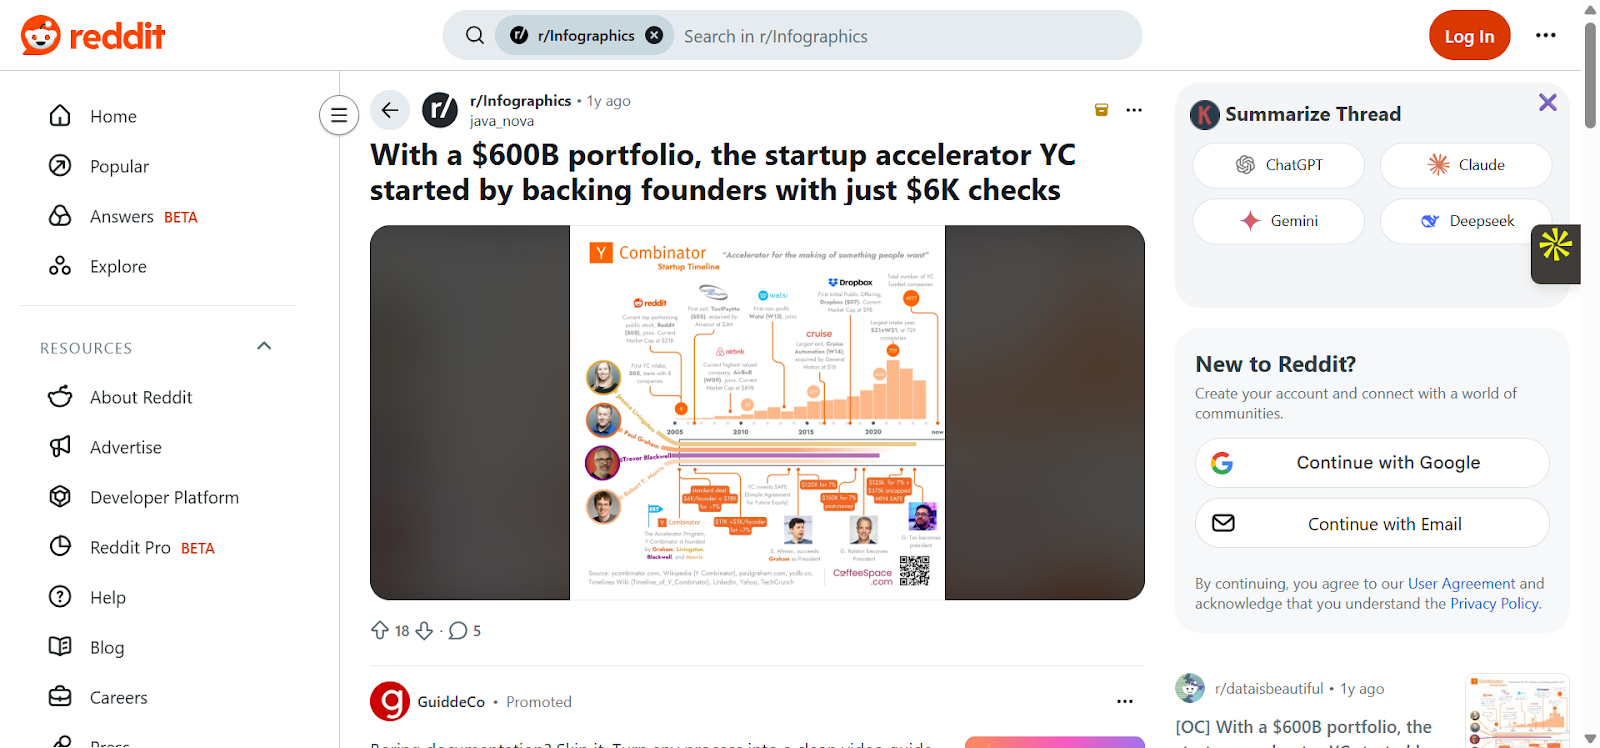
Online communities and forums like Reddit, Quora or niche industry groups can be goldmines for promoting your infographic and earning organic backlinks. However, like social media, these spaces reward genuine contributors, not just self-promotion.
Here’s how to make the most of them:
1. Find the Right Communities: Identify forums or groups where members already discuss your topic and are more likely to appreciate and share your content. For example, if your infographic focuses on remote work trends, explore communities like r/RemoteWork on Reddit or LinkedIn groups for digital professionals.
2. Be an Active Contributor First: Don’t drop links right away. Spend time engaging in discussions, answering questions and building credibility.
3. Position Your Infographic as a Resource: When you do share, frame your infographic as a helpful contribution, not an advertisement. For instance: “I recently put together this visual breakdown of [topic] that simplifies the latest data and thought it might help those looking for quick insights.”
Take a look at how this Redditor did that below:
There are tons of infographic directories out there that you can submit your infographic to for publication. Many will accept your infographic by itself, while others require a unique description to accompany it.
This is a great way to provide a link back to your original content and help your infographic get in front of an even wider audience.
Here are a few practical tips that’ll help your link building in general:
The new link-building playbook isn’t about spamming outreach lists or buying placements on random blogs. It’s about earning mentions in sites that are trusted by both people and algorithms.
As Google’s Search Relations Team Lead, John Mueller puts it:
“The total number of backlinks a website has doesn’t matter at all to the search algorithm.
One good link from a relevant website can be more impactful than millions of low-quality links.”
So, this is what you should seek out:
Earning just a few links from these high-quality, relevant sources can strengthen your backlink profile far more than dozens of low-quality links from unrelated sites.
This technique, popularized by Backlinko, is called the Moving Man method.
The idea is simple: find websites that have recently rebranded or pages that no longer exist, then identify all the backlinks still pointing to those outdated resources.
Copy the URL of the page and plug it into your preferred backlink analysis tool — such as Ahrefs, Semrush or Moz. This will generate a list of all the websites still linking to it.
From there, you can reach out to each referring site with a relevant, updated piece of content to replace the broken or outdated links.
This strategy, also from Backlinko, is quite similar to the Moving man method.
Old content that features outdated infographics, tool lists, screenshots or product comparisons can be opportunities for link opportunities, especially if it continues to rank well or attract backlinks.
All you need to do is reach out to the publisher and offer something better: a fresh data study, a current infographic or a resource that adds better value to their existing post.
While backlinks provide the authority that pushes your website forward, it’s your internal linking structure that directs that authority to the pages that matter most.
Nathan Gotch, CEO at Rankability explains this better in one of his YouTube videos.
In his words:
“Backlinks move the ship, but internal links steer it. You need to know the most powerful pages on your website from a backlinks perspective and then look for opportunities to add links.”
Here’s a quick tip for internal linking:
Head over to Semrush’s Backlink Analytics tool and click on the Indexed Pages tab. This view shows you which of your pages currently holds the most backlink authority.
From there, identify your top-performing pages and strategically add internal links from those authority-rich pages to other important, lower-ranking pages. This passes link equity throughout your site, helping more of your content gain visibility and ranking power.
Here’s another smart strategy that works especially if you’ve already established some authority in your industry.
Matt Diamanté, Digital strategist at HeyTony, explained this in one of his videos:
“This strategy is the easiest win because the hard work is already done for you. Think about it. If a website has already mentioned your brand or your business, then they clearly know who you are and they probably like what you do. The only problem is that sometimes they forget to actually link back to your website, even though they're mentioning your brand.”
Here’s what he recommends:
“Just go to Google and type this in:
Your Brand"-site: yourdomain.com. For instance, “Heytony”-siteHeytony.ca. Now, scroll through the results and look for places where you're mentioned, but you have no link. And then all you need to do is reach out to that website owner and politely ask if they can make your name clickable back to your website.”
In most cases, these sites will agree to link back since they’ve already mentioned you in their content.
Here’s a list of some of the best infographic tools to help you create, promote and build links with infographics.
*Disclaimer: The comparisons and competitor ratings presented in this article are based on features available as of October 30, 2025. We conduct thorough research and draw on both first-hand experience and reputable sources to provide reliable insights. However, as tools and technologies evolve, we recommend readers verify details and consider additional research to ensure the information meets their specific needs.
| Tools | Best For | Top Features | Pricing | G2 Rating |
| Visme | Creating professionally designed visual and marketing assets | Extensive library of infographic templates, AI-powered document/infographic generator, AI writing and editing tools, Advanced design elements, interactivity, 3D characters, data visualizations, live data integration, branding tool, collaboration tool, workflow tool, analytics tool and dynamic fields | Free plan; paid plans start at $12.25/month (annual) | 4.5/5 (450+ reviews) |
| Piktochart | Data-driven infographics and visual storytelling | Visual/chart templates, simple UI for non-designers, collaboration features | Free version; Pro starts at $14/month (annual) | 4.4/5 (160+ reviews) |
| Canva | General design (including infographics) for marketers and teams | Huge infographic template library, drag-and-drop design, collaboration, brand kits | Free plan, paid from $15/month | 4.7/5 (6,000+ reviews) |
| Venngage | Infographic and design tool aimed at marketers | Rich library of Infographic templates, data visualization widgets, simple editor | Starts at $34/month | 4.7/5 (120+reviews) |
| SemRush | Comprehensive SEO analysis, backlink research and competitor tracking | Domain overview, Keyword magic tool, backlink analytics, link building tool | Free trial, starts at $117/month | 4.5/5 (2850+ reviews) |
| Pitchbox | Outreach & link-building automation/CRM for agencies | Prospecting, outreach automation, SEO integrations, link tracking | Starts at $165/month | 4.7/5 (95+ reviews) |
| Hunter.io | Finding and verifying professional email addresses for outreach | Email finder and verifier- Domain search- Bulk email lookup- Outreach campaign integration | Free plan; paid plans start at $49/month | 4.4/5 (610+ reviews) |
Infographic link building isn’t difficult, especially when you have the right tools and a focused outreach strategy in place.
With a design platform like Visme, anyone can create professional, visually appealing infographics using ready-made templates.
You also need to work with a solid strategy that allows you to find relevant publishers, craft personalized pitches, follow up effectively and track every response. Tools such as BuzzStream, Pitchbox, SemRush and Hunter.io also make this entire process more efficient.
Here are a few types of infographics for different use cases:
The best way to build links depends on your goals, niche and resources. However, the most effective link-building strategy is creating high-quality assets like infographics original research, data studies, industry reports or white papers, tools, calculators and templates.
Yes, infographics are still very relevant in 2025. That said, content formats and competition have matured; you’ll need to make sure your infographic is very resourceful.
Yes, infographics are good for SEO.
A well-designed infographic can earn links from bloggers, journalists and niche sites that want to use your visual in their content.
Each time someone embeds your infographic and credits you with a backlink, Google sees that as a signal of authority and credibility, boosting your site’s ranking potential.
In this guide, we’ve broken down how to create, promote and optimize infographics that naturally attract links. We’ve also shared practical outreach methods, SEO optimization tips and tools to help you design data-driven visuals that stand out.
Now it’s time to put these insights into practice and there’s no better place to start than with Visme.
With features like AI-powered design tools, customizable templates, data visualization widgets and built-in workflow and collaboration features, Visme gives you everything you need to craft link-worthy infographics.
Beyond infographics, Visme offers tools to create all types of marketing content including reports, presentations, social media graphics, whitepapers and more.
Ready to start creating assets that improve your ROI? Sign up with Visme today.
Design visual brand experiences for your business whether you are a seasoned designer or a total novice.
Try Visme for free


![How to Make an Interactive Infographic [+Templates]](https://visme.co/blog/wp-content/uploads/2023/11/How-to-Make-an-Interactive-Infographic-Quick-Guide-8-Customizable-Templates-Thumbnail.jpg)


