


Typography Infographics: 12 Inspiring Examples & Techniques

In this guide, you will find 15 different types of graphic organizers:
Choose the type of organizer that you want from the navigation above or scroll down to see each of the different types included, one by one.
The purpose of the circle map is to brainstorm an idea or topic using related information.
A circle map consists of a large circle with another circle inside, where the main topic or idea takes center stage. Surrounding it is the larger circle where corresponding ideas flow.
As the second circle fills up, connections and definitions grow organically and visually. In the second circle, any type of wording can define the main idea; nouns, adjectives or even phrases.
Preschoolers can also use the circle map to learn simple concepts like colors and shapes.
For example, the triangle shape. The word "triangle" goes in the center, and surrounding it are things that have a triangle shape. The outer circle can even include how a triangle makes them feel.
Circle maps are great for brainstorming the very beginning of an idea. You can use it on a whiteboard for a group brainstorm session. With the help of a circle map, great ideas can begin to take shape, and eventually become complete and complex plans.
You can also use a circle map to get the ball rolling with a newly created team!
If the team members don’t know each other very well, a circle map exercise can break the ice and get them to open up about their ideas. Use the interior circle to ask, “What do we want to achieve with this project?” and watch the interaction flourish.
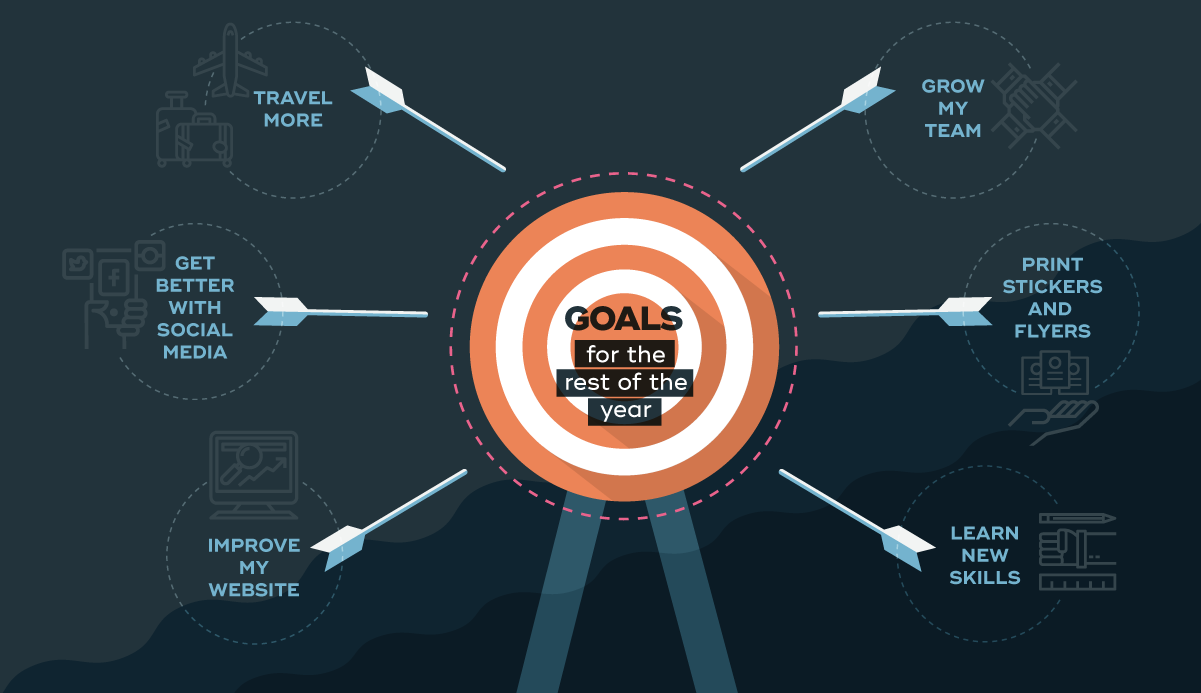
The spider map's purpose is to define a main topic with specific descriptive connections.
In this instance, the center circle stems off to other circles which surround it, creating a visual image of a spider. Each connected leg and circle will include a defining adjective or phrase.
The difference between a circle map and a spider map is that the circle map is more suited for a brainstorming stage, while the spider map is better for defining a topic in detail.
In schools, the spider map makes a regular appearance in science classrooms. Students learn to define new lessons visually, by defining the main topic with a spider map.
For example, consider the subject of animal families. The center circle is mammals and the surrounding circles represent characteristics like give birth, live young, have fur, etc.
In a marketing setting, you can use a spider map to define an audience persona.
In the middle circle, we state the general idea of the persona, such as "a multiracial millennial male." In the surrounding circles, we add defining adjectives like works for himself, lives in the city, considers his friends his family, and more.
Another use for a spider map is for goal setting. There are a couple of ways to do this. One is to figure out a set of goals in a timeframe, like the spider map example above on yearly goals.
The other idea is to map out why you want to complete a certain goal.
For example, "Why do I need a new website?" can go in the center. The surrounding circles can include things like the design is boring and dated or the UX is not working very well. This can then help sort out the exact things that you need to change on your website!
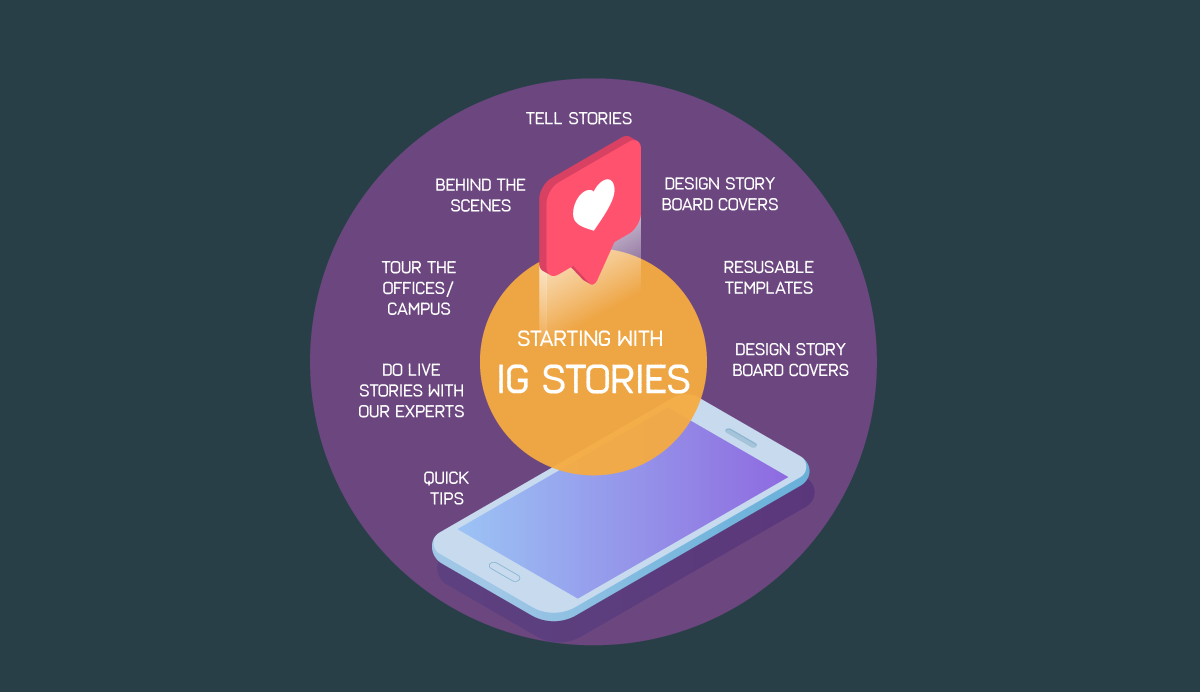
The idea wheel is like a mixture of the circle map and the spider map.
This graphic organizer works for brainstorming and organizing ideas at the same time. The center of the chart holds the main topic which is being studied and around it there can be other circles or shapes, a sectioned larger circle or connected bubbles.

The purpose of an idea wheel is to organize information hierarchically or as a sequence.
Thoughts are added around the main idea in specific sections, and then explained inside the same circle or with a shape stemming out.
Idea wheels are good for freestyle brainstorming and organizing information about a topic. It helps with taking notes while doing research or getting an idea of the bigger picture.
The idea web graphic organizer is a combination of two spider maps. It's basically a comparison organizer that defines differences and similarities between topics.

In an idea web, the two central circles contain the main ideas. Stemming out from both are circles of two types. In the two first stemmed circles are the shared similarities. Towards the sides are the circles that define the differences.
This type of organizer is perfect for situations in which concepts or ideas need a visual comparison. School students use idea webs for courses like Language Arts. They compare characters, situations and parts of the story, making it all easier to grasp.
Another situation in which an idea map could come in handy is when making decisions. If you have to choose between two solutions to a problem, an idea web can help you make a final decision.
By comparing and contrasting visually, the option becomes more clear. In the same way, an idea web can be a slide inside a presentation. It can show a comparison between concepts.
Idea webs can also work really well as infographics. The layout of the circles doesn’t need to follow a strict grid. Get creative with organizing the circles as long as they're still understandable.
Very similar to an idea web is the concept map. This type of graphic organizer can analyze one single topic instead of two or more topics at once.
A concept map and an idea web look very similar with circles stemming out from the center. The difference is that an idea web is for comparing while a concept map is for brainstorming and organizing.

Concept maps sometimes stem out in so many directions that they end up looking really complicated. These types of graphic organizers are good for many stages of content production. From the messy brainstorm stage to the more structured hierarchical organization.
This type of organizational chart usually ends up very large and complex. It's more suited for personal use than for an infographic or presentation. Although, a concept map is sometimes used for data visualizations that show connections between topics.
Venn Diagram organizers are similar to idea webs, but the visual difference is that the circles or sections overlap each other instead of being connected with lines.
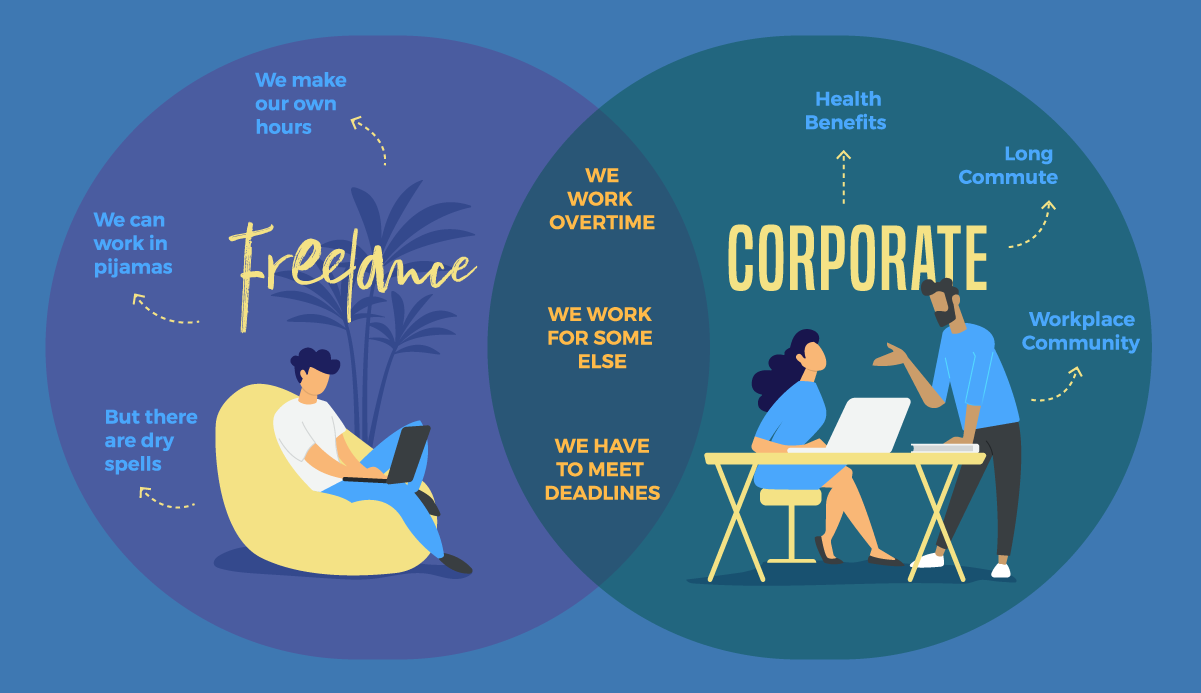
Venn Diagrams are great for helping to find similarities and differences between concepts.
The similarities in a Venn diagram are placed in the union between two or more circles, while the differences are placed where the previous circles don’t meet.
Venn diagrams can become quite complex with many circles (or other shapes) overlapping in different areas, showing comparisons and differences between lots of different things.
Another great use for a Venn diagram is to show how one topic can include many different things to define it and how some of these can even be compared to each other, like in the example below.

If you want to create your own Venn diagram, you can find some practical and easily customizable Venn diagram templates inside Visme. Just pick one and start editing.
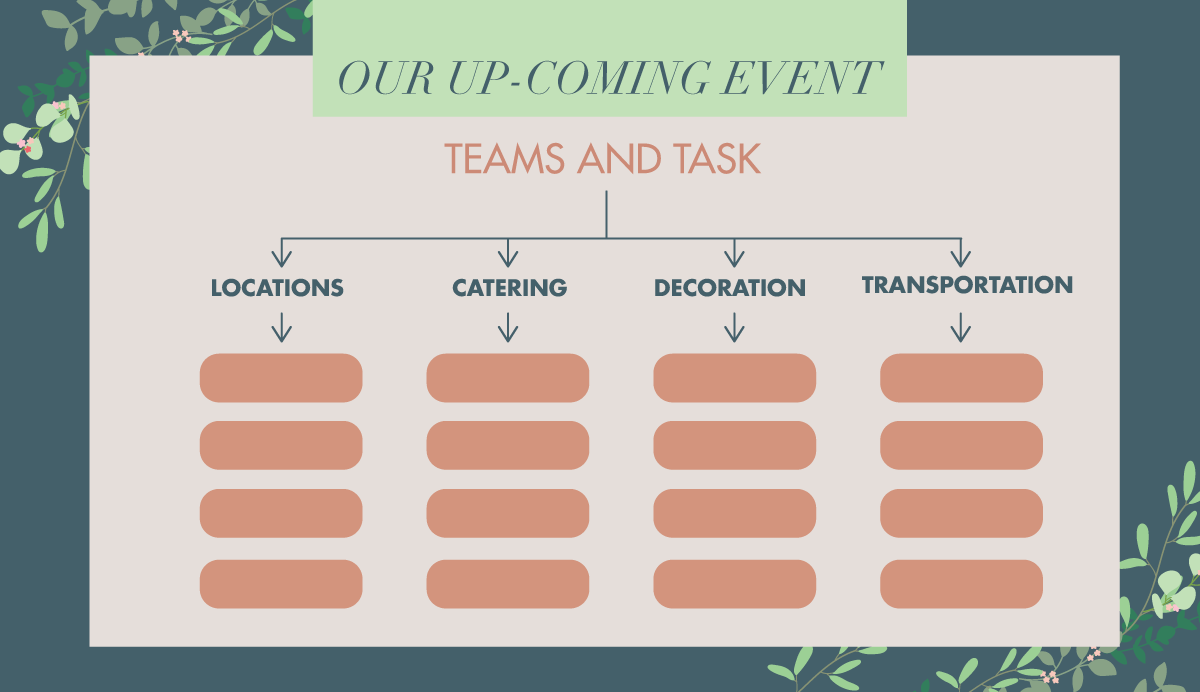
When it's time to classify and organize information, the tree chart can be of great help. Visually, the tree chart resembles a real tree, and some people even associate it with a family tree.
The topmost section is the main title or topic, below that are the qualifiers or subtopics. Below the subtopics, the relevant information forms a list.
Sign up. It's free.Create your own graphic organizer with this drag-and-drop tool!
Tree charts can be used in nearly every industry, especially in education. In an elementary school setting, they can help classify concepts, such as animal families or types of sentences.
A tree chart can be used as a visual outline for any type of written project like an essay or blog post. The title and introduction are placed at the top and the paragraphs branch out underneath.
A practical way of using a tree chart is to organize tasks for a large project. The name of the project goes at the top and each team is a subtopic below. Further below are the names of the team members and their relevant tasks.
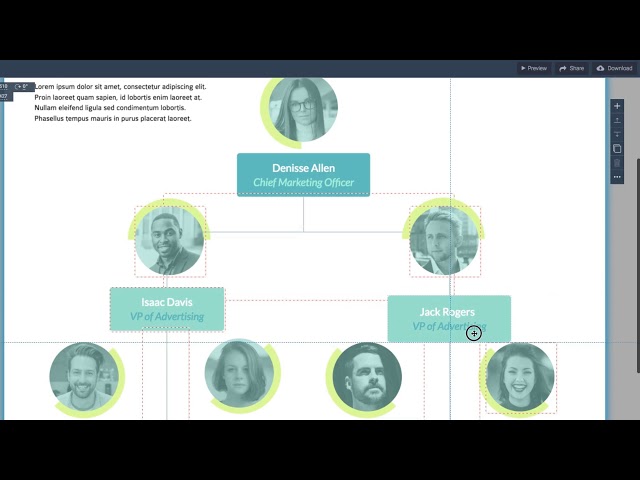
Although it looks similar to a tree chart, an organizational chart has a different purpose.
A tree chart separates information into sections that stem from each other as classification, while an organizational chart is more about hierarchy.

The most common use for an organizational chart is for internal company purposes. It can help visually organize the positions of the founders and everyone who comes after.
The sections at the top of the chart are for the CEO, CFO, etc. Below them are the managers and so on in hierarchical order. The same system can be used to visualize a team inside a company.
Visme has some great templates for organizational charts that you can easily customize for your own company or project. You can also create one from scratch using the drag-and-drop editor.
Check out this video below or this in-depth guide on how to make a hierarchy chart.
A sequence of events chain is pretty much the same as a flowchart. This type of graphic organizer is a visual representation of a process, progression or set of instructions.
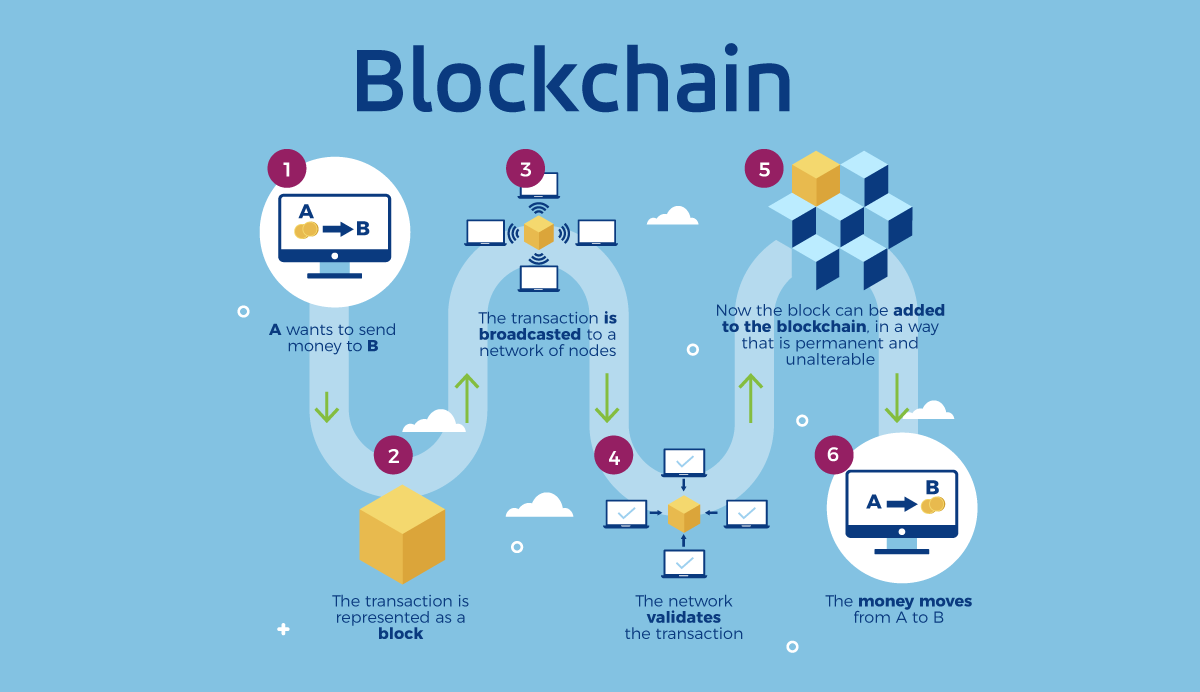
The main topic of a sequence of events chain is labeled outside of the map in the rectangle that surrounds it. Connected shapes form the steps in the progression or explanation of the chain. Some shapes can also have an extra one connected to it to describe that particular step.
We see sequence of events chains all the time in infographics about the growth of a startup or a topic’s progress of change. Here at Visme, we used a sequence of events chain to show how our graphics editor improved in 2017 with new feature updates.
Recipes also look great as sequence of events chains. Start at the beginning with the ingredients and then add the step-by-step process of the recipe, filling in each consecutive shape.
Sequence of events chains, just like idea webs, can be quite creative in their design. You can include illustrations, shapes, colors and even animations to make them more interesting.
The cause and effect map helps to figure out the causes and effects of certain events. The way to use it is to start with a main event, which fills the main central section of the map.
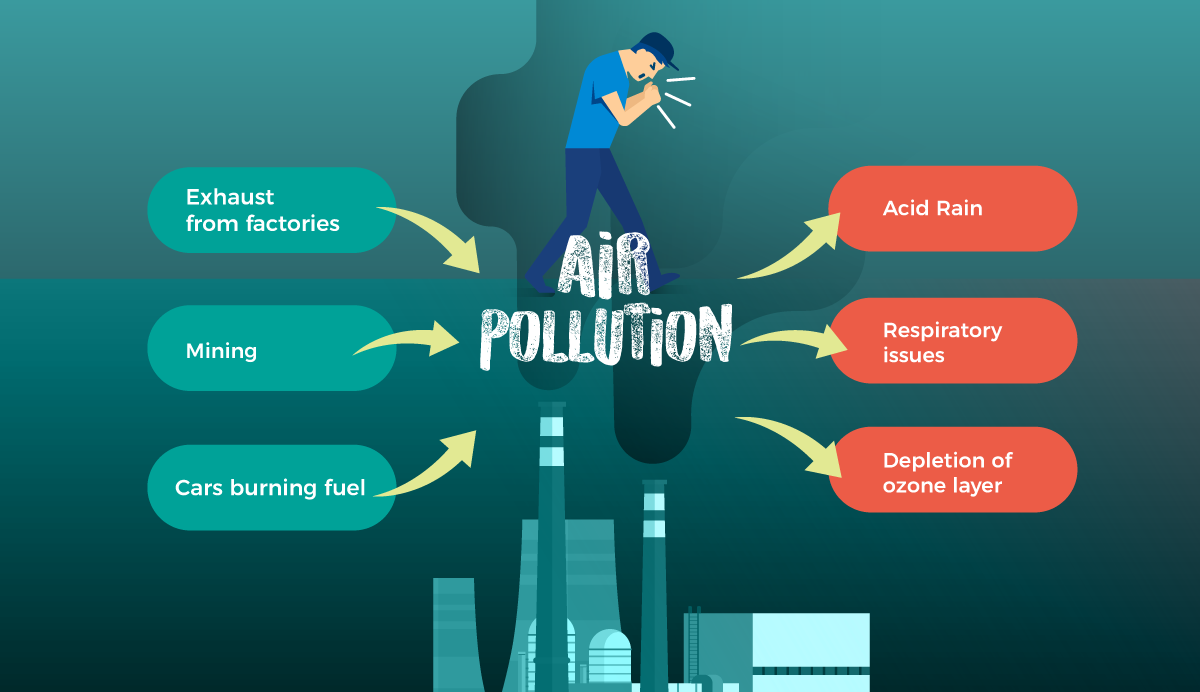
From the main section, other connected shapes stem out to the left and right. The shapes to the left represent the causes that helped the event happen. The shapes to the right are the effects of the chosen event. In some occasions, an effect can also become a cause, creating a feedback loop.
This graphic organizer can help to show the ways in which something is achieved by using the causes functionality. For example, "Be more productive" can be the main event. Some of the causes on each side could be spending less time on social media, or using a calendar or timer.
Another way to use a cause and effect map is to predict the outcome of a certain event.
For example, "Move the office to a bigger place downtown" can be the main event. To predict possible effects, connect shapes to the right of the main event and fill them in. Some of the resulting effects could be that it would be a longer commute, or we would be closer to networking events.
The cause and effect map can also be combined with a sequence of events chain. This way you can create a progression towards a cause, or a succession of events after an effect.
You could make a combined cause and effect map with a sequence of events chains for flipping a house. The main event would be "Flipping a House." The causes could include looking for a new investment, buying an old house or seeing a great opportunity to invest.
The cause and effect map is one of the most versatile of all graphic organizers.
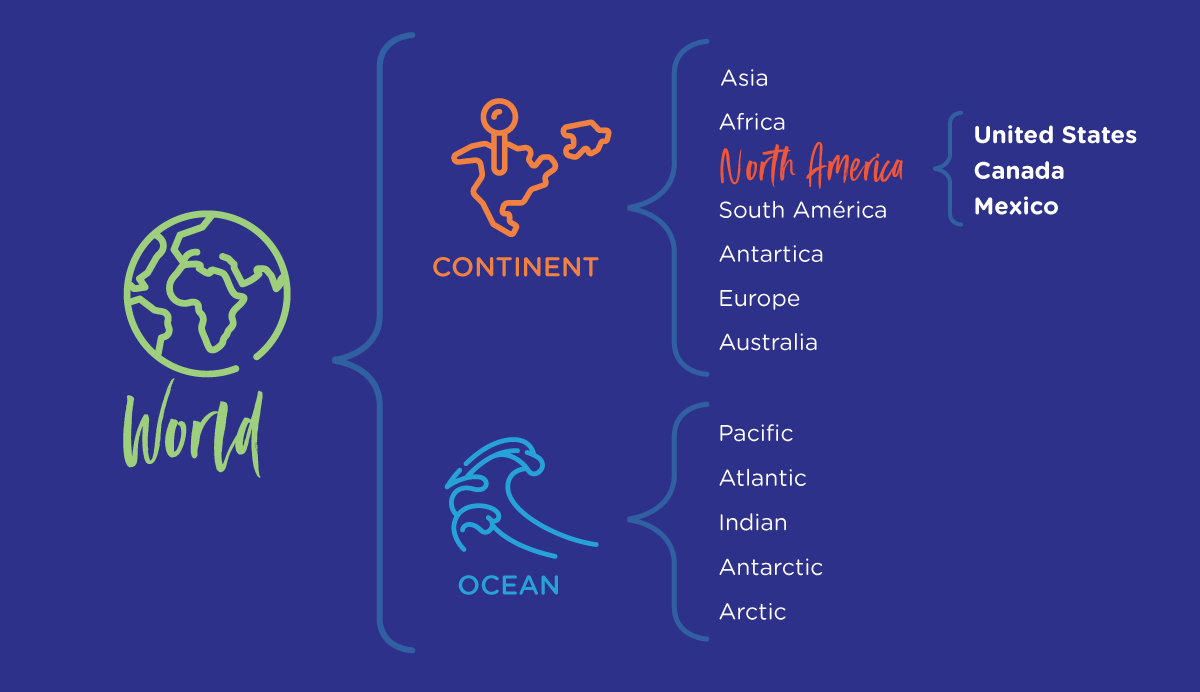
A brace map helps analyze the parts of a whole and the relationship between them.
Visually, a brace map looks like a sideways tree chart. The difference is that a brace map spreads out into all the parts of the original whole. The tree chart, on the other hand, is more conceptual and used for organizing rather than separating concepts.
This type of organizer must include a real object or situation as the initial premise. Concepts and ideas are not what brace maps are for.
Math teachers use brace maps to help their students understand the parts that make up large numbers. By separating whole numbers into smaller parts, students can see how a number works visually. When it's time to add or subtract, students can use the knowledge learned through brace maps and feel confident about their conclusions.
For example, the number 563. The number is the initial object and to the right of it is a bracket. Inside the bracket are the parts of the number; 500, 60 and 3.
The number can be further separated by adding a brace next to each part. The parts of 500 are 100, 100, 100, 100 and 100. The parts of 60 are 30 and 30. The parts of 3 are 1, 1 and 1. Reading the brace map from right to left, all the parts add to the original whole, 563.
Outside of an academic setting, brace maps can help visualize the creation of a website. The initial object can be the website as a whole. To the right of it, a brace opens to reveal the main parts, in this case, the website's pages. Each page then opens a new brace which reveals everything that should be inside that page. A brace map can extend sideways until all the parts have been identified.
Another great use for a brace map is for workplace organization. A beautifully designed brace map can be made into a poster showing all the sections of a startup office, including who works where and where to find them. Or for a premier co-working space that houses all sorts of enterprises. A fun brace map can be used as an outline to show everyone how they can network with each other.
A more unique example of a graphic organizer is the analogy organizer. This is an organizer used to find similarities between things and create analogies. In a few words, an analogy is a comparison of two things by showing their similarities.
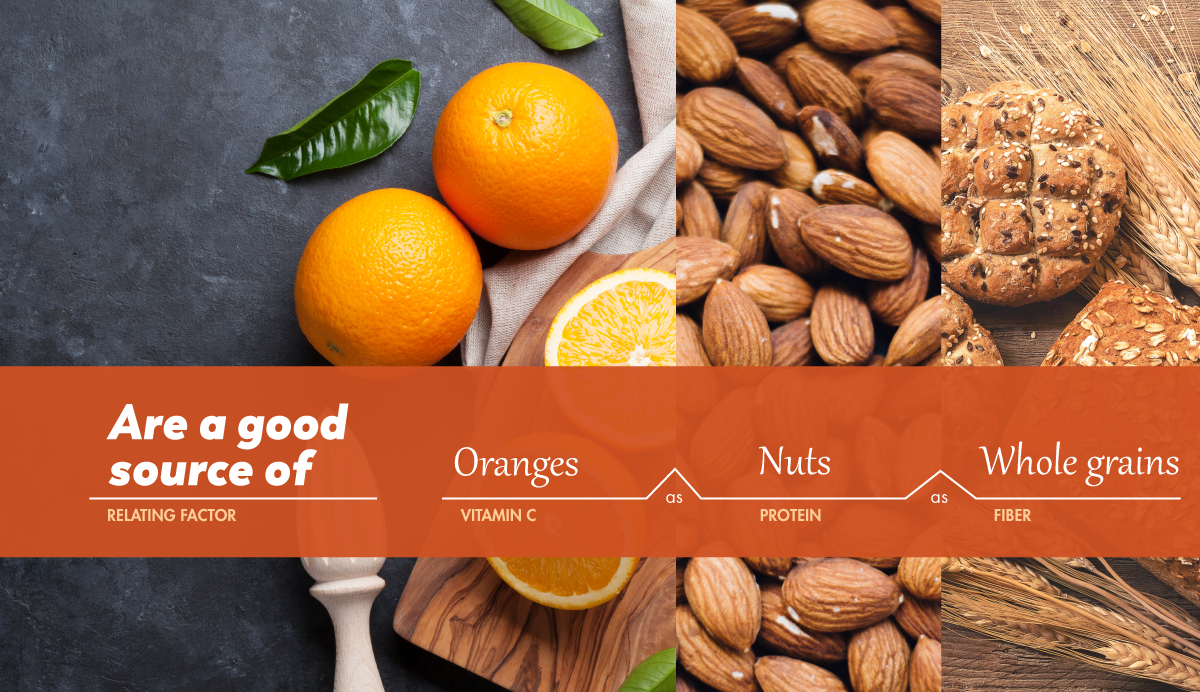
This is how an analogy works:
Superman has the power of flight as Spiderman has the power of web-slinging.
We are comparing Superman to Spiderman by using what they have in common, a superpower.
For children, creating analogies is an important part of language development. Analogy organizers make it easier for them to internalize this knowledge.
An analogy organizer can be used to create a narrative style for a piece of written work. By using the main words in an idea and creating analogies with them, it can make content more appealing. From business proposals to informative blog posts, analogies can add a personal touch.
Another use of the analogy organizer is for a training session of a new team member. With the use of analogies, the training can be more fun than just a bunch of information they need to learn.
A T-Chart is a simple, but quite versatile organizational chart.

Sign up. It's free.Create your own graphic organizer with this drag-and-drop tool!
It's used mainly for comparing two topics. The most common use for a T-Chart is to compare the pros and cons of a decision that needs to be made. For example, what are the pros and cons of revamping your website? Seeing it all mapped out can help you make the right decision.
Other visual uses for this type of organizational chart is to compare two things through their differences. T-Charts are not for finding similarities between things.
Visually, a T-Chart has a large heading at the top with the title and two columns side by side that are filled in with information according to each topic. It visually resembles the letter T. The information can be organized as a list with text or with images to support visually.
A timeline chart is a long line representing a span of time. All along the line, connected shapes stem out depicting events happening on certain dates. The events are organized in chronological order.

The main line that depicts a span of time can be visualized horizontally, vertically or as a freeform shape. A timeline chart can sometimes look like a sequence of events chain.
The difference between the two is that a timeline chart visually depicts the dates of things that have happened while a sequence of events chain is timeless.
This particular organizational chart is a good visualization tool for the classroom. It can be used for history projects and a better understanding of historical events.
If you'd like to create your own timeline chart from scratch, you can use Visme's timeline maker.
The last organizational chart in this list is the storyboard. A storyboard visually looks like a simple comic strip. The purpose of a storyboard is to visualize a story with images.
A common use for a storyboard is for video and film production. Each square in the storyboard can represent one scene in the film.
Another use for a storyboard is for UX designers to create customer personas and possible situations in which the website, app or product is used. Storyboards are also used in schools to teach sequencing and cause and effect in stories and fables.
A storyboard doesn’t need to be a static page with squares, it can also be cut into sections and used for creative writing organization. Writers can sketch the scenes in their story and organize the visual squares in any order until they are happy with the final outcome.
As you can see, graphic organizers are a rich resource when it comes to creative analytical thinking processes. They help us visualize even the most complex ideas and make them tangible.
Sometimes, when we take on a new project, it can feel daunting and enormous. By using graphic organizers, we can relieve our brains of excessive thought work.
You can easily create most of the graphic organizers mentioned above in Visme with little or no design knowledge. Our library is full of professionally designed templates that you can use by simply plugging in your content, changing the colors, adding new shapes and more.
For example, it will take just a few minutes to create an idea web by adding circle shapes, lines and text. You can customize the colors, add background images and even animation and interactivity to make your graphic organizer more engaging.
Sign up for a free account and take Visme for a test drive.
How do you plan to use a graphic organizer? Which one is your favorite? Let us know your feedback, suggestions and questions in the comments section below.
Design visual brand experiences for your business whether you are a seasoned designer or a total novice.
Try Visme for free