How Visme Helped Wellcome Save 40% More Time & Win Clients

“Visme has everything you need to create something cool. From data analysis to a demo video, everything is all in one place. It allows people of varying design skills to create professional work that’s engaging and within brand guidelines.”

HouseCalls is a division within the Optum branch of United Healthcare. Their team’s main job focuses on sending licensed medical professionals to the homes of people with healthcare plans that include this benefit.
We sat down with Helene Dunbar and Amanda Aultman, internal communications specialists on the HouseCalls team, to discuss how they utilize Visme to speed up their content creation process.
The internal communications team sends correspondence to each employee within the larger HouseCalls team, sharing updates, team wins, and more. This communications team supports and services all of the company’s call centers.
The communications team was first introduced to Visme when they brought on a new manager who was already familiar with the tool. Many people on the team were using InDesign, PhotoShop, Illustrator and other similar tools for creating their visual content, but the new manager preferred many of the aspects of Visme.
“Visme gave the new manager a way to create things. She didn’t need to learn PhotoShop or InDesign, and could still design a banner or mailing graphic.”
Visme makes it easy for teams to create any type of visual content, and the same goes for HouseCalls. In fact, the HouseCalls Internal Communication team will be the first to say that they use Visme in a pretty unconventional way.
“We rarely use Visme in the way I think it was intended. For instance, we don’t create presentation packets, etc. Instead, we use Visme to display visual metrics and we’ve used it for cards and graphics.”
However, that’s the beauty of a versatile tool, especially because Helene and Amanda both explained the types of content they create—and they’re completely different.
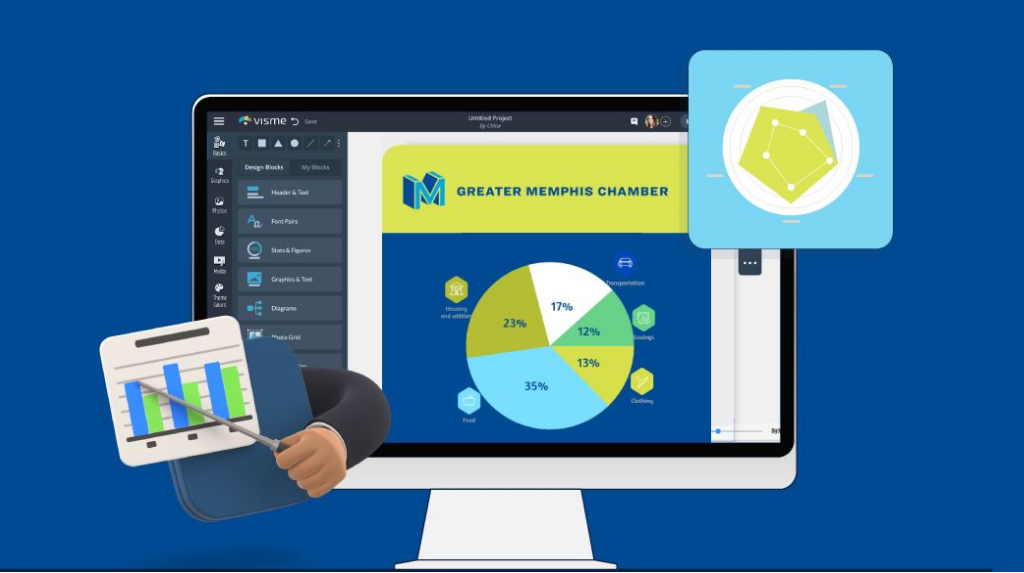
Helene creates visual dashboards and metrics that she can share with leadership teams, like this sample below:

“We have leadership who much prefer a visual representation of the data they need to work effectively.”
Amanda, on the other hand, creates interactive content and demo videos that share helpful and educational information with their employees working in each of their call centers.
Here’s an example of an interactive organizational chart she created that allows viewers to click on each name to learn more about their department.
Although some members of the HouseCallsteam still use Adobe products for certain projects, the ease of Visme has allowed many tasks to be done much more efficiently.
“I was creating these visual dashboards in InDesign, and I can’t even tell you the time that it took. So for me, Visme just saved me so much time and effort, and it actually allowed me to present something more attractive and more user-friendly for the end-user.”
Helene estimates that these projects used to take her more than half a day, ranging around 4.5 hours. When she first switched over to Visme, it was cut down to about 3 hours, and now takes her only an hour and a half to create and update these monthly dashboards—a 60% time savings.

They’re able to cut the time down by taking advantage of Visme’s templates, design assets, charts and data widgets, and more. This keeps the team from having to design every single element from scratch.
“I don’t feel like I’m recreating the wheel anymore. Visme is so easy and it gives me ideas that I wouldn’t have if I was just starting from scratch in InDesign.”
The fact that all templates and in-app graphics are editable give the team the power to update icons to match their corporate branding and input their brand fonts and colors. Especially in a corporate environment, ensuring everything is on-brand is key. Plus, the user-friendliness never hurts.
“I feel like I can use Visme quickly and do things quickly there compared to Adobe. You don’t really need those tech skills to come in and create something that looks professional and engaging.”
Furthermore, Visme has allowed their team to visualize data and statistics easily and in a digestible and customizable way. The HouseCalls team was having meeting after meeting to discuss how best to present 20 different stats from 20 different areas of business into a quarterly report, and finally Helene hopped into Visme to see what she could put together.
“I created a sheet of different animated pie charts and line graphs. Viewers click on it and everything moves into place, pulling the audience into it. It’s attractive and it’s not a 75-page document. It’s really user-friendly.”
Create more visual content faster. Learn more about how Visme can help your marketing or communications team visualize important information in a digestible way, without having to dedicate hours of your day. Request a demo or sign up to try Visme for free.
Design visual brand experiences for your business whether you are a seasoned designer or a total novice.
Connect with Sales