How to Create a Benchmark Report in 2026 (+ Templates)

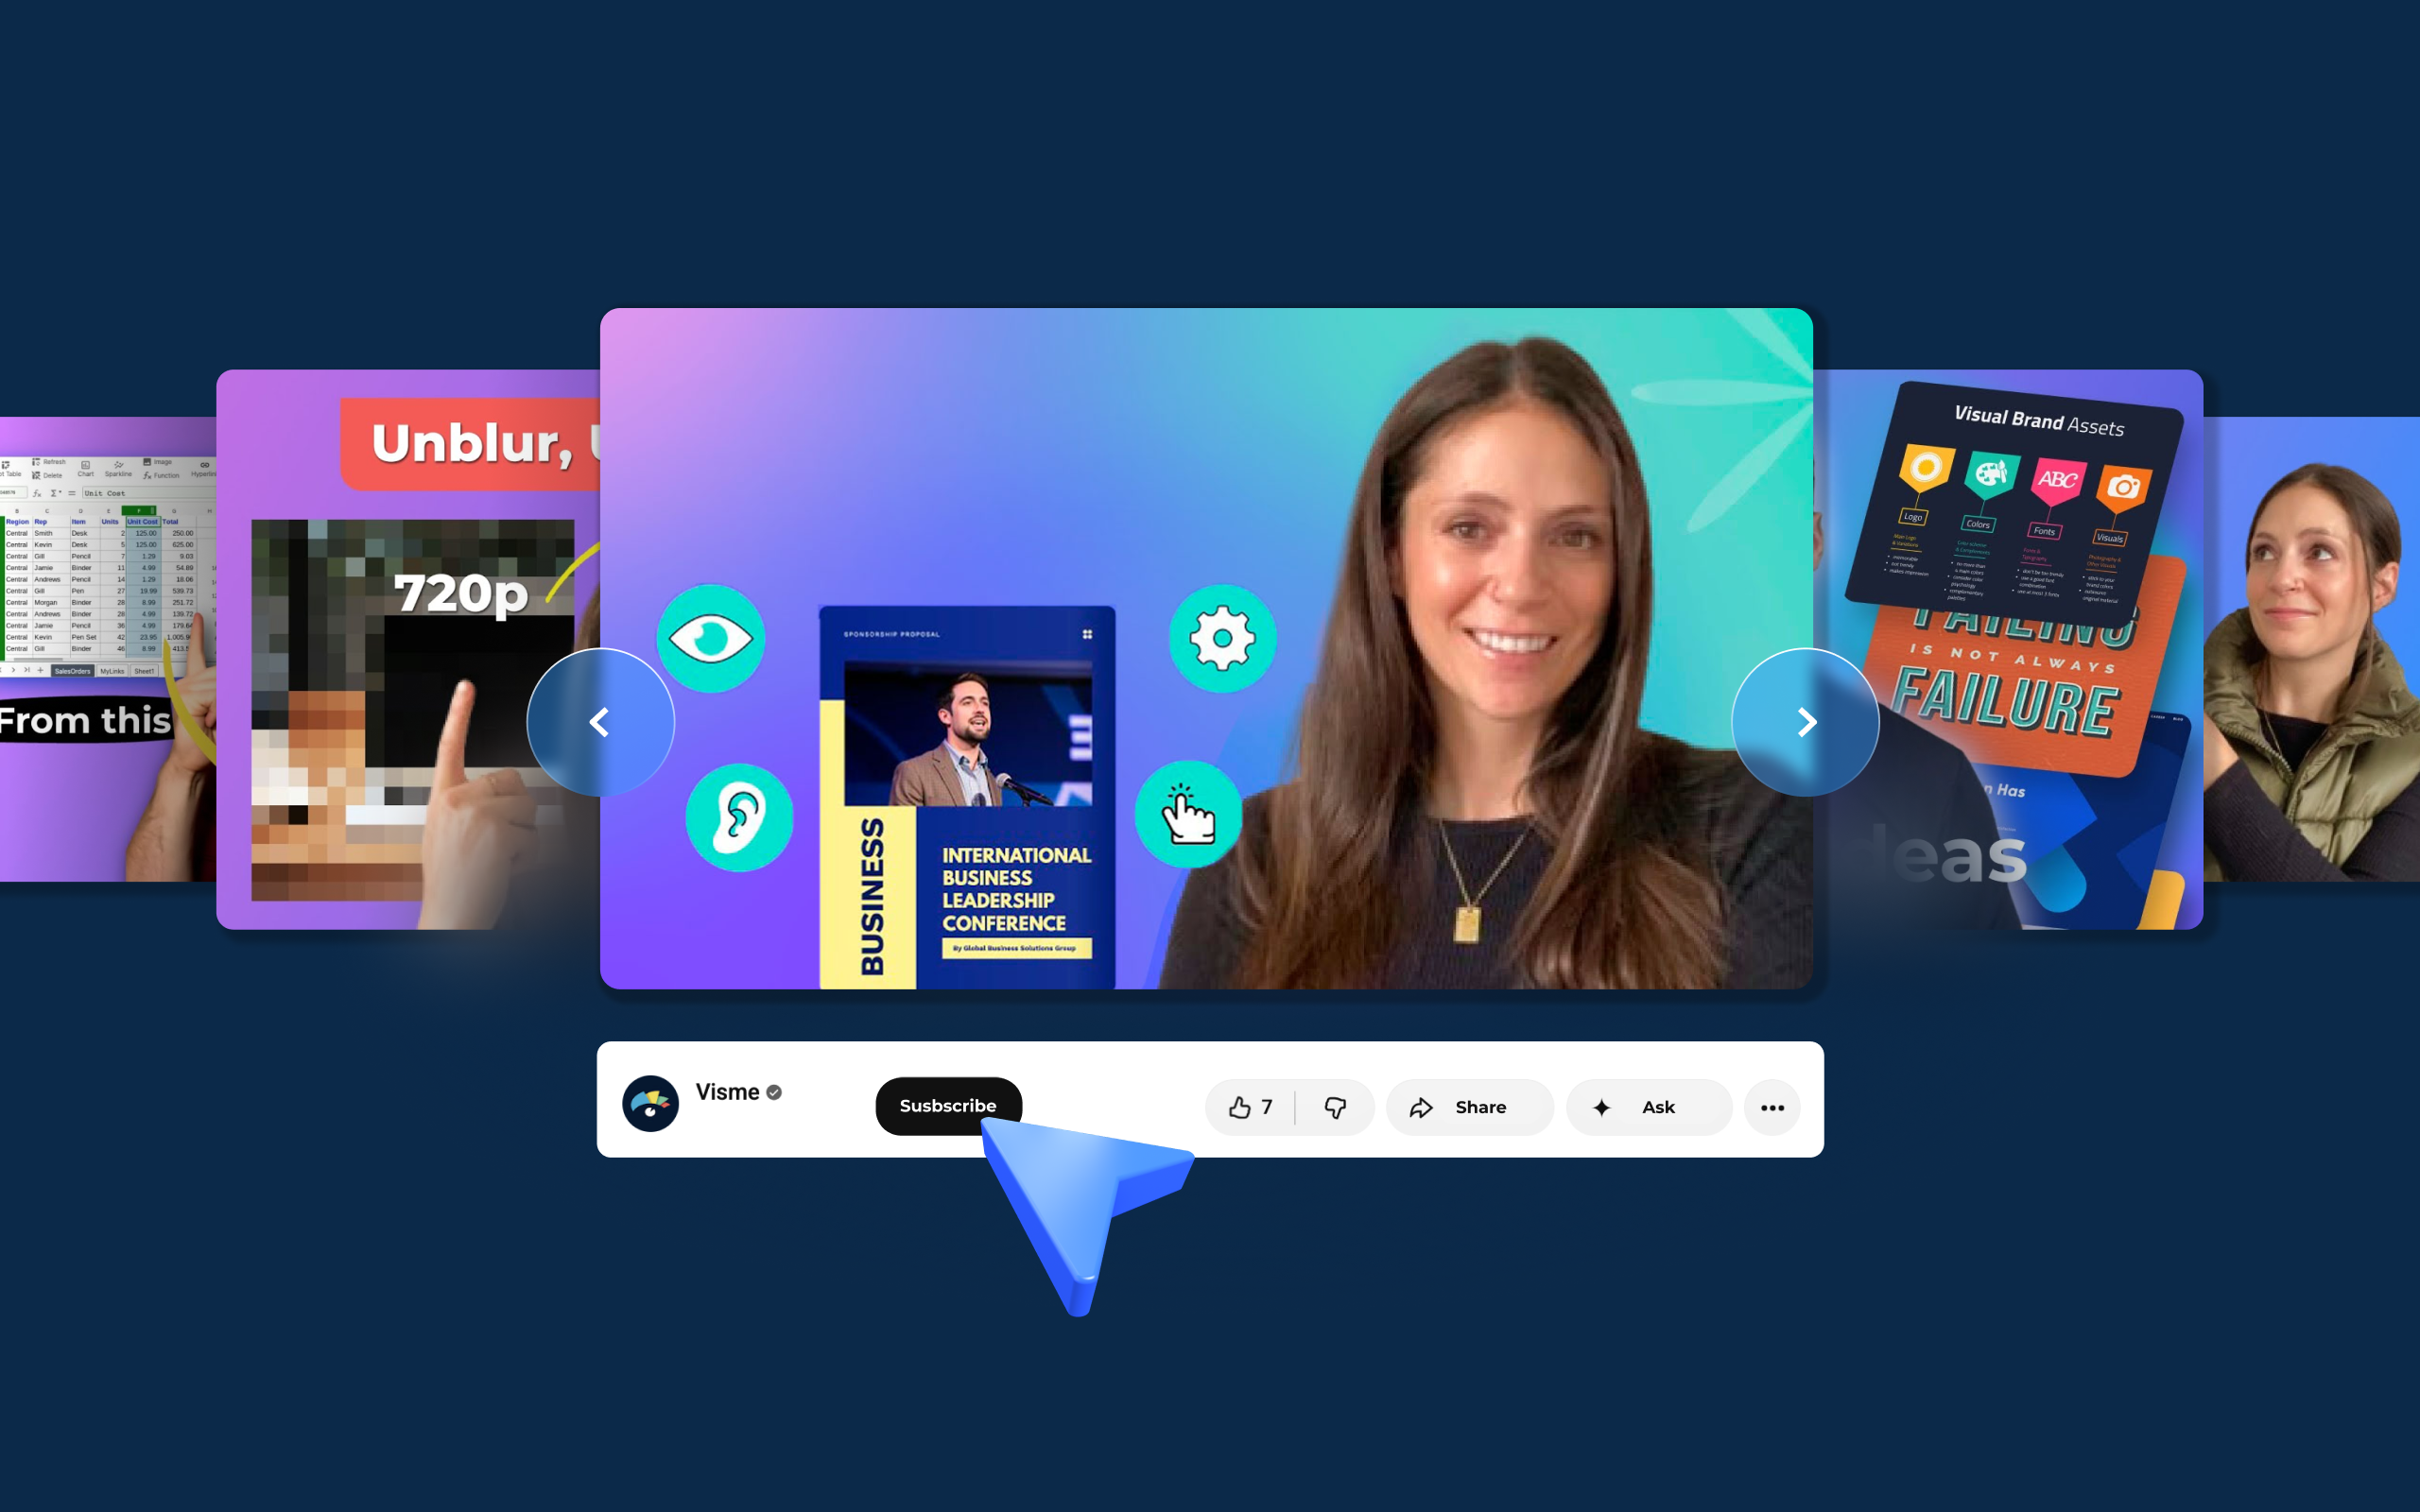
We have been publishing tutorials on the Visme YouTube channel for 7+ years, on everything from pitch deck structure to chart axis settings and beyond.
But with hundreds of videos available, it’s easy to miss features that could make your everyday work faster.
Now, we’re grouping them into sets so you can pick up a handful of useful things in one sitting. This is the first set.
Here are eleven videos about features you may not know about, each one built to save you time. Some have been in the editor for years; others are newer. But each one can help you solve a specific content creation problem or cut unnecessary steps from your workflow.
Each video is only a few minutes long, so start with whichever one matches what you’re working on right now.
You are building a client-facing deck, and you find a Visme template with exactly the structure you need. There’s just one problem: the template uses teal and coral, while your brand colors are navy and grey.
And with 24 slides to update, recoloring everything manually could eat up the rest of your afternoon.
This video shows you how to apply your brand fonts and colors across an entire template in one go. Plus, it explains how to use Replace All, which swaps a single color everywhere it appears in the project.
It's Thursday and the monthly performance report goes out tomorrow. It contains the same six charts as every month, all of which need to be updated with data from finance, which is still in progress.
Last month, you added the figures on Thursday afternoon, but then finance revised three of them overnight, and you barely had time to update the report before the meeting started first thing Friday morning.
This video walks you through the ideal fix. Ivan covers all your import options, including which sources keep updating on their own and which lock to a snapshot. Once the live connection is in place, changes to the source data can flow into your charts without manually retyping every figure.
Your sales team is designing a product overview for a buying committee. The sales rep with the design knowledge wants the slide to stay minimal and highly visual. But the technical evaluator wants to include lots of integration details.
You don’t necessarily have to choose between the two.
Learn all about Hotspots, pop-ups and other interactive features that will help you do exactly what both the sales and eval teams want.
You’re putting together a regional sales report covering 12 territories. You could put all the numbers into a spreadsheet or table, but that makes it harder for stakeholders to quickly see what’s happening where.
When your data is tied to locations, an interactive map can tell the story more clearly.
Visme lets you build maps that viewers can explore using hover effects or that you can walk through region by region during a presentation.
Watch the video to see how to build and customize one.
Your company is rolling out a new onboarding module in English, Spanish and German. You’ve already recorded all three narrations.
Then HR revised two lines in the compliance section. That means re-recording, finding the other two voices again, and matching their timing to slides that have already moved.
With Visme's AI text-to-speech, you won’t have the problem again. Type the script, choose a voice, and direct how it reads. The video gives you all the details on how to use this feature for your work.
Part of your workload this week is to work on a case study one-pager about a client your company has had for many years. Part of the content is a photo of the original founder, but it’s a bit blurry.
Before looking for another image, try cleaning up the one you already have.
Watch this video to learn about the touch-up panel, which includes AI-powered tools that deblur an image and then upscale it three to four times. The same toolkit can also help remove unwanted objects and backgrounds.
The media team is designing 40 social posts a month across four channels, while juggling several larger projects. All the graphics live in a Visme workspace, but the schedule and due dates sit in a spreadsheet somewhere else.
Now your team has two places to check just to answer one question: What needs to go out next?
This video walks through the Schedule tab, where posts, tasks and project deadlines share a single month view alongside the designs themselves.
When you’re presenting live, you can simply say, “Now let’s move on to the results.”
A presentation viewed independently doesn’t have you in the room to provide those verbal cues. The slides need to help communicate when one idea ends and another begins.
That’s where transitions can help. But balance matters. Use too few sections, and they can blur together. Use too many, and the movement starts competing with your content.
In this video, Ivan compares transitions to “connective tissue” because they help join different parts of a presentation together. He explains which transitions work for business presentations, which are better suited to creative projects and why consistency usually matters more than variety.
When you’re finalizing an important proposal, it’s probably going to need a legal review. Typically, the notes come back as a numbered list in an email. Slide 4, second bullet. Slide 9, the chart caption. Slide 12, the whole footer, etc.
Now you have to spend time matching every comment to the element it describes before you can even start making changes.
There’s an easier way.
This video shows how to use commenting in Visme so reviewers can attach feedback to the part of the project they’re referring to.
Let’s say you’re producing training materials for a public sector client. The contract asks how your content works for people using screen readers and for anyone who finds low contrast hard to read.
The deck is already designed, but you’d like to show the client just how much you care about accessibility, not just say it in a bullet-point list. So you’re going to need to know what is compliant and what isn’t.
Checking every element manually can make it easy to overlook something.
This video covers the Accessibility Checker. It flags potential accessibility issues and directs you to the elements that need attention, including some details you might not think to check yourself.
You sent a proposal through a Visme link on Tuesday. Your follow-up call is scheduled for Thursday morning.
As you prepare for the call, you might assume the buying team has read the entire proposal, including the pricing section.
But did they?
Visme Analytics can give you a better idea of how people interacted with the content you shared.
This video walks you through the analytics dashboard and shows you how to use engagement data to understand what happens after you hit send.
Every one of these is already in the editor, waiting for the day you need it.
Pick the one that solves the problem in front of you, watch the tutorial and try it in your next Visme project.
And if you discover something useful, tell us in the comments on the YouTube video. You can also let us know which Visme feature you’d like us to cover next.
Don’t forget to subscribe to the Visme YouTube channel
Design visual brand experiences for your business whether you are a seasoned designer or a total novice.
Try Visme for free
![20 Interactive Presentation Ideas That Will Engage Your Audience [+ Real Life Examples]](https://visme.co/blog/wp-content/uploads/2026/07/BH_Thumb-0726-Interactive-presentation-ideas-and-examples-1-500x280.png)


![20 Interactive Presentation Ideas That Will Engage Your Audience [+ Real Life Examples]](https://visme.co/blog/wp-content/uploads/2026/07/BH_Thumb-0726-Interactive-presentation-ideas-and-examples-1.png)