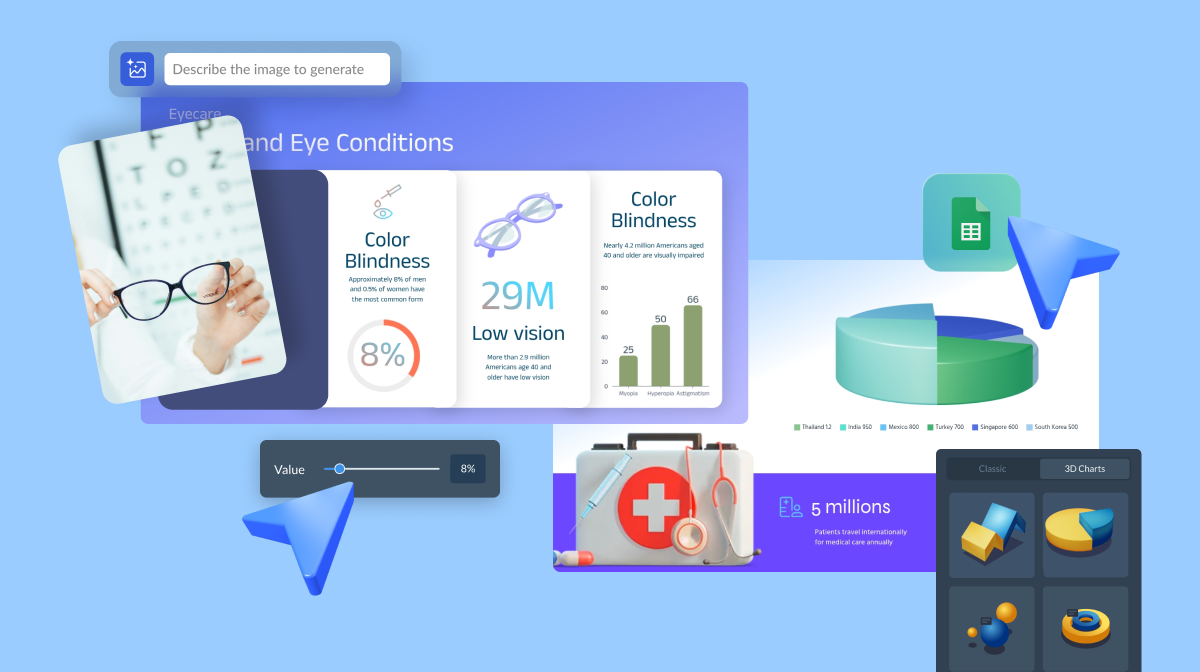
Healthcare Data Visualization: How to Turn Data into Impactful Stories

If you’re trying to visualize geographic data, look no further than Visme’s interactive map generator. With the ability to customize any region in the world and provide interactive data for your audience, Visme’s tool is an incredibly useful application.
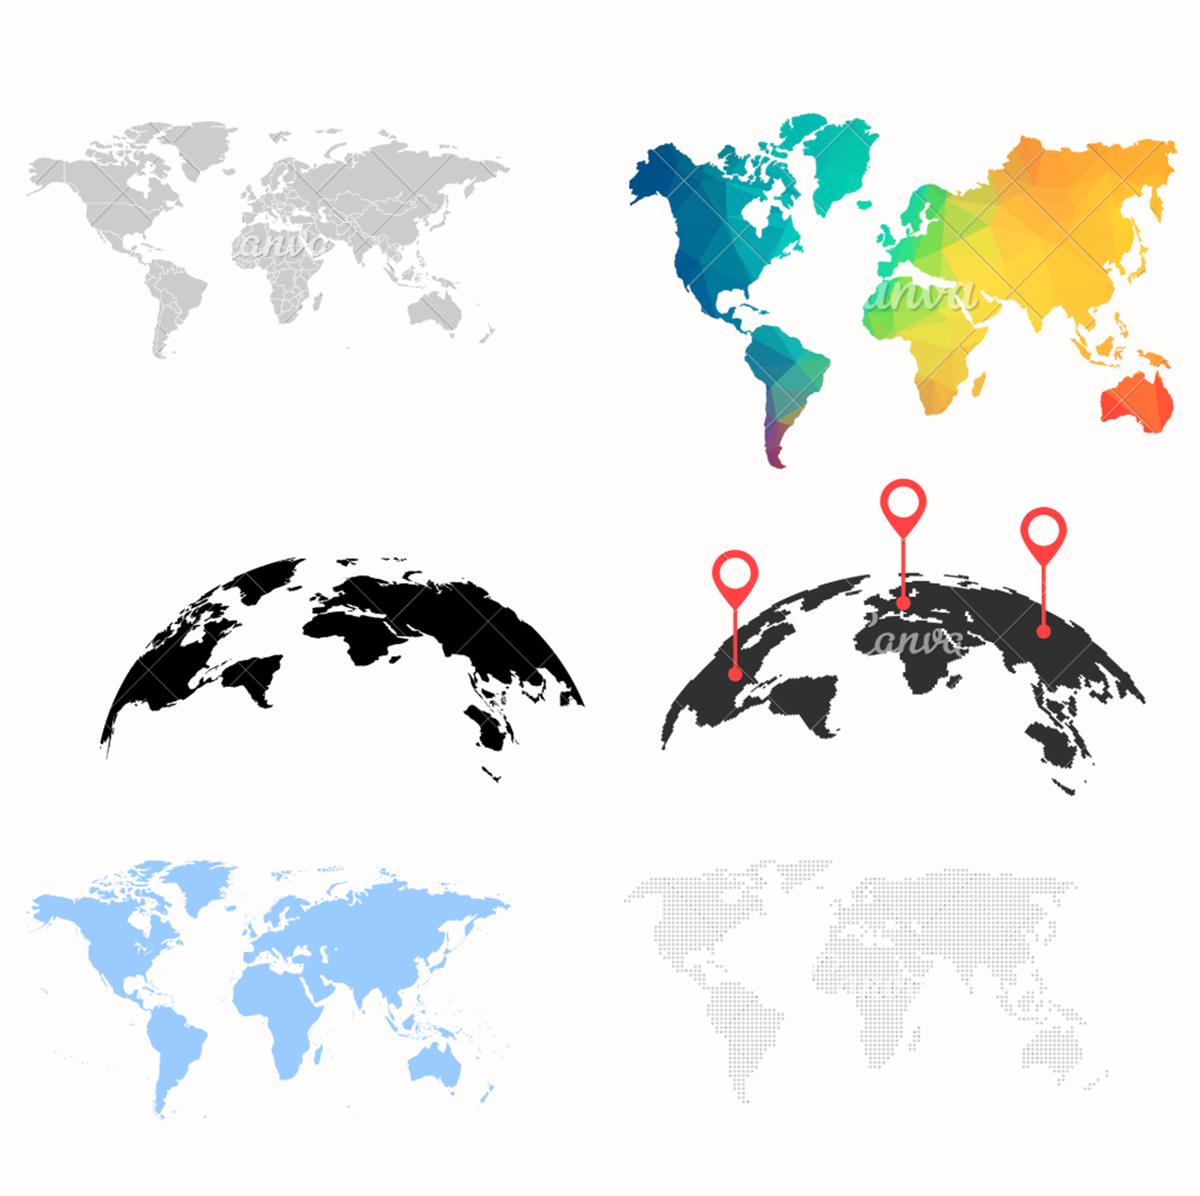
Just a few ways you might be looking to showcase geographic information could be:
So, what is interactive content? It's content that requires your audience to click, scroll, drag, hover and more, leading them to engage more and stick around longer.
Take this interactive map below, for instance, showcasing data for the number of US coronavirus cases thus far.
Did you hover over each state to see the different numbers and statistics? Do you see how powerful that is? Users are much less likely to scroll past interactive content. They want to stick around and play with it for a bit first.
We’ve put together a quick step-by-step tutorial to show you how to make an interactive map with Visme like the one we created above.
If you're more of a visual learner, this video will show you how simple it is to make an interactive map in Visme.
An interactive map is a type of map that allows users to interact with the content. It includes features such as markers, pop-ups, and overlays to provide users with a rich and engaging experience.
Users typically have the ability to zoom in and out, pan across the map, and click on various locations to identify specific features and access additional information. Interactive maps can be used to display geographic data, provide directions, and create immersive experiences for website visitors.
In the next section, we’ll discuss how to make an interactive map. But before we dive in, watch this video to learn how to create interactive maps with Visme’s map creator.
Your first step in creating an interactive map is to sign up for Visme’s interactive map maker and generator.
The next step is choosing a template that looks closest to your vision.
You can easily browse through all of Visme’s map templates here, and explore other templates in our library as well.

If none of our current options suit your fancy, feel free to completely start from scratch on a black canvas as well. Simply log into Visme and create a new project to get started, then add a map from the Data sidebar of the editor.
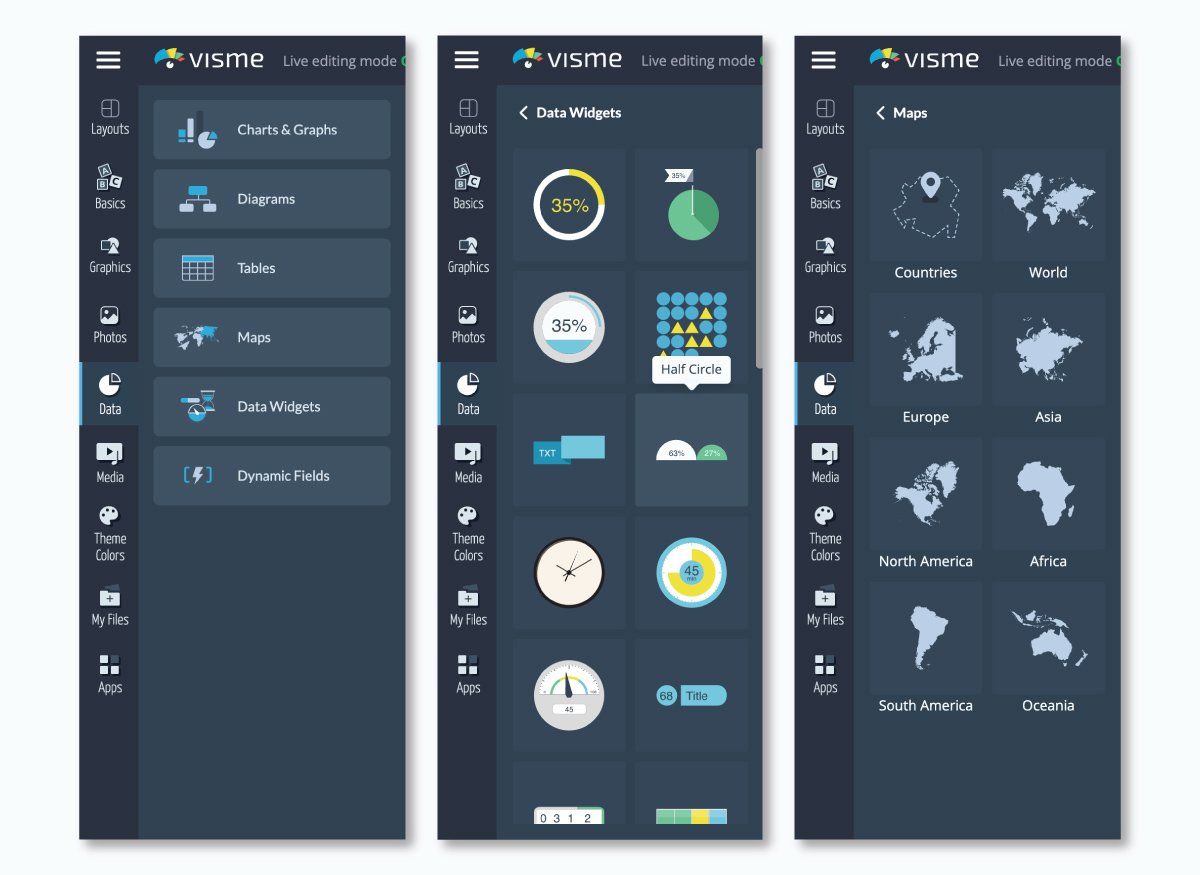
You can also choose to create a world map as well! Just click on your map then select settings to find the country or region you plan to focus on.

You can then search for any country by either typing its name in the search bar at the top right or scrolling through the list. Under the Regions tab, you can also visualize major world regions, such as Africa or Asia.
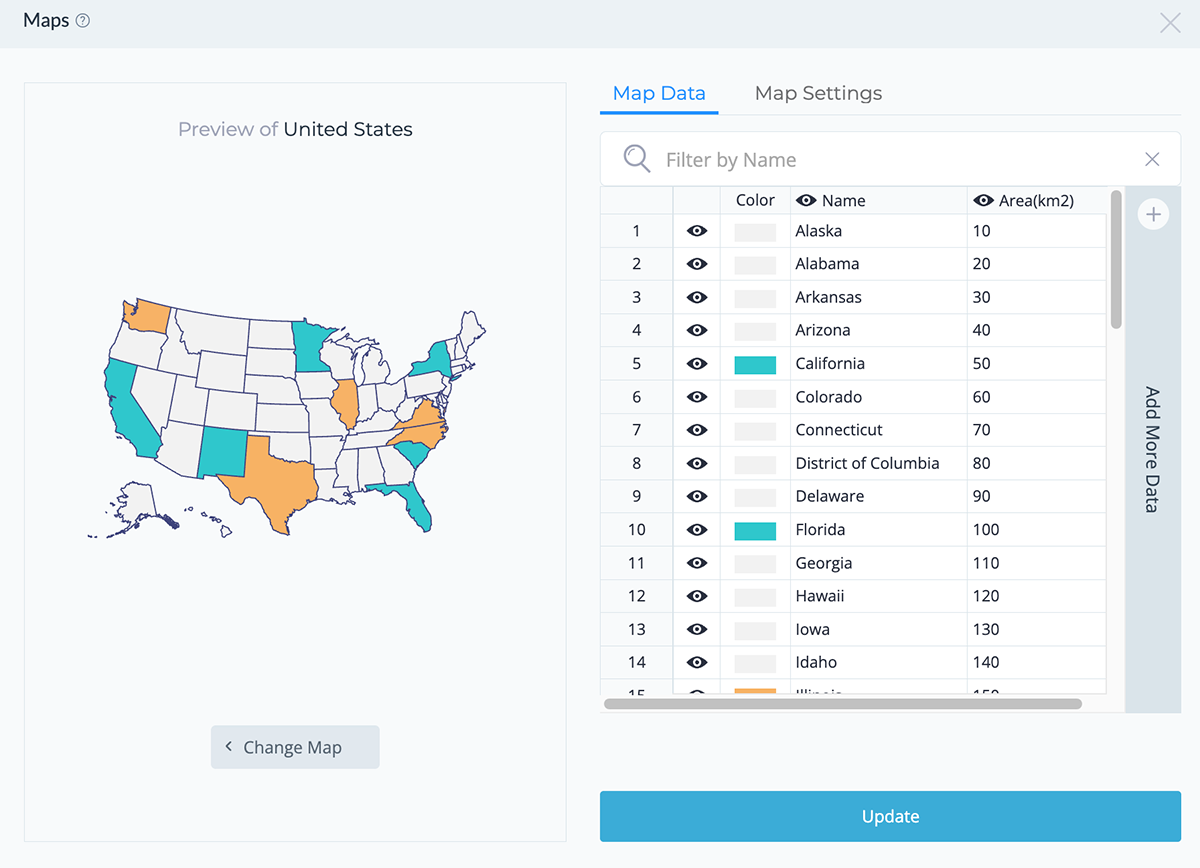
Once you've selected your country or region, you can then click on the Edit This Map option in the middle of your map preview to insert your data.
Your next step is to input your map data. Whether you’re including population, votes or cases of a disease, like in our earlier example, you can insert any data you’d like.
As you see below, the area of each state, country or province is the automatically populated data, but you can update this to whatever you plan to share.

Insert your own information by clicking on the Add More Data option and then pasting your data from Excel or Google Sheets.
You can add as many columns of information as needed; just make sure to rename your column with an appropriate title by clicking on the cell and typing in the name.

Now it’s time to color code. In the Map Data area, you can also select the colors of various areas in your map to change them based on your numbers and information.

You can click on any previously used hues under the Colors column or click the plus sign to find a new shade.
Go to the Presets tab to choose from any of Visme’s preset color combinations, or select More Palettes to find any color themes you’ve created from your brand colors.
Under the Map Settings tab, you'll find several options that will allow you to further customize the way you visualize your data.

For example, you can choose a Global Map Color (although the local colors you defined in the previous step will override this setting), or you can Show Borders between states or provinces and set a color for them.
You can also activate the Show Caption on Hover option so that when the cursor moves over any state, the data inserted in the previous step is displayed. In order to create contrast with your global map color, you can choose a light or dark-colored caption.
Next, you can display the data inserted under the Map Data tab by activating the Area Value Map setting.
Once you do this, other options will appear, such as a drop down menu with the names of all the columns of data you created in step three. Here, you can choose which column of data you'd like to visualize.
If you're dealing with numerical data, you can visualize the range of values in your data set through a corresponding range of colors.
To do this, simply choose a Start and End color under the Area Value Colors setting, and the Map Engine will automatically assign a hue within this color range to each of your data points.
Also, you can activate the Show Legend option to display the colors that correspond with each range of values. From the drop-down menu, you can choose whether to display it to the right, left, top or bottom of the map.
Depending on your background color, you can also choose to make the color of your Legend Text dark or light.
Finally, you're ready to publish and share your interactive map with the rest of the world. Click on the Share button at the top of your screen to access your options for sharing your interactive map online.

Under Publish for Web, you can generate an online link to share on social media or in emails. Or you can head over to the Embed tab to grab a responsive embed code to paste on any page of your website.
After sharing your Visme map online, you can track its progress using the analytics feature. This advanced tool enables you to monitor unique visits, total visitors, visitor IP, location and more.
Now that you know how to build an interactive map, here are some interactive map templates from Visme's library to help you create your own. Choose any templates below and customize them using the Visme map generator.
This easy-to-understand Choropleth map template highlights the differences in GDP per capita worldwide. It lets you effortlessly add data to show varying income levels in multiple regions.
With its eye-catching colors and design, anyone from economists and political scientists to students researching global income gaps can use this map.
Use it in your reports, academic projects or website to give your work a visually engaging and informative edge. And if you are an educator who uses learning management systems for content delivery, Visme allows SCORM and xAPI export options, making it easier to share your Visme content with your students.
Present the rankings among countries in a sleek and modern way using this yellow and green map template. It allows you to effortlessly visualize rankings among countries for various subjects, such as economic performance, environmental issues or sporting successes.
This modern template provides a visually appealing and informative way to share country rankings in different sectors. The template is ideal for statisticians, educators, analysts or professionals who need to present comparative data.
Dive into the brewing scene of Latin countries using this visually vibrant map template. Perfect for breweries, marketers, or beer enthusiasts wanting to highlight the origins and popularity of different breweries in Latin America.
This user-friendly template depicts brewing trends and top breweries and reveals the connections between various regions. Customize its dynamic visuals per your branding needs with Visme's brand design tool.
Just copy and paste your website URL and the tool will automatically extract your branding assets, such as brand colors, brand fonts and company logos. You can then apply these elements to any document in just one click.

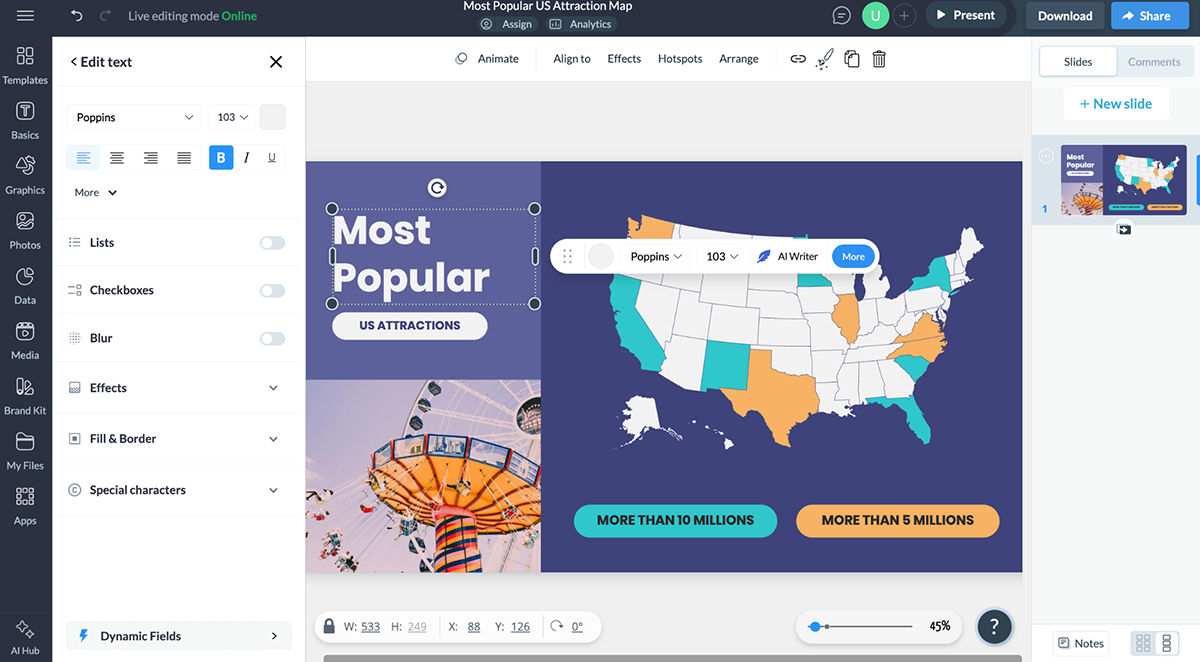
Discover America's most popular attractions with this easy-to-understand and colorful map template. The map uses bright colors and engaging designs to highlight different places. It is designed to show the top attractions in each U.S. state.
Tailor-made for travel agencies, bloggers, or tourism boards, this map offers a vivid view of each state's appeal.
So, if you're looking to share information, attract visitors, or just spread your love for travel, this template is a fantastic visualization tool for showcasing America's favorite attractions.
If you are looking for unique visuals to support your map design, use Visme’s AI image generator. This advanced tool lets you generate images, icons, illustrations, paintings and more. Just give your prompt, choose your style and watch the magic happen in seconds.
Communicate the spread and popularity of smart devices throughout Europe with this meticulously crafted map template.
You can display penetration rates, growth trends, and various other data sets related to technology usage and adoption.
Vibrant yet informative, this template aids tech researchers, marketers, and smartphone manufacturers seeking to comprehend the technological adoption patterns within this continent.
Whether you're tracking the rapid adoption of smartphones or analyzing the newest trends in wearable tech, this template offers the ideal canvas for your statistic-rich insights.
This template is ideal for social media analysts, digital marketers or educators who want to identify which social networks dominate in different countries. With its neon and black color palette, the template instantly stands out for its visual appeal.
The template supports the visual representation of intricate demographic data, allowing audiences to trace the usage of different social networking platforms across regions.
Leverage Visme's design collaboration features to maximize your experience when customizing your templates. Invite your team members via email or a shareable link and work on your documents using features like live editing, commenting, annotating and version control.
Additionally, Visme's workflow management feature allows you to manage your tasks, roles, deadlines, corrections and more from one place.
Read this article about how to do collaborative design right with Visme or watch this video to learn more.
Need a smarter way to bring geographic data to life? Whether you're mapping customer locations, visualizing field research, or creating a local guide, interactive map tools help you turn complex information into something clear, engaging and shareable.
Before we dive in, here’s a visual overview of the best online map maker available in the market.
| Software | Key Features | Pricing | Best For | Core Uses | G2 Rating |
| Visme | Interactive map generator, drag-and-drop builder, animations and interactivity, data widgets, custom design, team collaboration and workflow tool | Free; Paid plans from $12.25/month | Marketers, educators, business teams | Presentations, reports, infographics with interactive maps | 4.5 |
| Google Maps (My Maps) | Custom pins and layers, route plotting, integration with Google Drive, easy sharing | Free | General users, educators, small businesses | Personal maps, travel planning, simple interactive maps | 4.7 |
| Mapme | No-code platform, multimedia support (video, images), branding, real-time updates | Free trial; Paid from $30/month | Tourism, real estate, nonprofits | Storytelling maps, directories, events, real estate maps | 4.0 |
| Canva | Design-focused templates with map visuals, drag-and-drop UI, limited interactivity | Free; Pro from $15/month | Content creators, educators | Map-infographics, social graphics, presentations | 4.7 |
| Mapbox | Developer-focused, API-driven, real-time geodata, mobile-friendly maps | Free tier; Paid plans available | Developers, product teams | Custom maps for apps, real-time visualizations, geospatial analysis | 4.3 |
| Leaflet | Open-source JS library, mobile support, lightweight, deeply customizable | Free | Developers, GIS analysts | Embeddable interactive maps, open data projects, web mapping | 4.6 |
| ZeeMaps | Simple interface, collaboration, import/export tools, map embedding | Free; Paid from $19.95/month | Small teams, business analysts | Team planning, customer maps, quick visualizations | 4.4 |
| Proxi | Drag-and-drop editor, interactive maps with branding, visitor analytics | Paid plans from $24/month | Content creators, event planners | Local guides, curated maps, audience engagement | N/A |
| MapHub | Markdown support, custom markers, privacy controls, easy link sharing | Free, Paid plans from $8/month | Journalists, educators, storytellers | Embedding maps in blogs, media stories, and educational content | N/A |
| Maptitude | Advanced GIS and spatial analysis, territory mapping, demographic overlays | Paid license; from $695 one-time | GIS professionals, enterprise users | Business intelligence, route optimization, market analysis | 4.7 |
Visme offers an intuitive interface and an extensive suite of features for creating interactive maps. It’s so easy to use that you don’t need any coding experience, design or cartography background. You have the option to either create your chart from scratch or jumpstart your design with any of the professionally designed templates.
While testing this tool, I found dozens of pre-made layouts, map assets and design elements. Once you've selected your country or region, you can then click on the Edit This Map option in the middle of your map preview to either edit the chart data or insert your own.
In the Map Data area, you can also select the colors of various areas on your map and change them based on your information. Beyond customizing the map data, legend and color, I’m able to add images, text, assets and other design elements.
Another aspect I find incredible with Visme is that it has robust team collaboration tools. You can invite team members into your workspace to comment, edit or leave comments on your canvas. Or use our workflow feature to assign different parts of the map for others to work on, set deadlines and track their progress.
When it comes to map interactivity, Visme is ahead of the curve. I found options to show captions on hover, animate design elements, add 2D and 3D characters, hotspots and other special effects.
Next up is Google Maps, the OG of digital mapping tools that most of us have used at some point—even if just to find the nearest coffee shop.
While it’s not a design tool per se, I’ve found it incredibly helpful for creating interactive maps that are functional and widely accessible. You don’t need any design skills to get started—log in to your Google account and head to Google My Maps.
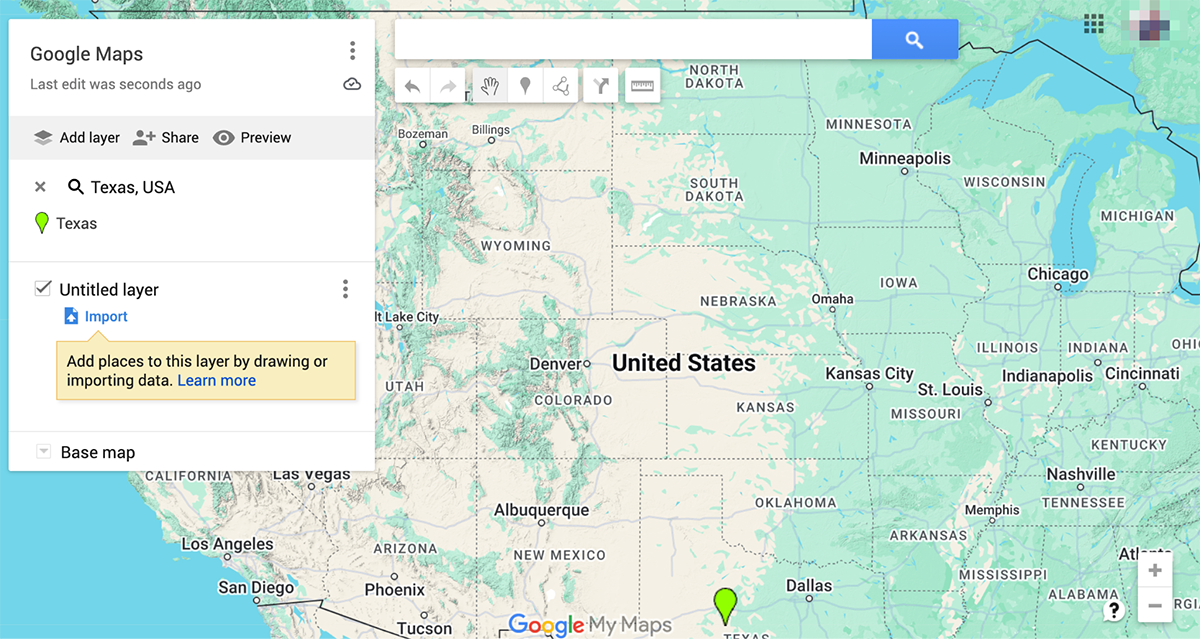
One of my favorite things about using Google Maps is how easy it is to organize locations with color-coded pins and labels. I could import a spreadsheet with addresses, and Google Maps would automatically plot them for me—a huge time-saver. I also found the option to group items into layers, which made my map more structured and easier to navigate.
For example, one layout could display or hide specific data, such as weather, traffic, photos, or borders, while the other could show restaurants and coffee shops.
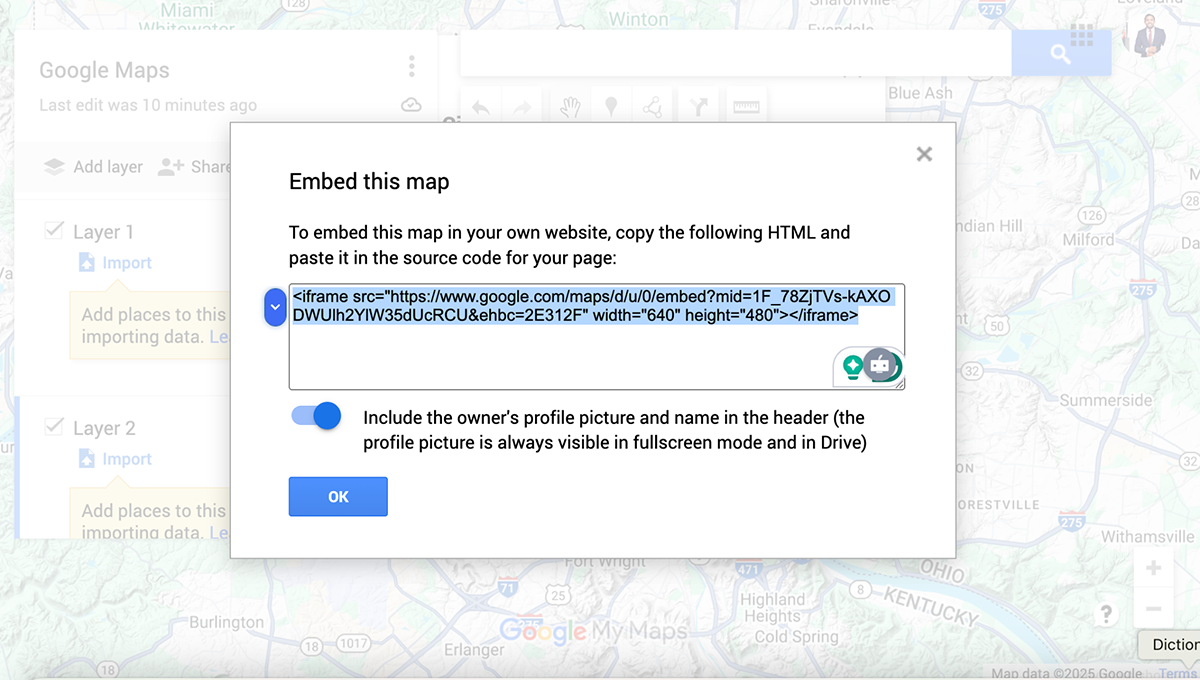
Sure, it doesn’t give you advanced design options or custom animations like Visme, but it still does a solid job. I could add descriptions, photos, and links to each location, and viewers could click on pins to learn more. After customizing the map, I simply shared the link or embedded the map on a website.
Google Maps has three pricing tiers: Essential, Pro, and Enterprise. You’ll need to use their volume calculator to get pricing per your needs.
Canva is pretty much a heavyweight in the design space. And like Visme, they’ve also got a built-in map maker that’s just as user-friendly and flexible as the rest of their tools.
I kicked things off by choosing one of their pre-made map templates (they’ve got quite a few), and from there it was smooth sailing. Each template comes with editable graphics, text blocks, and plenty of room to personalize.
Now here’s where it differs from Visme—while Visme gives you built-in maps for every country and region that you can edit based on your data, Canva takes a different approach.
The maps are more like design elements that you drag into your layout. You can resize them, layer on pin markers, arrows, lines, labels—you name it—and even throw in icons or images to make things feel more complete.
That said, I found it a bit limiting since there’s no data input feature or region-specific editing. But it’s not a deal breaker. Canva has a workaround that lets you connect to Google Maps and add real-world map visuals to your design if you need more geographic accuracy.
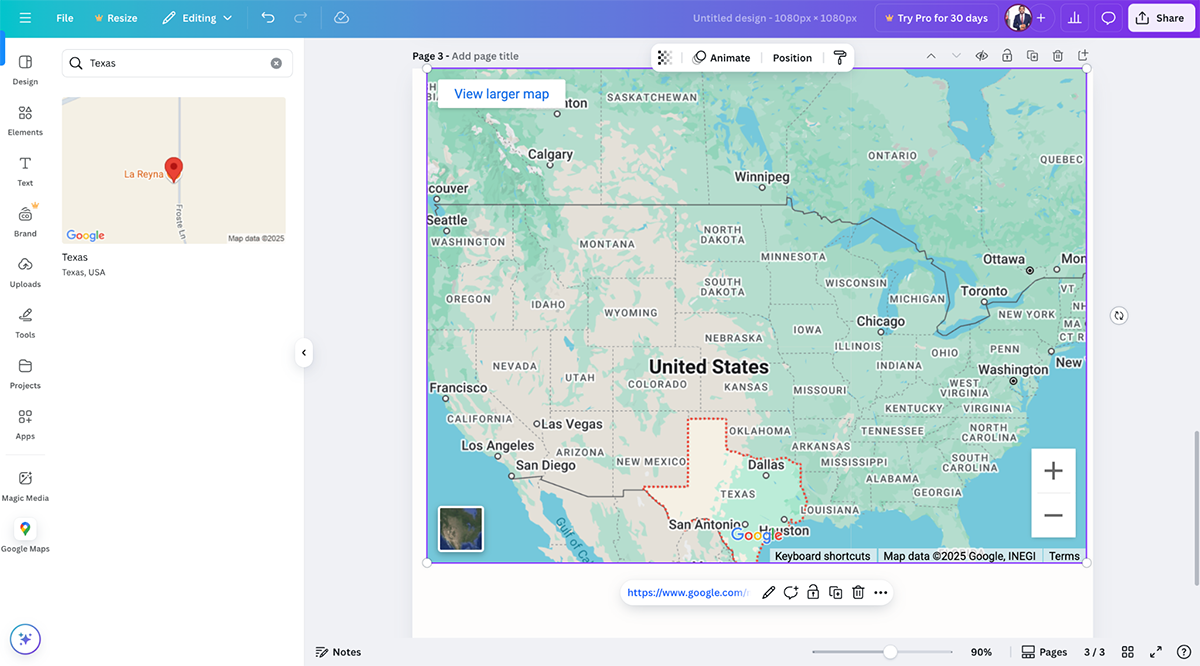
When it’s time to share, Canva keeps things simple. Download your map as an infographic, embed it in a presentation or doc, or share it online via link or social post in just a few clicks.
Leaflet is an open-source JavaScript library built specifically for creating mobile-friendly interactive maps, and it’s kind of a favorite among developers who like to keep things lightweight and customizable.
I didn’t get to test it directly like some of the other tools, but I spent time digging through their website and docs (which, by the way, are super well-organized and clear). It’s obvious this one’s geared toward more technical users. If you’re comfortable working with JavaScript and want full control over how your map looks and behaves, Leaflet is a solid pick.
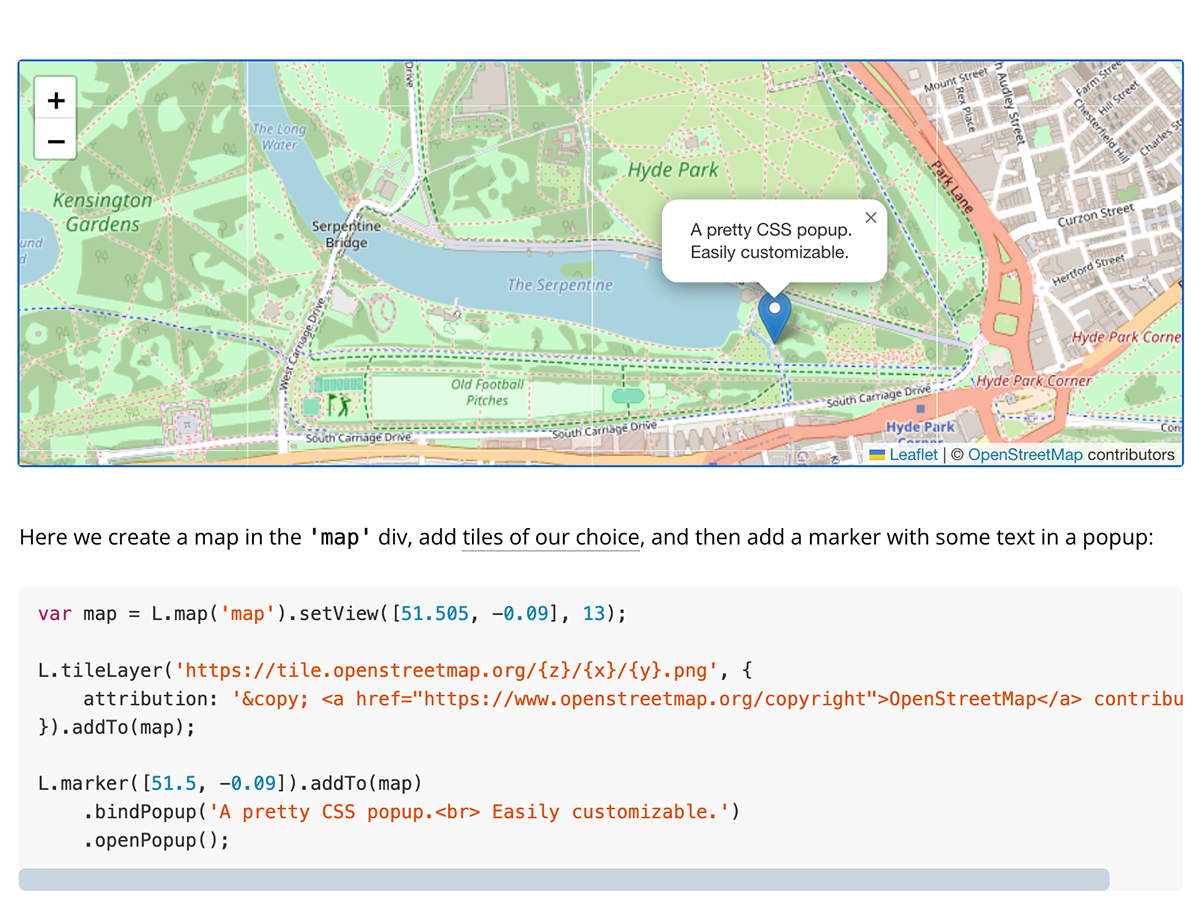
Source: Leaflet
The library itself is tiny—just 42KB—but it still covers all the essentials: map layers, markers, popups, zoom controls, and more. You can also expand its capabilities with a wide range of plugins, whether you’re trying to add heatmaps, draw routes, or customize interactions. And because it's open-source, there's a whole community of contributors constantly building and improving stuff around it.
This isn’t your average plug-and-play design tool. It’s more like a build-it-yourself kit for interactive maps. But if you’re a developer looking for performance, flexibility, and a clean API that doesn’t fight you at every turn, Leaflet’s definitely worth exploring.
Leaflet is open-source and free to use.
Mapbox is another powerhouse for building interactive maps. However, it’s a bit more user-friendly and feature-packed compared to Leaflet if you want that sweet spot between customization and good design.
Like Leaflet, Mapbox is aimed at developers, but it takes things up a notch by offering a full suite of tools, APIs, and libraries to help you create highly customizable, mobile-responsive maps.
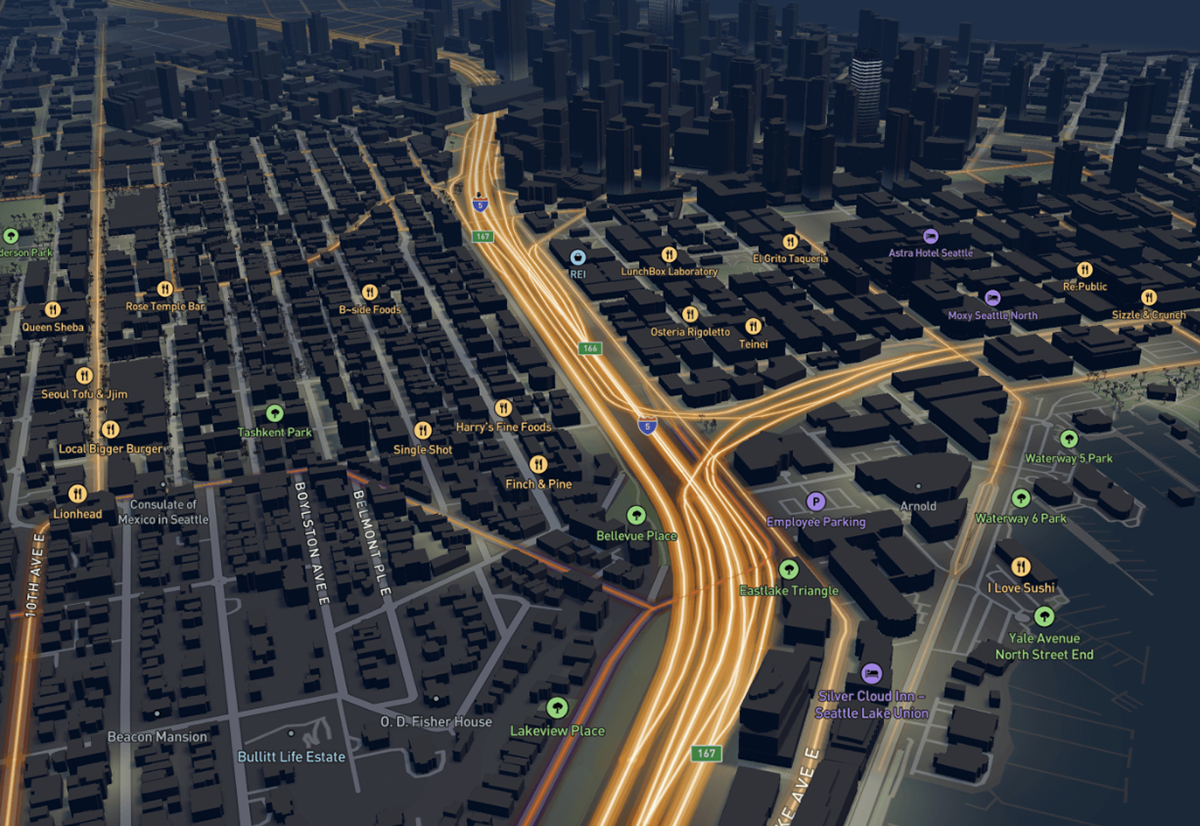
Source: Mapbox
I didn’t get to test it hands-on, but from what videos I watched and other resources I’ve read, Mapbox makes it easy to style maps, add 3D terrain, create data visualizations and even integrate geospatial data.
What really makes it stand out, though, is the design side. Unlike some developer-focused tools that leave aesthetics as an afterthought, Mapbox gives you a ton of out-of-the-box styles and design options. Their Studio tool is where the magic happens—you can play around with colors, fonts, layers, and even upload your own data.
Mapbox has free tiers for most products. Visit their page to get volume pricing based on usage.
If you want to create an interactive map without touching a single line of code, Mapme is definitely worth checking out.
It’s designed for non-techies who still want polished, professional-looking maps. I started by signing up for an account, then created a new map and was immediately able to add locations, visuals, and descriptions—no GIS or dev skills required.
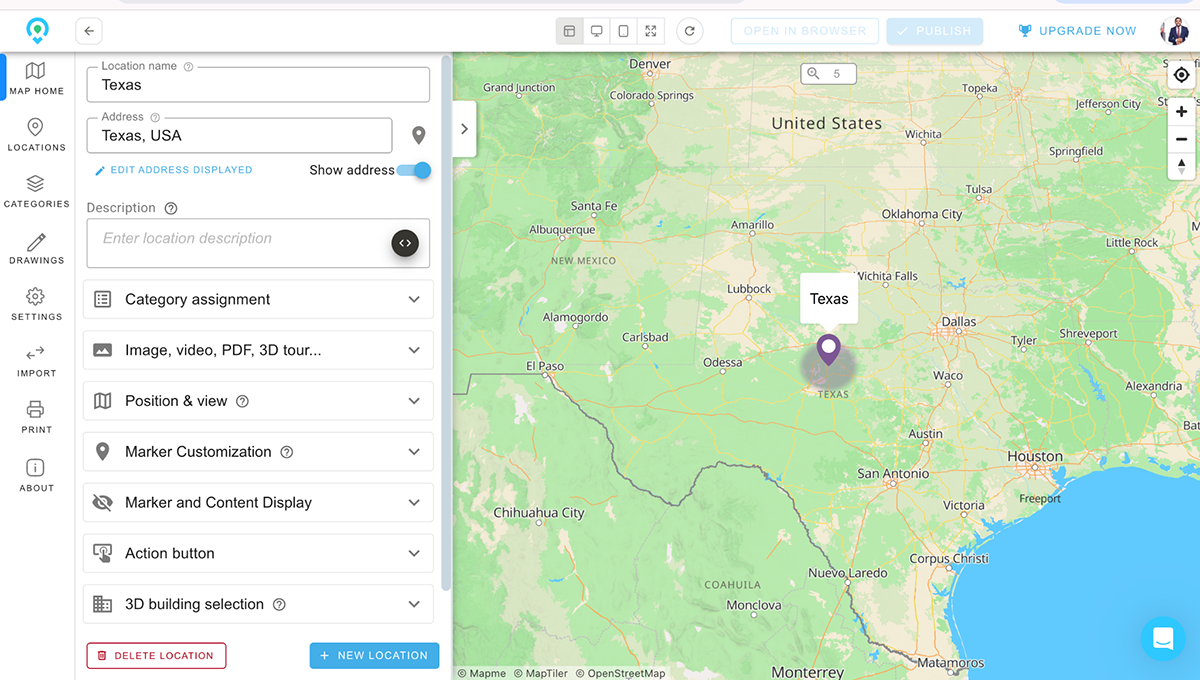
You can choose from a bunch of map styles and layouts, customize colors, and even upload your own markers. There's a cool 3D building feature, too, if you want to add a bit more depth to your design. Plus, you can add action buttons that link to external sites.
One thing I really liked? You can drop in just about any kind of media—photos, videos, audio clips, PDFs, even Matterport 3D tours. It’s perfect if you’re building a virtual experience or showcasing places in a more immersive way.
You can import data straight from a CSV or connect it to Google Sheets to add and update locations in real time. There’s even support for Google Forms, so user-generated content can flow into your map automatically.
When it comes time to share, Mapme integrates with all the big website builders—WordPress, Wix, Shopify, Squarespace—you name it. You can also blast it out on social platforms or messaging apps with just a link. And with the analytics, users can track user engagement and even measure conversions from any CTAs you embed right on the map.
Creating an interactive map is beyond about plotting points on a screen. You need to make your data come alive in a way that’s easy to explore, understand and act on.
Below are a few practical tips to help you build maps that not only look good but also tell a story, spark curiosity, and make your insights impossible to miss.
Don’t just start plotting points and hope it makes sense later. Take a moment to ask yourself: What story am I trying to tell with this map? Is it to show store locations, track user activity across regions, or visualize survey responses by state?
A strong objective will help you decide what data to include, what kind of map to use, and how to guide your viewer through the experience. Without that clarity, it’s easy to get lost in the weeds.
One of the fastest ways to lose your audience is to hit them with a map that’s covered in too much stuff—too many markers, too many colors, too many lines. It becomes noise.
Stick to what’s essential.
Use categories and filters to break up large datasets. Group pins or use heatmaps to simplify busy areas.
Remember, a clean, focused map makes your data more digestible and your message more impactful.
Interactive maps are powerful because they let users explore.
But don’t just make them clickable for the sake of it. Use interactivity to deliver the right context at the right moment.
Include helpful details in pop-ups, like sales figures, dates, or contact info. Link to external resources, images, or charts when users click on a location.
That way, you’re not just showing locations—you’re guiding users through a deeper, more meaningful experience.
A lot of people will access your map from their phone or tablet, especially if it’s shared via email, social media, or embedded in a presentation.
Make sure your map is responsive. That means no squished labels, overlapping points, or buttons that are too small to tap. Test it on multiple screen sizes.
If your tool doesn’t support mobile-friendly design, it might be time to look for a new one.
Branding isn’t just for reports or slide decks—your map should reflect your company, too.
Add a logo, use brand fonts and colors, and include a descriptive title. If your tool allows it, create a custom URL or embed the map in your site.
Make it accessible as well: give viewers a direct link or export options so they can view, download, or interact with the map however they prefer.
Interactive maps allow users to interact and access detailed information, providing dynamic and immersive experiences. Some features that make a map interactive are zoom and pan, hover effects and pop ups, markers and pins, interactive layers, search and filters, heatmaps, charts and graphs, customizable interfaces and more.
You can add an interactive map to a website using various tools and platforms.
If you want to create your own map with a data visualization software like Visme, simply choose an interactive map template, select the country or region, input your data, color code your map, customize the visual appearance, and add an interactive element. Once your interactive map is ready, you can generate an embeddable code and add it to your website.
If you want to embed Google Maps into your website, you just need to go to Google Maps, find the location you want to embed, click on the “Share” button, and select “Embed a map.” Then, copy and paste the copied HTML code into your website’s HTML file where you want the map to appear.
Another alternative is to use Google Maps API or Mapbox. However, you’ll need to sign up for an API key and then use the provided code to embed the map into your website.
Yes, Visme is an interactive visual design and content creation tool that allows anyone to create a wide range of dynamic and interactive content without coding or professional design experience.
It comes loaded with dozens of interactive features, like 2D and 3D animated widgets, icons, graphics, illustrations, shapes, characters and special effects. You can add hover effects, popups, links hotspots and transitions to make your content super engaging. Embed interactive content like polls, maps, charts, graphs, quizzes and GIFs to boost audience engagement.
Experience a new dimension of interactive storytelling with Visme’s animated 3D character creator. Select a 3D character and customize it to match your brand and story. Choose their entry, waiting, and exit animations and add them to your interactive content or website. You can find these sleek characters in Visme’s animated form builder, which has been proven to double conversions.
There are several tools that allow you to create interactive infographics, with Visme being the most popular and feature-rich option. Other tools include Canva, Piktochart, Infogram, Easel.ly, and Venngage. In this article, we’ve discussed the 17 best infographic tools for creating infographics that stand out in 2024
While both tools are user-friendly and offer a wide range of templates, Visme offers an extensive feature set for both individuals and businesses of all sizes. You can create videos, forms, presentations, ebooks, printables, data visualizations and other content types—all in one place.
Within the same platform, you also get access to animation and interactive features, including 2D and 3D widgets and characters that elevate your storytelling. The best part is that Visme provides a full suite of AI-powered features for generating images, writing high-quality text, editing photos and generating unique, customizable designs.
Ready to create an interactive map to engage your audience? Sign up or log into Visme to start taking advantage of our interactive map creator and share geographic data in a fun and engaging way.
Design visual brand experiences for your business whether you are a seasoned designer or a total novice.
Try Visme for free