The Best AI Sales Tools for 2026 and How to Choose Them

There’s a common saying in business that goes, “Know your customer.”
And yes, it's crucial for many situations, such as customer experience, sales targets, marketing and communication.
But how can you truly know your customer? One way is by conducting qualitative and quantitative research.
Qualitative and quantitative research go hand in hand to help you successfully grasp what your customer's pain points are, what they expect from your brand and what their life situations are.
The answers and results from the research are critical to making fundamental decisions for your business and your brand.
In this guide, you’ll learn how qualitative and quantitative research differ, how to formulate questions for each type, how to conduct the research and how to present the results.
Plus, you’ll discover Visme Forms, the ideal way to engage your customers with your research questions.
Qualitative research is an investigation method that explores the “whys” and “hows” of human behavior and experiences concerning a specific situation.
Instead of focusing on numbers and statistics, it dives deep into people’s thoughts, feelings and perspectives. Through methods such as interviews, observation and text analysis, researchers can uncover the nuances and complexities of any situation.
Quantitative research is a systematic investigation method that uses statistical and mathematical techniques to analyze numerical data. This approach involves collecting data through methods like surveys and experiments with close-ended questions. The data is then analyzed using statistical tools to conclude patterns, trends and relationships between variables.
Qualitative vs quantitative research methods differ in their purpose but go hand in hand when you're looking to fully understand a situation. They complement each other to give researchers a wide view of the data they need to analyze critical information.
You should conduct qualitative research if you’re looking to understand concepts, thoughts and experiences. On the other hand, you should conduct quantitative research when you want to confirm or test a hypothesis or theory.
That said, what is a common goal of qualitative and quantitative research?
Both research methods help you gain a deeper understanding of a phenomenon or topic by generating knowledge through the collection and analysis of data. They’re complementary to each other and, therefore, have a common goal.
Here are some qualitative vs quantitative research examples:
Made with Visme Infographic Maker
Qualitative business research is crucial for understanding the customer pain points, goals and expectations concerning your business.
Conducting qualitative research within your business can help improve sales and marketing funnels, create better-oriented touchpoints and even improve your employees' experiences.
In business, quantitative research is the backbone of all statistical decision-making.
Conducting quantitative research in your business is critical for determining its performance in terms of sales, distribution margins, profit and loss, ROI and demographic expansion.
To conduct a comprehensive study, researchers must ask questions using surveys, feedback forms, tests and experiments.
When it comes to qualitative vs quantitative research questions, there’s a clear distinction.
Qualitative questions aim to understand behavior and thought, while quantitative questions aim to prove hypotheses and gain numerical data.
Here are some qualitative and quantitative examples of questions to get you started.
Qualitative research questions are typically answered in sentences, long-form answers or rating systems. Start the research with a broad question and then work your way toward the details.
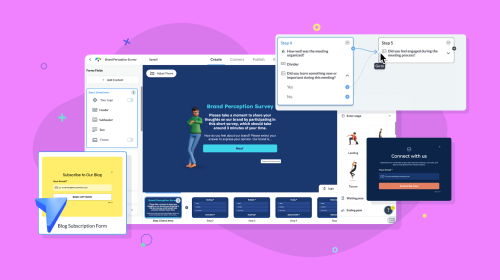
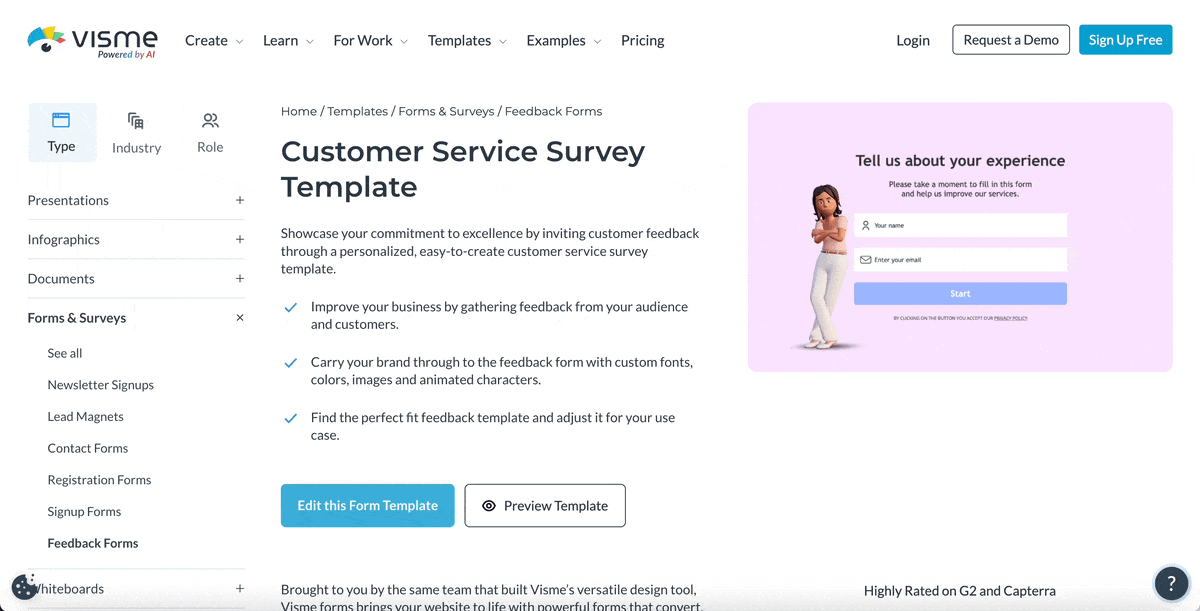
This customer service survey asks the customer about their overall shopping experience through several steps, including a rating system and personal thoughts.
Quantitative research begins with one broad question that expands into detailed numerical questions.
Let's take a look at how to conduct and analyze qualitative and quantitative data.
Before conducting any research, you must set a goal. It’s at this point that you set the broad question that you will then expand on for more detailed data. For this to work, you have to brainstorm with your team or colleagues.
Visme’s online whiteboard makes it easy to collaborate with your team during the brainstorming process.
Use sticky notes to come up with possible broad questions and then pick the best ones.
Next, draft the questions you’ll ask participants and put together more detailed questions that pertain to your main question.
Once all the questions are finalized, start building the form, survey or worksheet you’ll use to gather your data.
Here’s an example whiteboard you can use for a brainstorming session with your team:
There are two ways to gather the research data; in-person or digital (optionally anonymous).
In-person research, like interviews, focus groups, observation and experiments, is more suited for qualitative research. Some examples include:
For more efficient in-person data collection, provide researchers with a digital interactive document where they can record their findings. This can also come in handy when you need to recount important data when creating a grant proposal or a research proposal.
Use this workbook template to create a checklist-style document with your research questions and notes.
You can create this digital document on Visme and access it via a link on a tablet, mobile device or laptop. The digital worksheet should include informational interactive hotspots to help testers ask better, more nuanced qualitative questions.
Digital forms and surveys work for quantitative and qualitative research questions and can have combined questions to get a broader grasp of the situation. Typically, the first questions are quantitative and then progress to qualitative.
With a Visme subscription, you have access to an interactive online form builder that lets you create digital research forms in a variety of styles.
Create pop-up forms that collect names and emails quickly or customer feedback forms that take several steps to fill out. With the same tool, you can create lead generation forms, registration forms and contact forms.
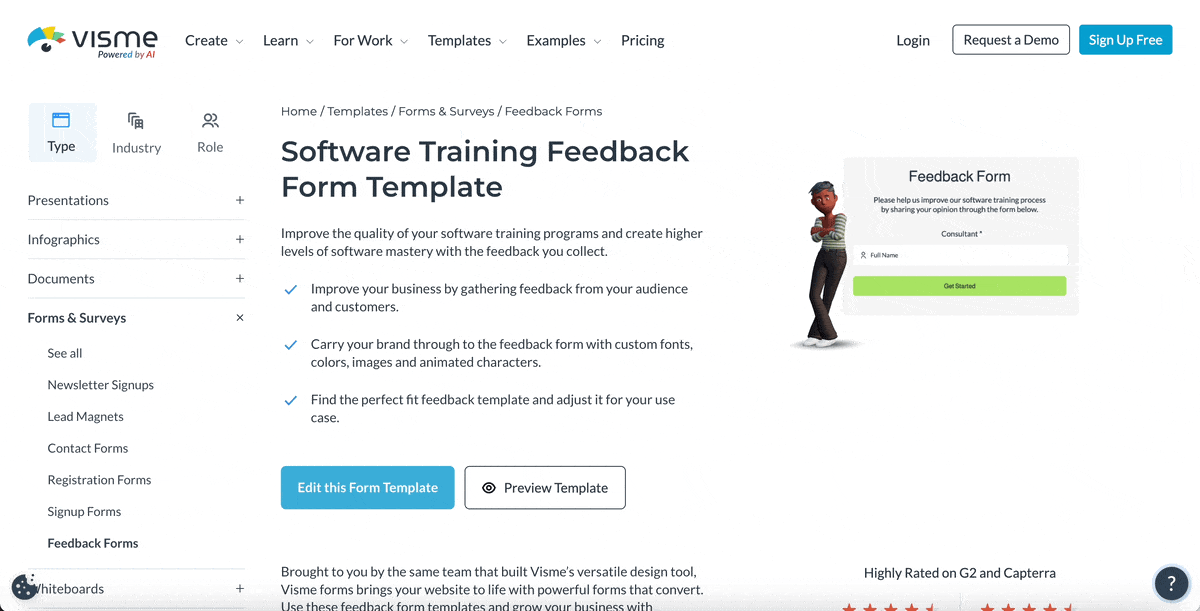
The example below is a feedback form for a software training program. The questions are both quantitative and qualitative, separated into steps.
When you create quantitative and qualitative research forms with Visme, you can design and publish forms that convert 2X better than traditional forms.
These forms come equipped with customizable animations and 3D characters that support your brand message so you can easily personalize them to match your buyer persona or ideal customer profile.
Choose from a wide variety of form templates by use case and style it to match your brand.
First, you have to publish your form to gather data. From within Visme Forms, you can share a live link or copy an embed code and insert your form into a webpage or Visme project in seconds.
Regardless of how it’s shared, a Visme form is 100% responsive and will adjust to screen size dynamically. Data collected through Visme forms is stored natively in your form analytics dashboard.
Track views, demographics, emails and form entries in an easy-to-read layout. You can also collect and store your data through multiple integrations, like Mailchimp, HubSpot and Google Sheets.
To analyze quantitative data, you typically use statistical methods to identify patterns and trends. You can calculate measures and descriptive statistics such as mean, median, mode, standard deviation and range to summarize the central tendency and variability of your data.
Conduct inferential statistics tests, such as t-tests, ANOVA, correlation analysis, or regression analysis, to test hypotheses, relationships, or differences between groups. Visualize your data using graphs, charts and histograms to identify patterns, trends and outliers.
To analyze qualitative data, you can use various techniques, such as coding, categorization and synthesis, to identify themes and patterns. Some popular tools include SPSS, SAS, R and Stata.
Qualitative data consists of non-numerical information, such as text, images, or observations, and is analyzed using thematic, content, or narrative analysis. By coding the data systematically, you can identify key themes, patterns, or categories within it. Use popular tools like NVivo, ATLAS.ti, MAXQDA and Dedoose.
One of the most important aspects of qualitative and quantitative research is presenting the data. Sharing the results with your team, higher-ups and other stakeholders is critical for growth and decision-making.
Once you have all the data collected, create a research presentation or research report and share it with relevant stakeholders.
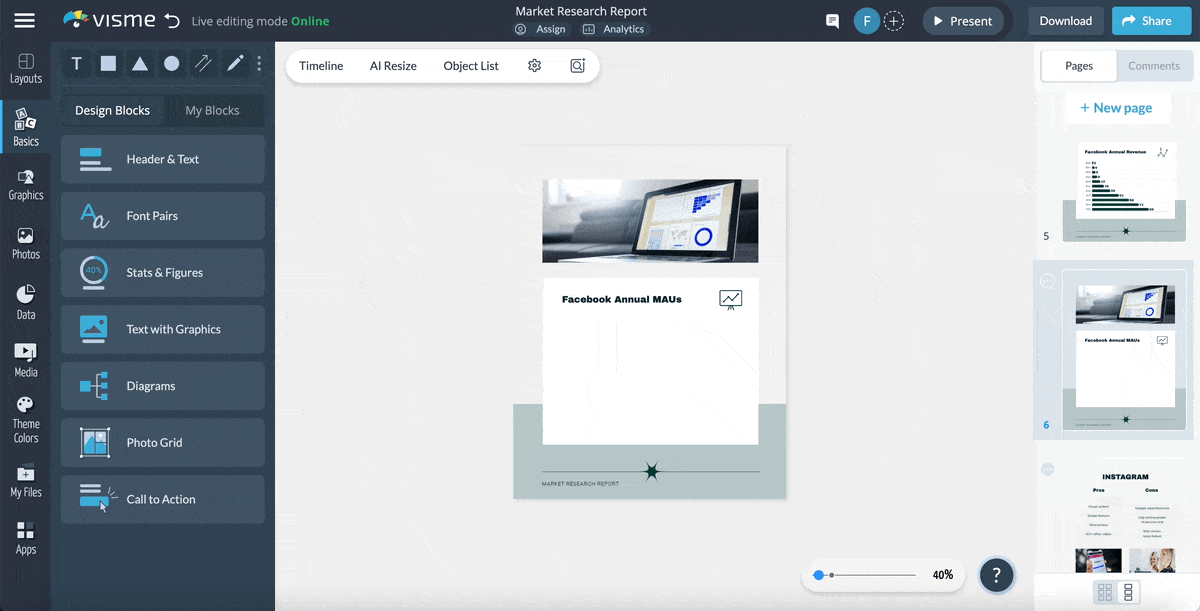
Use one of Visme’s document or presentation templates to build a comprehensive report from which to share your results and analysis.
This research report template example includes data visualizations and text blurbs about quantitative and qualitative research results.
Alternatively, you can save time creating your report using the Visme AI Report Writer, which takes a text prompt and generates a report draft in a style of your choosing.
To create other reports or documents to share your qualitative and quantitative data, the AI Document Generator will generate any type of document you need.
While working on the report together, use the workflow feature to assign specific sections to their stakeholders. Ask them to add their survey data to charts, graphs, maps and tables by connecting to a spreadsheet or filling it in manually.
Quantitative data is best represented with data visualizations, like charts, graphs and tables. Creating reports with Visme allows you to make your data beautiful, regardless of whether it's qualitative or quantitative.
When you create reports with Visme, your data can be static or live through a connection to a live Google Sheet or Google Analytics data capture.
Then take advantage of the AI Writer to help you write a concise and descriptive text that highlights your research analysis. This AI writing tool can help you summarize long analysis copy, rephrase complicated sentences or edit grammar mistakes.
Once you’re done, sharing your forms, surveys and reports is easy. Visme Forms are embeddable on websites, emails and even other Visme projects.
Reports can be shared as digital flipbook documents, interactive experiences, static PDFs or printed booklets. You can even select singular data visualizations from the report and share them on social media via the Visme social media scheduler.
Here’s an example of how a report is viewed when shared as a live Visme link.
When distributing qualitative and quantitative research reports, share them as digital Visme links. This allows you to track who opens them and from where.
Know if all stakeholders have seen the report and easily remind those who haven’t. You can track your report’s performance with Visme’s analytics dashboard.
Get inspired by Andrew Kitchner, CEO of New Wave Solutions, an employee surveying company. Andrew and his team use Visme to present surveying reports in what they call The Return to Work Sentiment Report.
CEO of New Wave Solutions
Don’t work on qualitative and quantitative research alone; do it with your team as a collaborative effort.
Create a dedicated Visme workspace where you can brainstorm, plan, and create surveys, polls and forms to conduct qualitative and quantitative research. Finally, create data reports together so that all relevant departments can double-check the information.
Use Visme’s form builder to create engaging forms that make qualitative and quantitative research easier and more effective. Personalize them and set their actions to match your brand style. Take advantage of integrated 3D characters, animations and other interactive elements to give your form personality and a unique feel.
Get started with Visme Forms today and uncover your customers’ (or your employees’) pain points, expectations and goals. You’ll see improvement in your decision-making process in no time.
Improve your data collection from emails, leads, to surveys and more, by using beautifully designed forms that convert up 2X better.
Signup Free