Proven Product Specification Examples That Give You Clear Decisions

You already know how fast a year can fly by when you’re juggling campaigns, hitting milestones, and running programs that drive your mission forward.
Your annual report pulls all of your hard work together into one complete story. It sums up what you achieved, how you made it happen and everyone who is a part of the journey.
Beyond being an opportunity to thank your community and celebrate your wins, these reports are an invaluable fundraising tool.
They boost your nonprofit’s credibility by making your wins visible and operations transparent.
But creating a great annual report can feel overwhelming, especially if you don’t have a background in design or storytelling.
In this guide, I’ll walk you through how to write and design one that truly connects with your audience. I’ll also share three inspiring real-life report examples and templates to help you replicate yours.
Let’s dive in!
It’s easy to see an annual report as just another administrative task.
After all, nonprofit teams already juggle programs, fundraising and operations.
But a yearly report is one of the most powerful tools a nonprofit can use to earn stakeholders’ trust, motivate donors and plan for the future.
Let’s look at the purpose of a nonprofit annual report.
Public trust is the foundation of every nonprofit’s success.
As the Independent Sector puts it: Without the public’s trust, everything we do to advance our collective missions becomes harder, if not impossible.”
Keeping that trust alive comes down to transparency through an annual report. When supporters can clearly see how funds are raised, managed, and spent, they feel more confident that their contributions are being used responsibly.
In fact, a special report by Give.org revealed that 54.6% of donors are more confident in charities that share detailed financial and impact information.
Donors are always excited to see the impact their support makes. An annual report does just that by linking donations to real-life results and stories that show the impact.
And when supporters see that their contributions directly lead to change, they’re far more likely to stick around much longer.
In fact, nonprofits that share impact results can significantly improve donor retention, with top-performing organizations achieving retention rates of up to 67.7%.
An annual report is a chance to tell your organization’s story—why you exist, what you’ve achieved and what comes next.
Donors remember the emotions your story evokes long after they forget the statistics. With great design and strong messaging, your report becomes a branding tool as much as a reporting one.
Your annual report is also a way to connect and motivate everyone involved in your mission—from volunteers and staff to board members and community partners. It creates a shared understanding of progress, goals and direction.
Plus, it reminds everyone that their work has purpose and that they’re part of something bigger than themselves.
When stakeholders can see how their collective efforts contribute to real impact, it builds a sense of pride and ownership.
The Stanford Social Innovation Review notes that organizations that regularly share both achievements and challenges foster stronger collaboration and trust across teams.
Lastly, an annual report is a great way to reflect on the past year before jumping into the next one. Looking back at your performance—what worked, what didn’t, and what lessons you’ve picked up—sets you up for making better choices down the line.
Plus, as time goes on, these reports turn into useful records that show your progress and help steer your strategies, budgeting, and what your team focuses on.
Here are the essential elements every nonprofit annual report should include:
Made with Visme Infographic Maker
What’s the best format for sharing your annual report? Well, that depends on your audience, communication goals and resources at your disposal.
Many nonprofits host their annual reports on a dedicated page of their website. Others produce a printed copy as well as share an online PDF.
Using both digital and printed formats can help you reach a broader audience.
Some supporters prefer browsing online, while others appreciate holding a physical copy.
Here’s a quick look at the most common formats and how they align with different goals and capacities:
| Format Type | Description | Ideal When You Have |
| Interactive Online Report | A web-based or interactive version that includes visuals, videos, data visualizations and clickable elements. | Strong design tools, a tech-savvy team and a focus on storytelling and engagement. |
| Downloadable PDF | A professionally designed report that can be shared via email, website, or print. Ideal for grantmakers and donors who prefer a traditional format. | Limited time or budget but a need for something quick, eye-catching, and shareable. |
| Printed Report | A physical booklet or brochure that conveys credibility and permanence. Often distributed at events, galas, or board meetings. | A strong print budget or donor base that values tangible materials. |
| Microsite or Dedicated Web Page | A page (or small site) showcasing annual highlights, videos and impact stories for easy public access. | A web development resource and the goal to increase discoverability and engagement. |
| Infographic Summary | A nonprofit one pager or visual summary that highlights key numbers and impact stats in a digestible format. | Limited time and budget but a need for visually shareable content. |
| Video Annual Report | A short video (2–4 minutes) that blends footage, interviews and data to tell your nonprofit’s story. | Visual assets, storytelling expertise, and a goal to connect emotionally with audiences. |
| Email or Newsletter Series | A multi-part email series breaking down highlights of the annual report throughout the year. | A strong mailing list and the goal to sustain engagement over time. |
Most nonprofits treat reports as just another box to check at the end of the year.
A well-crafted annual report can do far more than summarize a year’s work. In this section, I’ll show a few underrated strategies to use an annual report to your advantage:
Share your annual report with current and potential donors, grantmakers and corporate sponsors. It provides tangible proof of your impact, stewardship and evidence-based pitch for continued support.
For instance, Charity: Water’s annual report helped secure multi-year corporate sponsorships and partnerships by clearly mapping project outcomes to donor contributions.
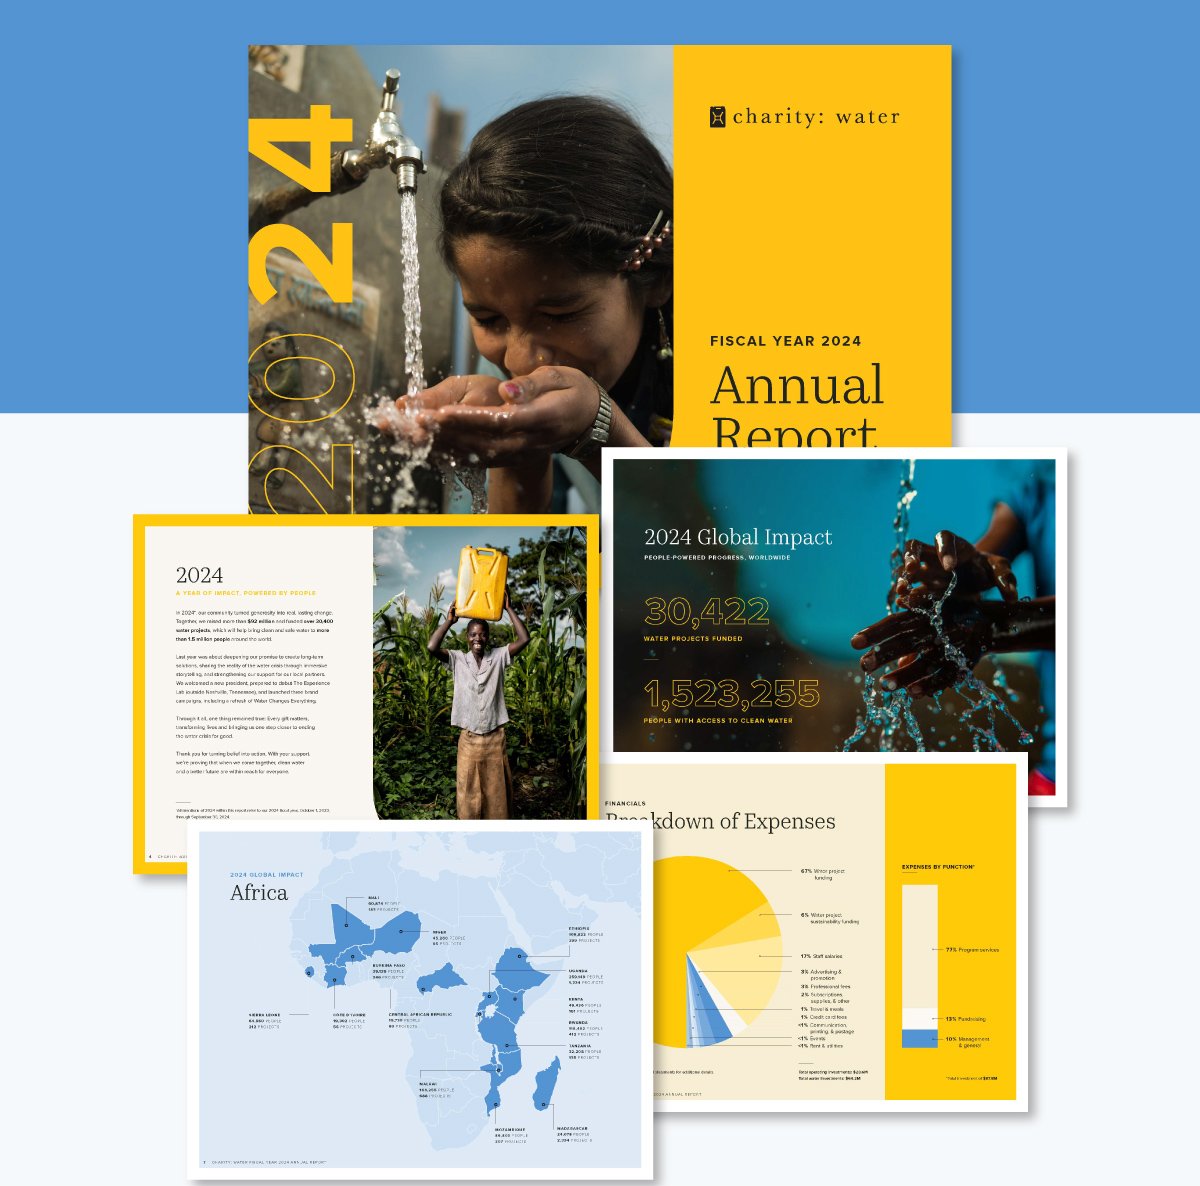
Source: Charity: Water
The stories, visuals and impact metrics in your annual report can easily be repurposed for newsletters, social media posts, campaign pages and donor presentations.
Instead of treating it as a one-off publication, think up ways to use those stories year-round to support your fundraising appeals and campaigns. This keeps your message consistent while extending the shelf life of your content.
One standout example is the World Wildlife Fund (WWF)’s 2024 annual report. Across multiple pages, you’ll find vivid imagery of wildlife and ecosystems along with data and stories. These visuals and content (photos, stats, quotes) can be extracted for social media or email campaigns.
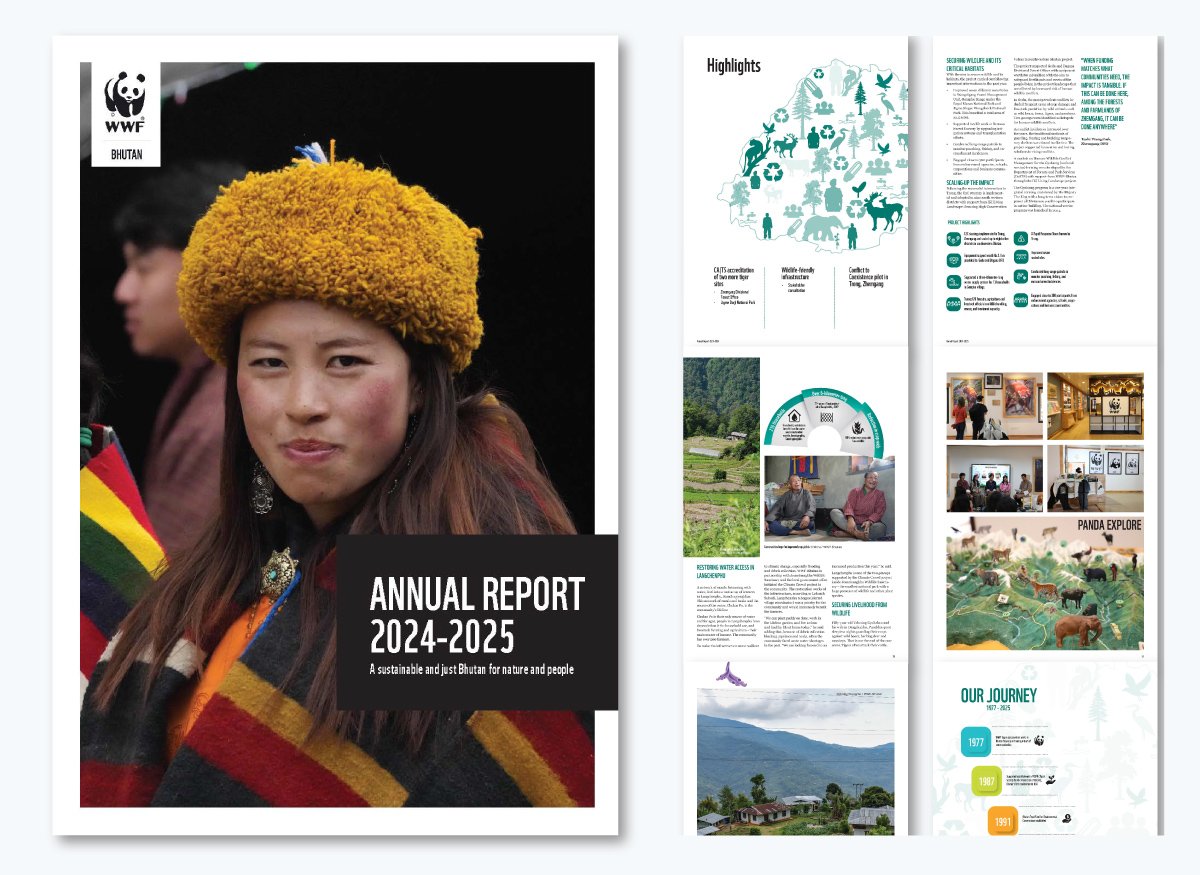
Source: World Wildlife Fund (WWF)
Your annual report is a powerful conversation starter with potential partners, sponsors, and community allies. When you highlight your impact, achievements, and goals for the future, it really opens the door for collaboration. People can easily see how their work aligns with what you’re doing.
Follow these steps below to write a nonprofit annual report that stakeholders look forward to:
Before you start writing, take time to collect everything you’ll need to tell a complete, accurate story about your year.
Start by pulling together key information from your organization’s departments: program outcomes, fundraising totals, volunteer hours, event highlights and financial summaries.
Include both numbers and narratives. The metrics show what you accomplished, while the stories behind them show why it matters.
Don't hesitate to reach out to program leads, communications staff and even volunteers for different perspectives on the year's work.
You might uncover small stories or moments that illustrate your mission in ways that numbers alone cannot.
It’s also a good idea to revisit your organization’s goals from the previous year.
What did you set out to do? What changed along the way? And where did you make the most meaningful progress?
Answering those questions early ensures your report stays focused on outcomes rather than just activities.
Finally, gather quotes, testimonials and photos from the people you serve. These genuine voices add authenticity to your report and help readers connect emotionally with your work. Gather all of these insights in a library so you can reference them when needed,
Beyond internal data, research external sources that add context to your achievements.
Reference relevant studies, reports or national statistics to show where your work fits within the larger social or environmental landscape.
For example, if you’re focused on youth development, look at national trends in education or child health to highlight the need for your programs. If you work in environmental advocacy, reference the latest research on sustainability or climate impact in your region.
These comparisons help donors and partners see how you’re tackling real-world problems.
You can also take a peek at last year’s report or similar publications from other nonprofits. You might pick up some fresh ideas on how they communicate their impact and figure out better ways to present your own data.
As you gather your info, keep organized notes and note down your sources. This keeps things accurate and transparent for when you need to cite data later. Consider using spreadsheets or shared folders to keep everything tidy, especially if other team members are pitching in.
Before diving into writing, it’s a good idea to create an outline to give your annual report some clear direction and structure.
Start with the main sections, like your intro, impact highlights, financial overview, stories or spotlights and future goals. Then, jot down a few bullet points under each section to summarize what you want to cover. For instance, under Impact Highlights, you could include key stats, standout projects or a quick success story.
If you’re collaborating with a team, this is a great stage to share your outline and get some feedback before you jump into the full draft. You can even use Visme’s AI Writer to help generate a first draft of your outline or to organize your thoughts based on your nonprofit's goals.
Once you’ve gathered your data and built an outline, it’s time to start writing.
Here’s how to approach your report.
Numbers don’t mean much without context. Donors and partners want to understand why your results are important, not just the numbers themselves.
When you toss out figures like meals served, homes built or students supported, explain what those stats actually mean in real life. Show how they helped advance your cause or initiatives.
For example, in the National Philanthropic Trust’s 2023 annual report, they highlight a big number — over $4.5 billion in grants to 36,000 nonprofits. And then immediately follow it up with a quick story about how unrestricted funding lets nonprofits adapt and respond as needed.
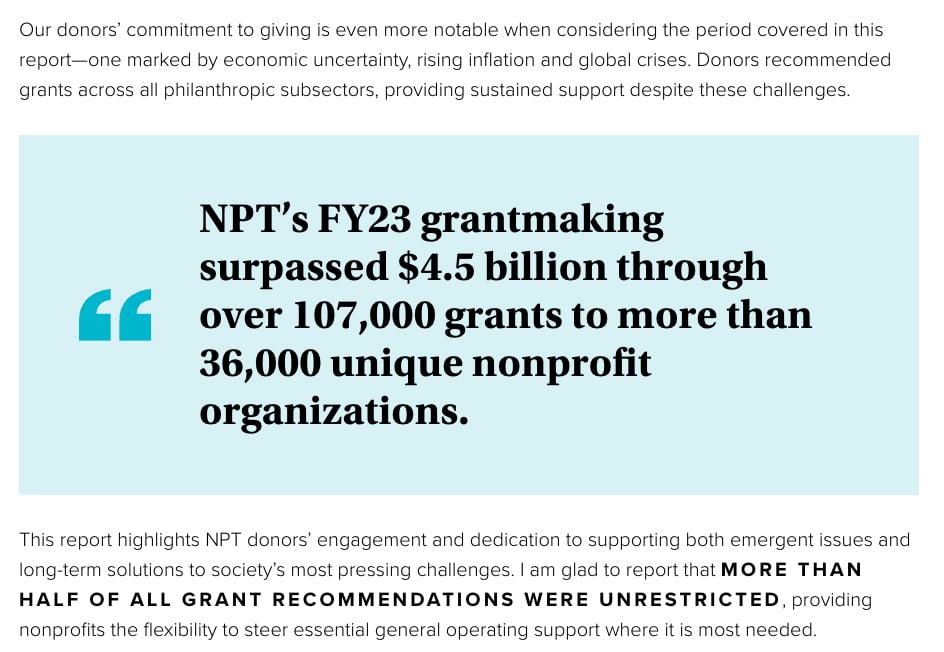
Source: National Philanthropic Trust
Your annual report is a story of your journey through the past year.
It’s where you need to discuss these: What hurdles did your organization face? What milestones did you hit? What lessons did you pick up along the way?
Instead of listing achievements, reveal what they meant for the people and communities you serve.
I particularly love how Philanthropy Together‘s annual report uses an interactive, digital format that unfolds the year’s work as chapters.
As you scroll down, the report moves from Welcome to Showcase, then to Scale, then to Strengthen and finally to Sustain. Each of these chapters unfolds a different part of their strategy.
Plus, you’ll find icons, logos, videos, photos and charts that make the report a beauty to behold.
Source: Philanthropy Together
Your report doesn’t have to sound stiff or overly corporate to earn trust. Use a tone that feels true to your organization. Celebrate your wins, but don’t shy away from acknowledging challenges or areas for growth.
Instead of cramming in every event or campaign, focus on the stories that best capture your organization’s impact.
People want to connect with the meaning behind your work, not just a rundown of what happened. Go for quality over quantity and spotlight the programs that made the biggest difference this year.
Quotes from volunteers, donors or beneficiaries can make your report more credible and relatable A short story or testimonial helps readers see your impact through the lens of real people — the ones living the change you’re creating.
Girls Who Code’s 2024 Annual Report is full of authentic voices from its community. It features short quotes from both corporate partners and students, placed right alongside photos and project highlights.

Source: Girls Who Code
Partners like IBM, Synchrony and Apollo Global share why they support Girls Who Code, while students talk about their favorite “sisterhood moments” and how learning AI or coding changed their confidence. These snippets add credibility and make the report feel human, conversational and deeply mission-driven.
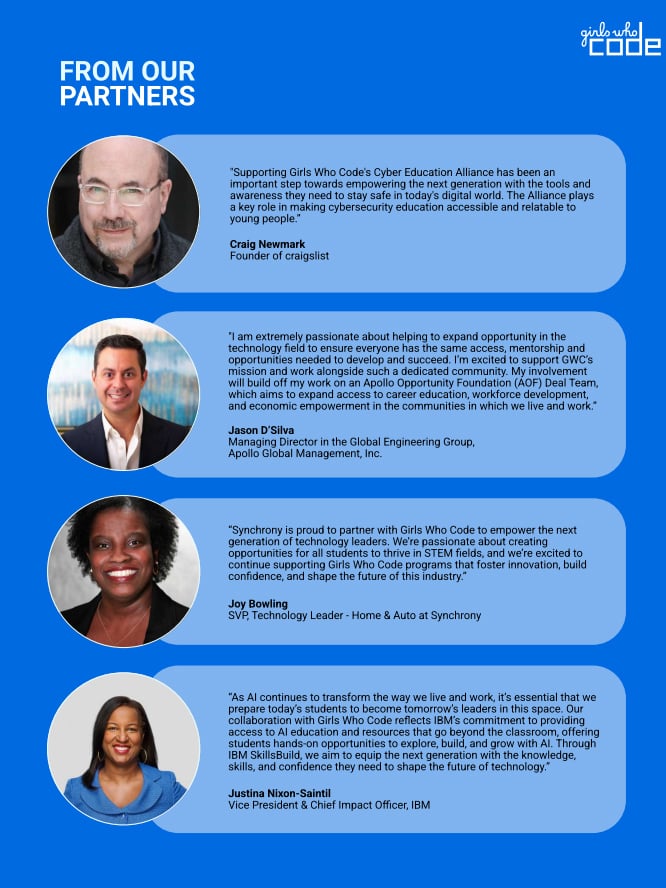
Source: Girls Who Code
Every section should naturally lead somewhere—whether it’s gratitude for supporters, lessons learned or a preview of what’s next.
This helps maintain flow and keeps the reader engaged from beginning to end.
Beyond outlining, you can also use Visme’s AI Writer to help you structure sections, summarize data or rework dense text into something more compelling.
Once the first draft is complete, it’s time to step back and refine.
Reread the report with fresh eyes. Does the story flow naturally from one section to the next? Do the facts and figures match your organization’s official records? Are the transitions smooth enough that someone unfamiliar with your work could easily follow the story?
After reviewing on your own, bring your team or other stakeholders into the process. This might include a board member, a long-time donor, a program lead or even a volunteer who’s closely involved in your mission.
This is where Visme’s collaboration tools really shine. Multiple team members can leave comments, suggest edits and track feedback in real time, right inside the project. You can assign specific sections to program leads, fundraising staff, or communications teammates to review.
Visme’s workflow management tools help keep the editing process organized.
You can set review deadlines, monitor progress and manage approvals from leadership or board members before the report is finalized. No long email threads or version confusion—just one centralized workspace where everyone stays in sync.

Once the content looks good, turn your attention to language and tone. Use grammar and readability tools like Grammarly or Hemingway Editor to clean up the text.
Finally, give the report one last thorough read to ensure everything is consistent.
Double-check that numbers, dates, and quotes are accurate, visuals are labeled correctly, and every section supports your main story. Also, make sure attributions are spot on and that any data sources or references are clearly noted.
Once the content is verified, share the final draft with your leadership team or board for review.
Once everyone’s on the same page and the content gets the thumbs up, it's time to dive into the fun part—designing your annual report.
Good design really influences how people perceive and engage with your report.
Let’s show you how to design an annual report that helps readers connect emotionally and understand your impact at a glance.
Start by deciding what kind of annual report format best fits your audience and resources.
Do you want a nonprofit annual deck for formal presentations or a printed report for donor mailings or a digital version that can be shared online? You might even consider doing all three!
Printed reports feel personal and tangible.
But with digital or interactive annual reports you can include animations, videos, clickable charts and links to additional content.
With Visme, you can create both versions from one project, and then adjust the layouts for either print or web.
Think about how your readers will get the report — will they see it at an event, get it via email or come across it on social media? Choose a format that will make your report easy for them to access.
Once your content is outlined, it’s time to decide how it will flow across pages or screens.
A solid report layout helps readers move naturally through your story and understand what’s most important without feeling overwhelmed.
Begin by establishing a clear visual hierarchy. Your structure should make it instantly clear what to read first, second and last. Even the busiest reader should be able to find the highlights quickly.
Use larger headings for main sections, bold subheadings for supporting ideas and consistent text styles for body copy.
Don’t forget to balance text with visuals. Too much copy can feel heavy, especially in sections filled with data or updates. Break up long paragraphs with charts, icons or photos that illustrate your points. This keeps the report engaging and easier to skim, especially for online readers who tend to glance over content before diving deeper.
Keep whitespace in mind, too. Empty space isn’t wasted space; it gives your design breathing room and makes your message easier to process. Resist the urge to fill every inch of the page.
If you want to dig deeper into visual hierarchy and discover all the details, read our guide on the 12 Visual Hierarchy Principles Every Non-Designer Needs to Know.
Use grids and alignment tools to structure each section consistently.
Start with one of Visme’s predesigned annual report templates, then customize it with your organization’s brand colors, fonts and visuals. This gives you a solid base to work from, but it also lets you add your own personal touch to the design.
If you’re pressed for time or just not feeling inspired, Visme's AI report generator can help you whip up impressive reports in no time. Just give it a clear description of what you're looking for, and watch it all come together effortlessly.
There’s a reason all the annual report examples we’ve seen are packed with visuals.
Great visuals are the secret sauce of any great report. They elevate your annual report from boring to engaging.
‘For nonprofits, pictures and graphics aren’t just decorative. They actually help tell your story and create a connection with your audience.
Use real photos that capture your community, volunteers and the work you do. Candid moments work better than stiff, staged shots or generic stock images.
When you’re sharing data, skip the plain spreadsheets. Transform those numbers into fun visuals that are easy to digest and look great.
Charts, graphs and infographics let your readers quickly understand what you’re trying to show.
And don’t skip out on icons, illustrations, and maps to explain more complex ideas.
A map can show where your nonprofit made an impact and icons can make those boring stats digestible.
Garr Reynolds, Author of Presentation Zen, recommends keeping things simple.
“The only rule concerning the display of data—besides telling the truth—is simplicity. You can achieve simplicity in the design of effective charts, graphs, and tables by remembering three fundamental principles: restrain, reduce, emphasize.”
Tools like Visme give you a massive creative edge. You can create eye-catching visuals that match your organization’s vibe and keep everything looking unified.
The platform offers millions of stock photos, icons, illustrations, charts, maps, widgets and characters, all searchable and ready to use.
You can even create your own custom visuals with Visme’s AI Image Generator, which lets you generate images from text prompts.
And remember, visuals can set the mood too. Bright colors can give off a vibe of energy and optimism, while softer colors can create a sense of trust and calm. Choose visuals that really capture what your organization is all about, not just your logo.
A consistent visual identity is what connects your report to everything else your nonprofit puts out — your website, social media, event materials and donor communications.
Start by applying your brand’s core elements: logo, color palette and typography. Use them consistently across pages to keep the design unified from start to finish.
But consistency is about more than just visuals. It includes the way you write, the types of photos you choose, and even the icons you use.
For instance, a foundation for children's health might opt for bright colors and rounded icons, while a conservation group could go for earthy tones and sleek, minimal fonts.
In order to garner donations, supporters must be able to trust the organization they’re contributing to. When nonprofits publish reports that are poorly designed, unprofessional, and don’t match their organizational brand, supporters can question the validity of an organization. Well-designed annual reports help build trust, and remind readers of your mission." - Josh Kligman, CEO of Storyraise
If you’re working with a team, brand alignment becomes even more critical. Visme’s Brand Kit can help by storing all your fonts, colors and logo variations in one place. This ensures that everyone — from designers to program staff — uses the same assets and keeps the report visually cohesive.
Great design isn’t just about looking good. It’s about being easy to read and accessible to everyone. A beautifully designed report that’s hard to navigate or difficult for some audiences to access misses the point.
For readability, choose fonts that are legible and consistent.
Use larger font sizes for headings and enough line spacing to make text comfortable on the eyes.
Stick to one or two typefaces throughout your report to keep it clean and professional. Avoid cluttered layouts or large blocks of text that might overwhelm readers.
Pay attention to contrast, too. Make sure there’s enough difference between text and background colors so everything remains easy to read, both on screen and in print.
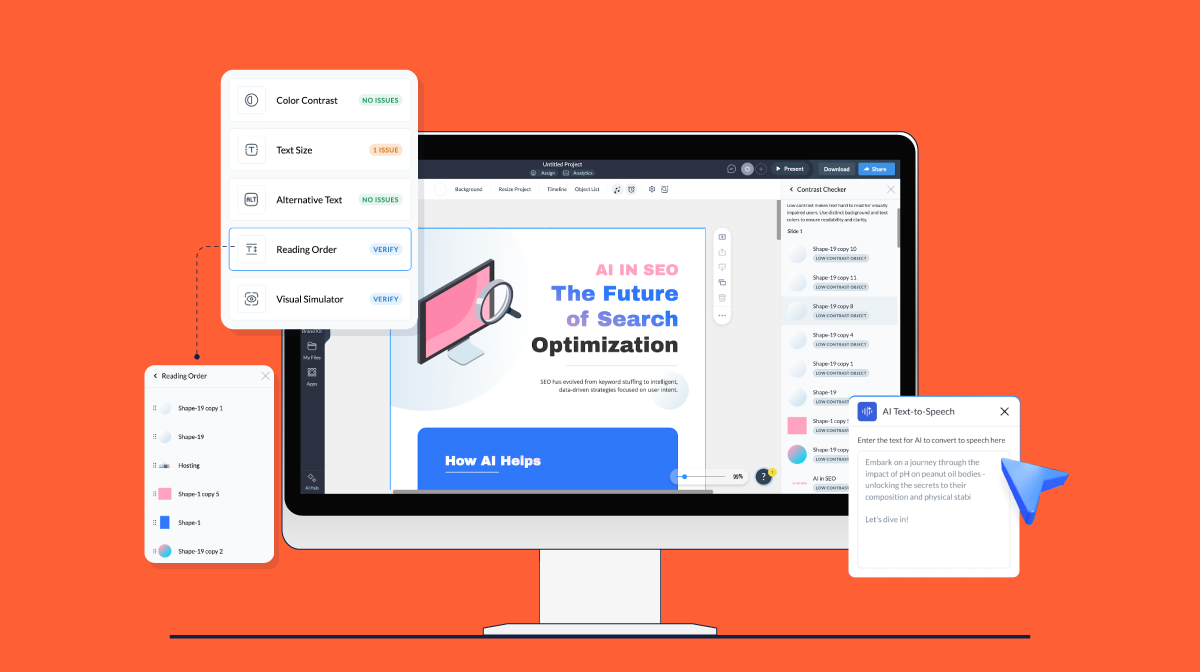
To make your design accessible to everyone, use tools that help you check and improve inclusivity.
Visme’s Accessibility Checker is explicitly built to ensure your report meets accessibility best practices. It automatically reviews your design and flags potential issues, helping you create a report that everyone can enjoy.
With these handy features, you can confidently design reports that are not just beautiful but also easy for everyone to engage with. Whether readers are on a laptop, tablet or phone, your content will remain accessible and enjoyable.
For longer reports, adding visual signposts—icons, section dividers or sticky navigation menus — helps readers keep track of where they are.
With interactivity, there’s a 94% increase in content views compared to boring old PDFs.
Instead of quickly scrolling through pages, your readers will click around and explore what you've built. This means your important messages have a lot more time to sink in and make a lasting impression.
If you’re creating a digital or online version in Visme, there are many different ways to incorporate interactivity into your report:
Once your interactive version is ready, make it easy to share. Add social share buttons or create mini-infographics and highlight snippets that link back to the full report.
These bite-sized visuals work perfectly for emails, donor newsletters or social media.
If you’re producing both print and digital versions, keep the experience consistent. Add a QR code inside your printed report that links to the interactive online version so readers can dive deeper into videos, donor stories or detailed financials.
Before publishing your report, take one last look to make sure everything works together.
The final design review is your chance to check that visuals, text and data are consistent, accurate and on-brand.
Start with a full visual sweep. Review alignment, spacing and image quality to ensure everything looks clean and professional. Check that your charts and infographics are labeled correctly and that numbers match the data from your finance or program teams.
Next, test functionality. If your report is digital, click through every interactive element(buttons, links, videos and hover effects) to make sure they load correctly. In Visme, you can preview your report across desktop and mobile to see exactly what readers will experience before you publish.
Once everything checks out, export your report in the formats you need.
With Visme, you can share and publish your report in a lot of different ways. Download your report in multiple formats such as PDF, PPTX, SCORM, xAPI and video formats. For digital reports, generate an HTML code to embed it on your website or share it as a live link.
While working on this piece, I found some of the best nonprofit annual reports from the past few years.
They’re beautifully designed, deeply engaging, and, most importantly, they clearly show the impact each organization has made.
And each one captures the heart of their mission through visuals, data and real human stories.
Below, you’ll find three of the best nonprofit annual reports along with annual review templates you can use to achieve similar results.
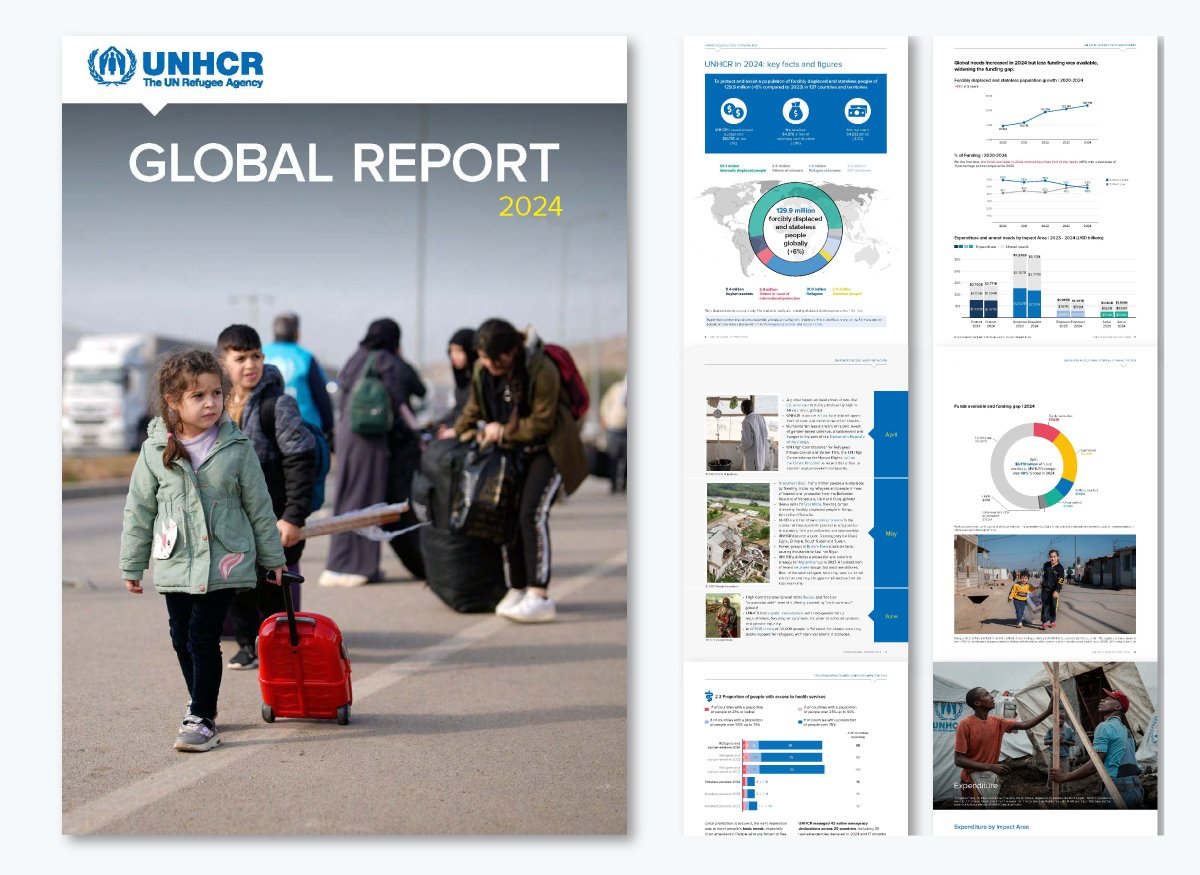
Source: UNHCR
Our first example comes from the UN Refugee Agency (UNHCR). Their 264-page report strikes the perfect balance between depth and readability. It starts with a striking cover image, followed by a clickable table of contents that makes navigating the rest of the report a breeze.
Content-wise, it’s a comprehensive review of UNHCR’s activities and results for the year.
It opens with a summary of key facts and figures, including how the agency was funded, how forced displacement and statelessness evolved during the year and how UNHCR responded and what challenges they faced.
Throughout the report, there’s a healthy balance between text and visuals — colorful charts, maps, icons and photos of refugees, field projects and programs. I especially love how they’ve organized the content into bite-sized blocks and bullet points, making it easy on the eyes and accessible for a wide audience.
Here’s a Visme template to help you replicate this type of report.
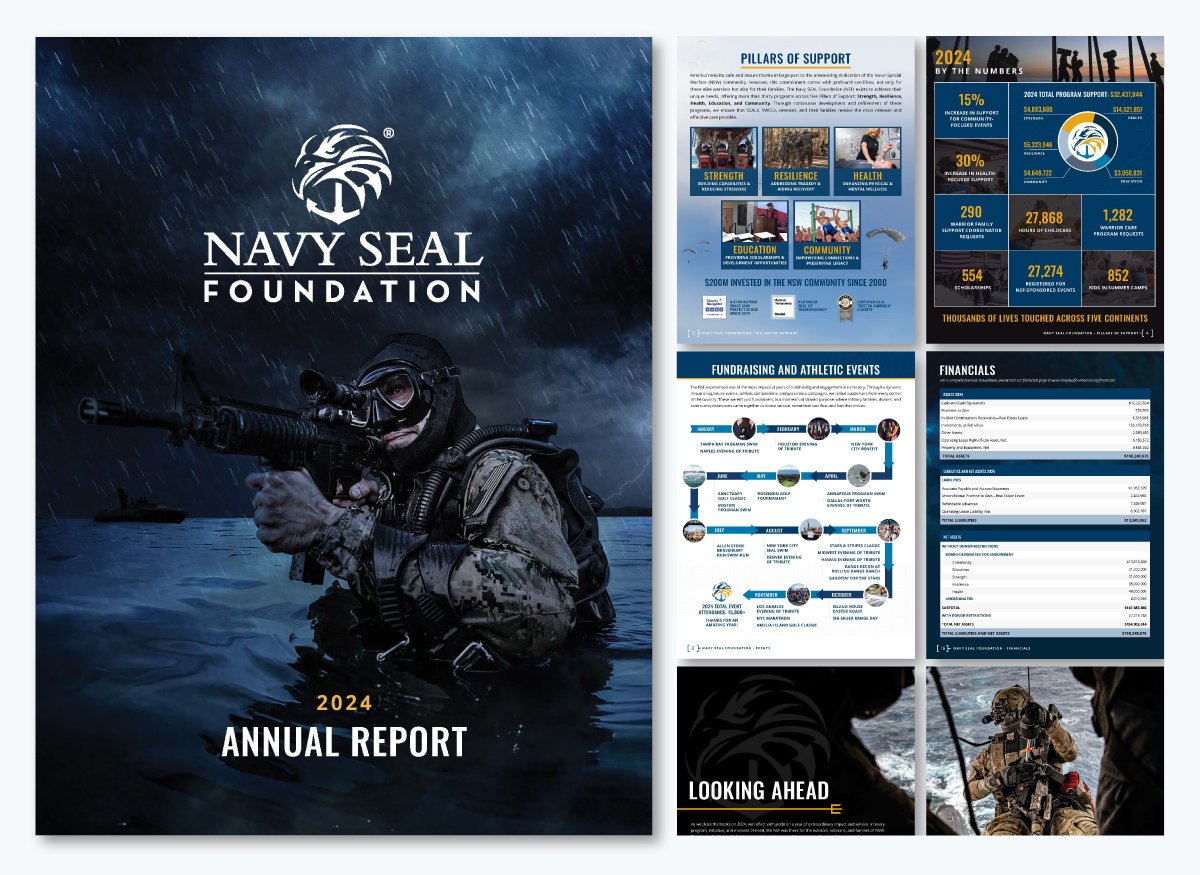
Source: Navy SEAL Foundation
The Navy SEAL Foundation’s 2024 annual report delivers everything you’d expect from a well-produced publication — clean design, emotional storytelling, and data that’s easy to understand. It opens with a bold cover image of a Navy SEAL, followed by a neatly organized table of contents and opening messages from the Chairman of the Board and the CEO.
A highlight of the report is the “2024 by the Numbers” section, which uses an infographic to summarize key achievements and financial highlights for readers who prefer a quick overview. The 20-page report is packed with strong visuals, from partner logos and event timelines to flowcharts and photos that capture the Foundation’s mission in action. There’s also a link to view the full financials online for those who want a deeper look.
This report captures what the Navy SEAL Foundation stands for. The deep blue theme and bold imagery give the report a sense of strength and purpose that fits the mission perfectly. You can tell real thought went into how the story is told, not just the numbers shared. It feels personal, intentional, and genuinely connected to the people behind the cause.
You can create something similar using this ready-made Visme template.

Scrollable reports and static PDFs aren’t the only formats nonprofits can use.
This nonprofit annual report example from the Children’s Healthcare of Atlanta Foundation takes a completely different route. They’ve created a digital book that really stands out and is packed with soft animations, bright illustrations, and a playful yet professional layout that feels full of life. It perfectly reflects their mission of helping kids live healthier, happier lives.
The report feels personal without losing substance. It shares stories that tug at your heartstrings and gives a transparent view of how the organization uses its resources.
There are spotlight features on young patients and valuable supporters, complete with photos and quotes that add a nice touch of warmth and authenticity.
A detailed financial breakdown clearly shows how both general revenue and funds from their $1 billion capital campaign are being used to expand care and build new facilities. The report wraps up with a simple, heartfelt call to action that invites readers to join the community’s mission.
This report proves that financial transparency can be both beautiful and humane. The CHOA Foundation turns complex information into something bright, clear, and deeply connected to its purpose. Every page captures the optimism behind their work, reminding readers that good design can help people feel the impact of a cause, not just read about it.
Use this Visme template as a starting point and incorporate interactive features to design a report with the same look and feel.
| Tool | Key Features | AI Capabilities | Pricing | Best For | G2 Rating |
| Visme | Professionally designed templates, drag-and-drop editor, interactive elements (hotspots, pop-ups, animations), data visualization, brand management tools, collaboration and analytics. | AI Writer, AI Presentation Maker, Brand Wizard for automated branding, AI Image Generator, AI text generator | Free plan; paid plans start from $12.25/month | Nonprofits creating interactive, data-driven reports with visuals and storytelling. | 4.5/5 (455+ reviews) |
| Storyraise | Story-based builder for visual narratives, built-in themes, analytics dashboard, multimedia embedding (videos, photos, audio) and drag-and-drop editor. | N/A | Free trial; paid plans start from $5990/year | Storytelling-focused nonprofits highlighting human impact and donor stories. | N/A |
| Canva | Templates for reports, infographics and social graphics, drag-and-drop design, team collaboration, brand kit, stock media access and data charts. | Magic Write (AI text generator), Magic Design (auto-layout) and AI background remover. | Free plan; Paid plans from $15/mo | Nonprofits needing fast, branded visual reports and easy team collaboration. | 4.7/5 (6000+ reviews) |
| Marq (formerly Lucidpress) | Brand templates, smart fields for personalization, locked branding controls, cloud collaboration and publishing tools. | AI-powered brand management | Free plan, paid plans start from $10/month/user | Nonprofits managing multiple chapters or departments that need consistent branding. | 4.4/5 (200+ reviews) |
| Adobe Express | Templates for reports, posters and infographics, brand management tools, image and video editing and stock media. | Adobe Firefly for AI-generated images, text effects and content suggestions. | Free plan; paid plans start from $9.99/month | Creative teams producing branded visual assets and report graphics. | 4.5/5 (680+ reviews) |
A nonprofit annual report is a yearly publication that shares what your organization has accomplished, the impact you’ve had, and how you’ve managed your finances. It shines a light on your main programs, the results you’ve achieved, and how donations were put to good use to further your mission.
Beyond just being transparent, it tells your organization’s story, builds trust with supporters, celebrates the people who supported your mission and encourages future donations.
There’s no strict rule, but most effective annual reports fall between 8 and 20 pages or the digital equivalent.
The goal is to communicate your achievements clearly and keep readers engaged. Many nonprofits now prefer shorter, interactive online reports that combine visuals, video, and storytelling to make the content easier to explore.
Yes. While the requirements vary depending on location and registration type, most charities are expected to produce an annual report for compliance and accountability. More than a regulatory task, it’s a communication tool that helps donors, volunteers, and stakeholders see how resources were used and what impact was achieved over the year.
An impact report focuses mainly on results. It highlights how specific programs changed lives, improved communities or supported your mission.
An annual report takes a broader view, combining impact stories with financial data, leadership messages and future goals. You can think of an impact report as a deep dive into outcomes, while the annual report gives a full picture of the organization’s year.
Annual reports are a valuable resource for prospect research, which is the process of identifying and learning about potential donors. They reveal patterns in donor recognition lists, partnerships and funding sources. Reviewing other nonprofits’ annual reports can also help identify foundations or companies that support similar causes.
In this way, annual reports help inform future fundraising strategies.
Your nonprofit’s annual report is your chance to celebrate impact, thank supporters, and show donors what their contributions made possible.
In this piece, we’ve shared what is included in the annual report and how to create one that donors look forward to reading every year.
You don’t need professional design experience to make it happen. Visme makes it easy to create stunning, on-brand reports. Choose from thousands of ready-made nonprofit templates, then customize them with our drag-and-drop editor, AI writing tools, and interactive design features like animations, clickable charts and videos.
Even if you are racing against the clock or lack design inspiration, Visme's AI report generator lets you put together professional-looking reports in seconds. All you need is a detailed text prompt that explains what you want to create and watch it come together.
Sign up for a free Visme account and take it for a test drive for as long as you want.
Design visual brand experiences for your business whether you are a seasoned designer or a total novice.
Try Visme for free