


Typography Infographics: 12 Inspiring Examples & Techniques

We've created a massive list of 101 infographic examples for beginners with infographic design. This list will give you all the inspiration you need to create a beautiful infographic.
We’ve divided the infographics included in our list into 19 categories. Choose the category that best fits your needs and find the right infographic for you.
Create your own infographics in minutes using Visme's drag-and-drop infographic maker. Tap into easy design tools, free graphics and hundreds of infographic templates to create yours quickly.
Here’s a short selection of 8 easy-to-edit infographic templates you can edit, share and download with Visme. View more templates below:


Entrepreneur published an infographic with advice from billionaire businessman Mark Cuban. Cuban’s “12 Rules for Startups,” taken from his book “Sport of Business: If I Can Do It, You Can Do It,” are featured in sections set apart by varying colors.
Broker and business owner Mark Daoust created the infographic “5 Reasons Women Entrepreneurs Should Consider Buying a Business” for Entrepreneur, encouraging women to invest in business.
The widely shared, colorful infographic features bold numeric statistics, illustrated by shaded person silhouettes.
Funding solutions company Business Backer illustrated eight business models in a creative and quirky manner using cows and milk to explain how different interactions compose various schemes.
The unique message takes a boring concept and presents it in a way that engages readers’ attention and imaginations.

Taskworld designed its infographic, “10 Core Principles of Entrepreneurship,” to include plenty of useful advice, colorfully illustrated with a variety of images and a format that directs readers’ eyes from top to bottom.
It's actually been proven that exercise can make you a better entrepreneur, so it makes sense that some of the most successful startup founders know how to keep themselves in shape.
Need motivation to start your own exercise regimen? Take a look at how Richard Branson, founder of Virgin Media Group, runs, lifts weights, swims, does yoga and even finds time to kitesurf.
Artificial intelligence (AI) is becoming a bigger and bigger part of our everyday lives, but how is it being used in startups and companies across the world? This infographic showcases the startup AI landscape to see where in the world they are, which are the top AI startups and who gets the most funding.
The United States isn't the only place we see incredible startups sprout from. This infographic showcases some of the most popular and well-funded startups across Europe.
To break down Europe's startup culture even further, this infographic example showcases the top two European startup hubs — Barcelona and Catalonia. We love this infographic because of its monochromatic color scheme and simplistic design elements. The number outlines are subtle yet bold, and the overall design is clean and appealing.
To get an even better idea of startup culture around the world, we've included another great infographic example. This time, we see the top-funded tech startups coming out of Asia. Do you see any you recognize?
A variety of useful design-related definitions are presented in this infographic from Pagemodo. The company illustrated a number of terms that amateur designers need to know if they want to use tools such as Visme to craft visual content like a pro.
Creative processes are more daunting than most people imagine. This infographic weaves a hilarious and related narrative about the reality of a creative process and gives the audience a glimpse into the not-so-glamorous world of writing.
From staring at blank pages for hours to battling with writer's block, the content highlights the rollercoaster ride of emotions writers experience as they try to bring their creative ideas to life.
Amp up the infographics with visuals from Visme’s extensive library of icons, stock photos and videos or feel free to upload your own visuals. If your photos need some editing, you can leverage Visme’s AI Edit Tools. Once you’ve shared the infographic with your audience, you can track how many people have clicked or viewed it using the Visme analytics tool.
Bandwagon’s vivid infographic “The Visual Web: A Love Story” includes a plethora of statistics on digital marketing. The infographic saves space by posting a link to its factual sources instead of listing all of them in the visual itself.
This creative dark blue-themed infographic topic walks readers through the steps involved in a design process—from brainstorming to the actual design and feedback process. The beautiful icons, elegant fonts and illustrations in this infographic not only make the content fun but also boost overall visual appeal.
Collaborate with your team to edit this infographic in real-time, leave feedback and resolve comments until it matches your unique design needs. During the process, effectively manage roles and tasks, track deadlines and make corrections using the workflow tool.
This infographic targeting an audience of amateur graphic designers was created by Red Website Design, and it clearly defines basic principles of design, such as typography, hierarchy and colors.
Curious to know the best web-design tools? The team at Illustrio shared its favorites in a colorful infographic that brings an otherwise mundane list to life.
What better way to share the six critical elements of visual hierarchy than within a design? Very cool. This infographic includes a list of visual hierarchy elements in a grid format—size, color, contrast, alignment, repetition, and proximity—creating a really great piece of visual content.
Working on other concepts? Use Visme’s AI writer to generate content ideas, create a content structure and generate first drafts for your design copy.
Not sure what the best ways to use text or fonts within your designs? This typography trends infographic has you covered. We love the clean section breaks between each trend, making it obvious how readers should navigate through this infographic's content.
Have you ever wondered how some of the more popular typefaces got their names? From the famous Times New Roman and Arial all the way to Papyrus or Wingdings, how did these names come about? This fascinating infographic example helps detail the history behind some of the font faces that we all know and love.
A village setting and colorful characters highlight important points in this educational infographic from USAID. A path binds the different graphic elements of the visual together, leading reader’s eyes down the design from top to bottom.
The USC Rossier Online published an infographic illustrating education spending in the United States compared to other nations around the world.
Spending amounts are represented by colorful circles of relative size, and same-colored lines twist down the image to denote each included nation’s annual spending per school-aged child, child literacy rate and school life expectancy, as well as math and science test scores.
The design gains credibility with an appendix appearing at its bottom, as well as a list of sources.
The editors at Masters in Special Education created one of our favorite infographics, “The ‘Special’ In Special Ed,” which educates viewers on a sensitive topic with engaging images that visually represents facts and statistics.
Who knew so many of history’s most famous names fell somewhere along the autism spectrum?
We all know that TED has become all the rage in online learning. The organization’s famous talks featuring experts in an ever-expanding array of fields is the world’s most popular online lecture series.
The infographic from onlineclasses.org shares facts that explain just how popular TED Talks are and why they’re so attractive to audiences. It also visually diagrams the anatomy of a TED Talk, detailing what the most popular TED speakers have in common.

Yes, there is actually a science behind classroom design. This useful infographic by USC Rossier Online's online teaching degree shows how small changes in classroom layout can have a significant impact on student performance and engagement.
The internet is a mixed bag of languages, but do you know which is the most popular? And by how much? This infographic shows us that out of all websites, 60% of them are in English, with the next four most popular languages being Russian, Spanish, Turkish and French. Does that surprise you? Which did you think would be in the top five?
Website builder Jimdo illustrates the anatomy of a well-designed page with an infographic that dissects the page into essential elements, such as headers and call-to-action buttons.
A real webpage is used to display each section and the entire design is tied together with a monochromatic color scheme with a green accent color.
What really happens in an internet minute? The true scope of the world’s never-ending web activity is difficult to visualize, but that’s exactly what this infographic from Domo does.
The designer made the daring choice of creating the image in a circular format, which appropriately symbolizes the 60 seconds on a clock.
The monochromatic infographic, “Things to Come,” from Futurism illustrates a timeline of future technology. The design includes a classic timeline with points representing the dates of various events, but engages audiences with simple images describing each moment in time. You can replicate this design or create your own with one of Visme's professionally designed timeline templates.
Another superb infographic from the folks at Futurism illustrates the future of military technology. The design features simple images of planned aircraft and naval technology, as well as advanced weapon systems.
Simple pixelated images expertly illustrate the theme of this timeline infographic from the team at SSLs.com. The online evolution that occurred since 1971 would be unbelievable if we weren’t continuing to witness it on a daily basis.
The Internet of Things (IoT) is a newer trend due to the number of smart objects sprouting up across the world. This infographic provides a guide to IoT and what we should expect in the future. View the full infographic here.
The Covid-19 pandemic has caused a number of global shortages, including chips needed for car manufacturing. Due to this, many American automakers have a shortage of new vehicles being produced, leading to lost earnings and skyrocketing costs. This infographic delves into the impact that specific automakers are facing.
As more and more tech options arise across industries, the number of financial technologies also increases. This infographic showcases all of the different trends for the finance industry in the digital world. Fascinated by the data visualizations in this design? Access over 50+ charts, graphs, maps and widgets in the Visme editor to turn your numbers into captivating visuals.
The team at Visual.ly expertly illustrated Handley’s “Step-by-Step Directions for Writing Your Next Piece of Content” in an engaging infographic. Cartoon images bring the author’s 12 steps to life, and a design with bold headings makes each point pop from the page.
HubSpot’s boldly-colored infographic illustrates why marketers are creating too many blog posts. Designers used graphs and statistics to explain why marketers must rethink their strategies to remain relevant.
Marketo’s uniquely engaging infographic illustrates a journey through the world of visual content as points along a board game. Readers explore this fictional world along a path that weaves between lands of topics highlighted with statistics and professional tips.
Every blogger’s ultimate question is answered by a brightly illustrated infographic from Crazy Egg. Bold statistics draw attention to the design, which is structured to highlight actionable blogging tips.
Illustrating the different elements of a perfect content strategy without losing readers to monotony is no easy task, but the team at JBH met the challenge with its “Mixology of Content Marketing.”
The infographic uses the theme of a cocktail menu to illustrate the different "ingredients" of content types essential in a killer content strategy.
You invest a lot of time in creating your blog content. Don't let all of that effort stop there! This infographic showcases seven great ways to repurpose your blog content so you can increase its lifespan as well as the number of eyes it reaches.
This infographic's use of illustrations helps grab attention and get the point across. Consider how you can utilize custom illustrations like this in your own infographics — or utilize a tool like Visme that offers thousands of icons and illustrations for you to drag and drop into your design.
The folks at Tracx compiled a plethora of demographic data on who is using various forms of social media and presented the information in an expertly-designed infographic.
The design uses a variety of angles to draw readers’ eyes from top to bottom as they easily visualize the audiences using the most popular social networks.
This infographic guide designed by WeAreTop10 highlights actionable tips to creating a channel to rival the most famous video bloggers and celebrities. Each step is brightly illustrated in sections that are clearly demarcated with aptly-chosen colors.
Real Business Rescue’s popular design expertly uses dynamic shapes and angles to draw readers’ attention to each highlighted point. Bold statistics quickly communicate important facts and create visual hierarchy within the design.

Keeping track of the best practices needed to create successful social-media posts on various popular networks isn’t an easy task. After all, the best Pinterest posts share little in common with the most popular tweets.
Myclever designed a comprehensive infographic featuring success tips for major social platforms. It includes a strategic guide on the best time to post on Instagram and TikTok to maximize engagement, ensuring your content reaches your audience when they are most active.
Sign up. It's free.Want to create your own beautiful infographics?
Printsome illustrated its own handy list of shareable social media tips in infographic form.
From creating unique promotions on each of your channels to checking online reviews constantly, these 50 tips are useful for anyone looking to increase brand awareness and engagement through social media.
London Speaker Bureau provides readers with a visual guide on how to create a killer presentation. It summarizes essential tips that are often overlooked when preparing for a creative presentation.
The Line Wolf Librarian designed a beautiful infographic using the no-fail color combination of blue and orange. The complementary pallet creates an energizing effect to illustrate 10 body postures that create a winning presentation.
In this engaging infographic from SNI, readers are introduced to not only eight public-speaking tips, but entire online lectures on the subject from the world-famous TED. Each talk is visually described with simple icons and text fields of varying colors.
PresentationDeck created an easy-to-follow infographic detailing what to do and what not to do when leading public presentations. This list of tips is illustrated by simple graphics that deliver an immediate message.
WriteMyEssays also illustrates strategies for effective presentations with its infographic that lists speaking habits that will help you appear smarter to your audiences.
The designer expertly uses icons to illustrate a variety of concepts and draws attention to certain points with well-chosen colors.
In the current climate of alternative facts, sometimes the only way to counter a ridiculous argument is with hard data. This video infographic from GOOD Worldwide illustrates the Earth’s warming and cooling cycles over the past 400 millennia.
Visual.ly created a dazzling infographic for the Huffington Post that vividly illustrates the true costs of renewable energy. Simple images are used to visually explain the monetary figures used throughout, and statistics are highlighted in large fonts.
Is global warming a reality or a global-sized myth? Reusethisbag.com designed a beautifully-illustrated infographic that addressed the debate. The informative image is divided vertically to compare both sides to various arguments on the subject. Colorful graphics accompany each set of data.
Not convinced that global warming is the real deal? Climate Central’s creative infographic may convince you otherwise.
The interactive map invites readers to highlight any of 1,001 American cities to compare current average summertime temperatures to conditions forecasted for the year 2100 if current emissions trends continue. The results are nothing short of astonishing.
You can head over and interact with the infographic yourself here.
Climate Nexus and the American Public Health Association developed a series of infographics to illustrate the connections between climate change and disease.
While varying in color, each infographic in the series uses consistent format and structure to form one cohesive message. The four infographics are then combined into one elaborate design.
In another well-designed infographic from Futurism, alternative energy sources of the future are listed, as well as the progress in their implementation. The entire presentation is beautifully illustrated with evocative images representing each type.
Infographics make ideal reference guides for both experienced and amateur chefs. Images allow for quicker and easier reference while creating a culinary masterpiece. The wine and cheese guide makes an easily-understandable guide for both connoisseurs and budding enthusiasts.
The proper knife is an essential tool for chefs of all skill levels. Nisbets Catering Equipment Supplies shared this useful infographic that graphically illustrates each of 11 common kitchen knives, while describing its features and use.
eReplacementParts.com designed its guide to cooking and baking substitutions as a simple chart with images to represent various cooking ingredients. The resulting infographic is an easy-to-reference guide that can be used in and out of the kitchen.
Everest designed an infographic that can serve as a catch-all reference for cooks of varying skill levels. The design features charts for proper oven temperatures, measurement conversions and even a diagram of beef, pork and lamb cuts.
Who needs a shelf full of cookbooks when the folks at Kit Stone designed an extremely informative infographic that visually represents basic ingredients for 36 international cuisines, including French, Moroccan and even Pakistani.
With so many types of cooking oil in today’s cupboards, it can be tricky for cooks to know how each varies from the others. This infographic from SheKnows visually illustrates various oil types and lists their cooking qualities.
Precision Nutrition presents a series of fitness tips in a colorful and informative infographic. An anatomical drawing illustrates the various parts of the body aided by the 10-minute routine, and each exercise is illustrated for readers to understand.

The Consolidated Foodservice team illustrated the hidden dangers of habits like skipping breakfast or nighttime munching – and how to break them – with this attractive infographic. Each of the 1o points is illustrated with a drawing in flat-design style and well-chosen color schemes.
Using data compiled by the Royal College of Physicians, The Guardian crafted an interactive infographic highlighting the negative health impact of air pollution. Readers can click on one of two tabs to see different animated presentations and details describing them.
Serenata Flowers designed an infographic to present its “8 Things You Didn’t Know Your Plants Can Do,” a beautifully illustrated reference guide with images of various plants and flowers. Each species is highlighted by alternating colors and information on its health benefits.
This bold infographic created by Sure Payroll highlights a variety of facts and statistics supporting the importance of sleep. Basic icons and shading are used to visually describe group sizes, and large typography is used to emphasize figures.
This infographic from YourLocalSecurity uses bright images to illustrate insomnia’s effect on the brain. Diagrams further detail how lack of sleep impacts various life functions and what you can do to help establish natural circadian rhythms.
The Federal Reserve Bank of Atlanta created this educational infographic to explain how markets determine prices through supply and demand.
Varied shades of blue divide the design vertically, and images on each side make hard-to-understand concepts more palatable to a general audience.
To help today’s students understand what Americans experienced during the Great Depression, The Money Project designed an infographic full of actual photos of the period, as well as a number of charts to represent economic conditions.
The grey color scheme of the infographic helps communicate the dismal outlook of the period.
This detailed infographic visually depicts the various psychological consequences poverty can have on individuals and societies.
Multiple statistics are illustrated with a variety of graphics and other visual representations, and attention is drawn to important figures through changes in size and color.
Why do oil prices fluctuate so much? The common question doesn’t come with a simple answer. Jones Oil illustrated the subject with a detailed infographic that somehow makes sense out of a complicated web of elements.
Visual.ly designed an infographic that illustrates a 70-year-old joke. But this wasn’t some frivolous knock-knock joke or humorous riddle.
The infographic uses cows to explain the differences between various forms of government, including communism, fascism and capitalism. Thanks to colorful and engaging images, the visual breathes new life into an old tale.
Sign up. It's free.Visualize any kind of data with Visme.
Humans have used a variety of currencies throughout history, from the early days of bartering to the modern bitcoin revolution. Mint.com’s infographic colorfully illustrates the long history with timelines, images and statistics.
Want to gain a new perspective on time? This infographic does a terrific job of placing the last 24 hours into the wider context of the last year, the last century, the last millennia -- and finally, the entire history of the universe.
Using plenty of white space with contrasting accent colors, it gets the point across beautifully and effectively.
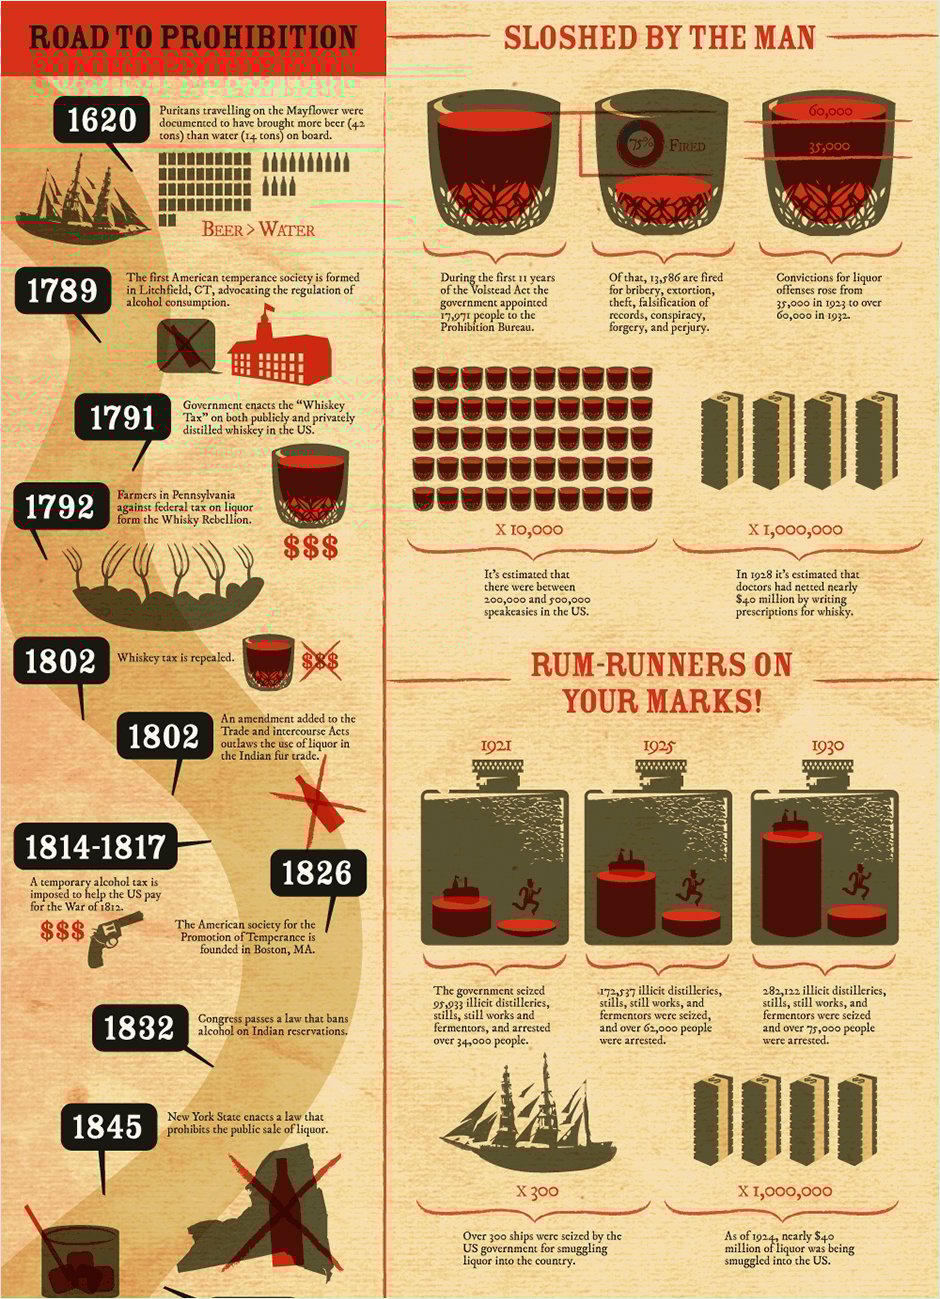
How much do today’s history students really know about the Prohibition Era? This infographic breaks the subject down into a historical timeline, as well as a variety of visual statistical representations.
Another broad historical subject is illustrated with a timeline in this infographic from Thinking Phones. The illustrated timeline changes color as it moves through different eras, and points in time are highlighted with dates and events.
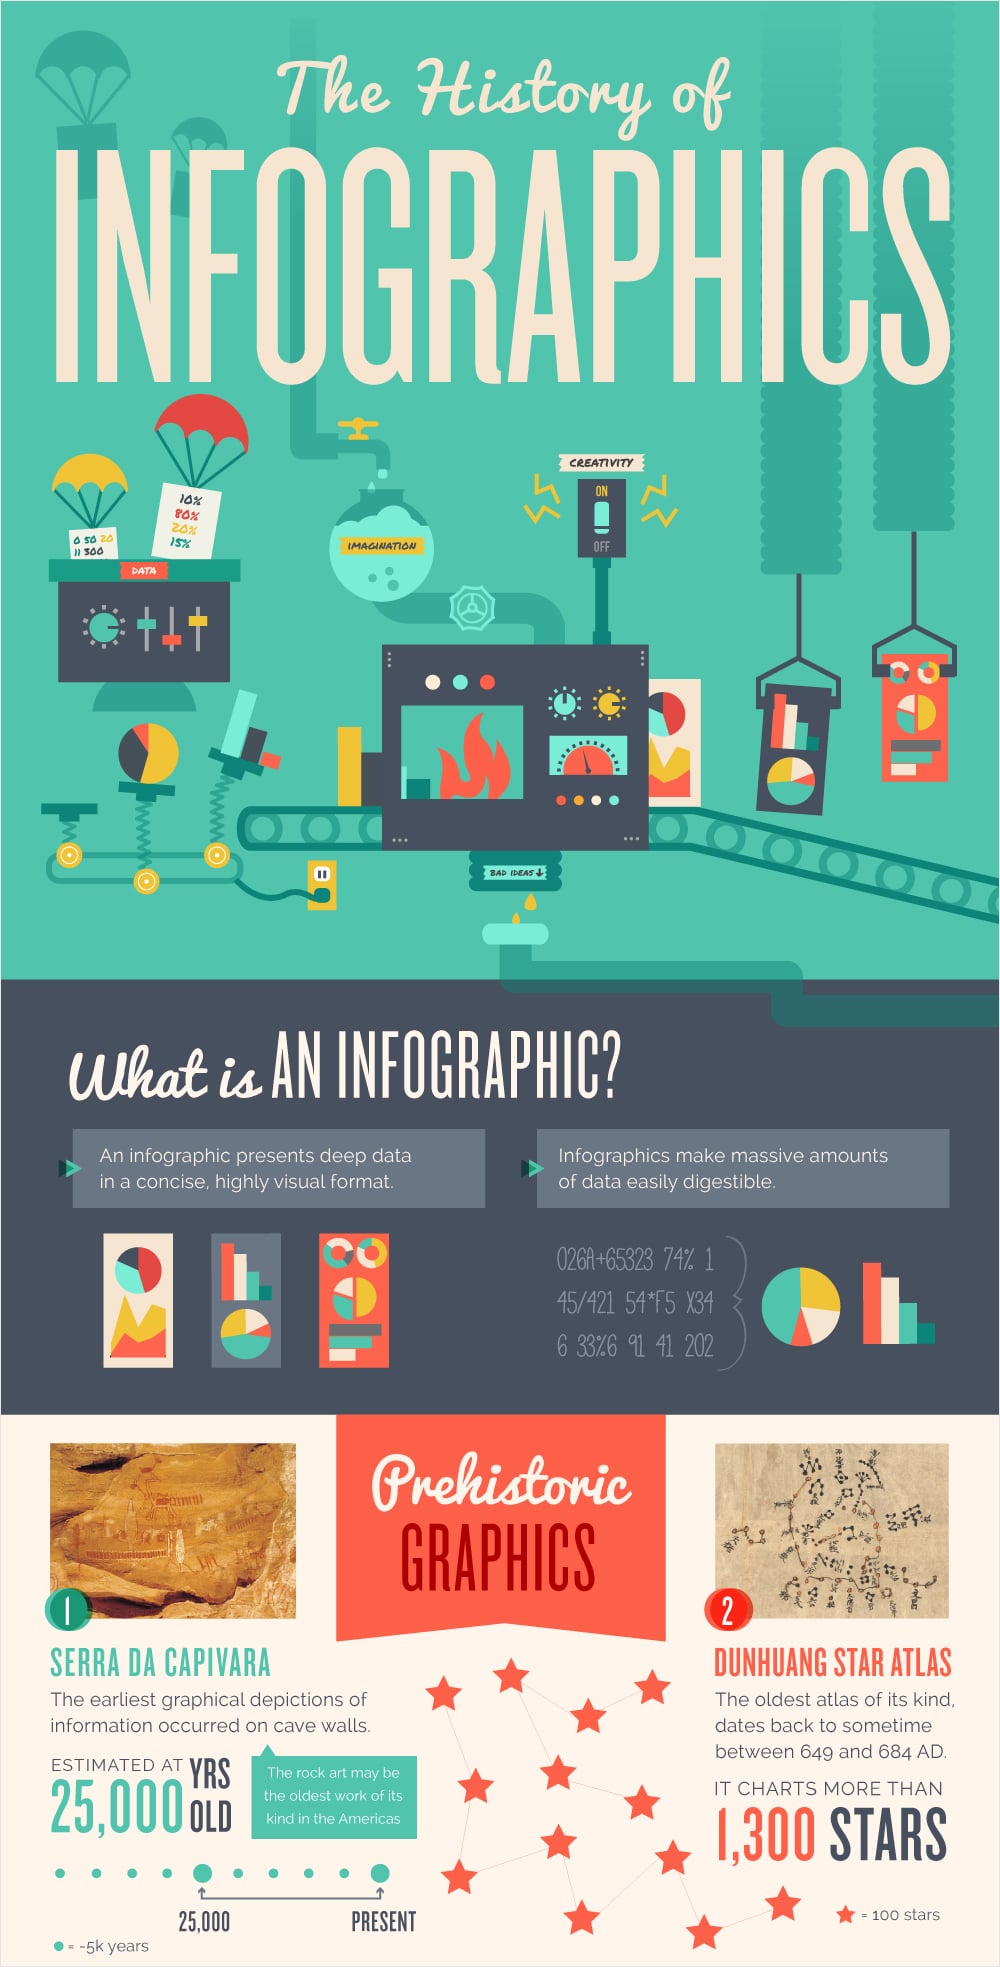
Readers love infographics about infographics, and this ultra-informative design from Easel.ly illustrates a history that spans millennia. The design not only illustrates its timeline, but its structure draws readers eyes from beginning to end, top to bottom.
History isn’t limited to tales of past governments and societies. Every subject has an origin and an evolution, which is almost always well-illustrated with some sort of timeline, such as this history of daft punk music.
Just the Flight examined the greatest empires throughout human history in this unique infographic that combined a timeline with world maps and icons to represent figures. The infographic not only highlights historical people and events, but describes how the cyclical nature of those changing empires can provide lessons for modern times.
Are brands and customers on the same page when it comes to digital trends? Code Computerlove explores the question with a vivid infographic. The design highlights statistics and other facts with colorful charts and images.
Olive and Company designed this infographic full of data to visually explain the eight pillars of modern marketing. Bold and outlined figures highlight various statistics, and each concept is marked by colorful fields.
HighQ created an infographic to illustrate why 2017 will be the year of video marketing. Readers are drawn to this design thanks to its extensive use of statistics emphasized with large type and an attractive color scheme.
Backlinko and Ignite Visibility teamed up to compile tips for creating URLs that rank better. The shared wisdom and advice is displayed in a colorful infographic that illustrates different strategies with mock screen shots.
Sprout Social created an infographic highlighting the year’s most important social media marketing trends. The design uses emphasized figures and simple images to engage readers while offering plenty of actionable advice.
From the increased importance of Schema Markup to longer snippets, possible changes in the SEO landscape are prognosticated in the infographic “SEO Trends to Watch Out for in 2017." Each section is highlighted with a different color, and simple diagrams and charts are used to illustrate the most important elements.
Futurism’s vivid infographic describes 40 of the universe’s strangest planets, including Earth and Mars, with information from NASA and a series of colorful images.
What will happen to Earth once our sun meets its ultimate demise? Another stunning infographic designed by Futurism explores the question by illustrating peculiar extraterrestrial worlds and the dead or dying stars around which they orbit.
This infographic explores some of the universe’s greatest mysteries with brilliant imagery. Futurism depicts complicated scientific concepts such as the Big Bang, dark matter and the continuum of space and time.
Another beautifully-designed monochromatic infographic from Futurism describes how modern biotechnology could provide people with immortality. Seven technological possibilities are illustrated with a full-length diagram of the human skeleton.
Sign up. It's free.Want to create your own beautiful infographics?
When it comes to designing powerful scientific infographics, Futurism leads the pack. “A Brief History of Atomic Theory” is an illustrated timeline of events that led to an understanding of quantum mechanics.
Discover how to crush procrastination and grow more productive with this vibrant design from Essay Expert. Each of the 15 tips is vividly illustrated with comical graphics, and the complementary color scheme makes the design jump from the page.
Quid Corner knows creating the right balance between productivity and breaks is crucial to remaining engaged and well-rested throughout the work day. To illustrate this concept, it designed this infographic on how to achieve that balance with the best break lengths and frequency for various activities to keep you refreshed and focused.
How do the world’s most successful people start the day? This infographic from Sleep Matters uses actionable advice, bright colors and photo cutouts to illustrate how millionaires and billionaires stay on top of things by starting their days right.
Contemporary work habits are unsustainable. Bestselling author and publisher Michael Hyatt explores the productivity power struggle of our fast-paced world with an infographic that features graphs, statistics and informative images.
Placester details how to create beautiful websites optimized for better online marketing and search in this colorful infographic. The design uses images so informative little text is necessary to convey the message.
Anyone can become a web developer, no matter their stage in life. This infographic illustrates how even older techies can land their dream job with brightly-colored statistics and a code-themed visual design.
This Vision Mobile infographic graphically explains the demographics of a web-development industry consisting of just 100 members. For each category, 100 icons depict the total group, and color separates gender, nationality, language specialty and other market characteristics.
Web-development technology is constantly evolving, which is why it's such an exciting industry. This infographic from Zeolearn illustrates trends that keep web developers on their toes.
Toggl once again delights its audience with a quirky and humorous explanation of software development -- using cars. With a unique graphic style and references that may only be familiar to software developers, this visual is a one-of-a-kind cross between an infographic and a comic illustration.
Infographics provide powerful how-to guides for visual learners. In this infographic from information designer Anna Vital, various visual analogies are perfectly illustrated with diagrams, charts and maps.
Towergate tells a visual story detailing how to deal with various types of difficult employees with this humorous infographic. Comical situations with problem employees are characterized, with informative icons representing signs, causes and solutions.
The team at On Stride Financial knows that making decisions can sometimes be difficult. This is why it created this entertaining infographic on how to tackle the toughest decisions in life, from what outfit to wear on any given day to what career path to follow.
The effective design features brightly-colored images that illustrate actionable advice, as well as surprising statistics.
This reference guide visually depicts various types of fabrics and details the proper way to care for each. It’s a one-stop infographic for all fabric-care questions.
Do you know the hidden tips and tricks that can improve your Google experience? In this brightly-colored infographic, Who Is Hosting This offers tips and pointers for getting the most from each search.
Using Buzzsumo, Siege Media analyzed the 1,000 most-shared infographics of 2015 to determine what qualities they had in common. The resulting infographic visually explains how content marketers can create content that is more shareable.
The team at OneSpot crafted an infographic that illustrates just what elements comprise a good infographic. Statistics and definitions are displayed with informative icons and actionable advice is listed in an array of colors.
NeoMam Studios produced this infographic to illustrate its data-driven approach to explaining why people crave infographics. Statistics from a variety of scientific sources are brilliantly displayed in shades of red and blue and illustrated with informative images.
Infographics have exploded among marketers and journalists, but only a few can be described as truly effective. Infobrandz and Feldman Creative designed this great infographic to illustrate concepts and themes that the greatest of infographics have in common.
Visme’s engaging infographic illustrates the science behind viral infographics, according to its study of the most shared visuals across all social networks. The design colorfully illustrates 10 traits that all viral infographics have in common.
A project by graphic designer José Guízar, Windows of New York is a beautifully illustrated work that represents the different architectural styles of windows in the Big Apple.
Seen through the eyes of someone who has a self-professed "obsession" with the windows and fire escapes of New York city, this project catches viewers' eyes through the expert use of white space and attractive color palettes to visually delineate each section.
Did you know that you can legally marry a dog in India? Or that you can walk around completely naked in Spain – in any public space?
These are just a few of the bizarre things you can actually get away with if you're in the right country, humorously summarized in this entertaining infographic by Citybase Apartments.
Ever wonder if you were born in the wrong country? This amusing flowchart may confirm or refute your suspicions, based on your responses for each of the nodes in the chart.
If you prefer to arrive stylishly late to a party, you may feel at home with Argentinians. Or if you like leaving hefty tips, you might just fit in with the locals in South Africa.
Some of the most widely shared infographics nowadays are not only intended to explain complex subjects or visualize hard data.
Sometimes they're created for pure entertainment, like this infographics from Sous Vide Tools, which gives readers a visual tour of the world through 20 tasty street foods.
You should be just about ready to go after seeing these 101 examples of infographics. You can easily get started with Visme's infographic maker. Choose a template that resembles your vision for the finished product and start customizing with your information and branding.
Not quite ready yet? Check out the resources below to learn more about infographics:
Have a few more questions about infographic design? No worries! We've got answers.
A good infographic should include a catchy header, your body information and a footer, complete with your sources and logo. What goes inside your infographic body depends on the type of infographic you’re trying to create, but can be anything from charts and data widgets to a flowchart with step-by-step information.
Different types of infographics range from comparison infographics and informational infographics to process infographics, timeline infographics and more.
You can easily make an infographic online using a tool like Visme, one of our templates and our easy-to-use infographic editor.
There’s a variety of infographic software available like Canva, Venngage, Piktochart and Infogram, but the best infographic software is Visme. You can create a free account in seconds and start designing today.
The most important part of an infographic will be your body. This is where you insert your information in a visual, digestible format. However, adding your sources at the bottom is another essential part of your infographic and helps ensure credibility.
Infographics have many uses, from being used in marketing to sharing report data to visualizing complex information and more.
You can make free infographics with Visme. Choose from one of our free infographic template designs and access hundreds of thousands of design elements in the editor to help customize your design before downloading or sharing online.
It’s hard to make a bad infographic, but a few mistakes to watch out for are using hard-to-read fonts, choosing a color scheme that clashes or using a chart that doesn’t make sense for your data.
The length of an infographic depends on two things – the amount of data you have and where you plan to distribute your infographic. Infographic dimensions need to be kept in mind when you think of your sharing strategy as some social platforms prefer square graphics while others prefer horizontal graphics.
Design visual brand experiences for your business whether you are a seasoned designer or a total novice.
Try Visme for free


![How to Make an Interactive Infographic [+Templates]](https://visme.co/blog/wp-content/uploads/2023/11/How-to-Make-an-Interactive-Infographic-Quick-Guide-8-Customizable-Templates-Thumbnail.jpg)


