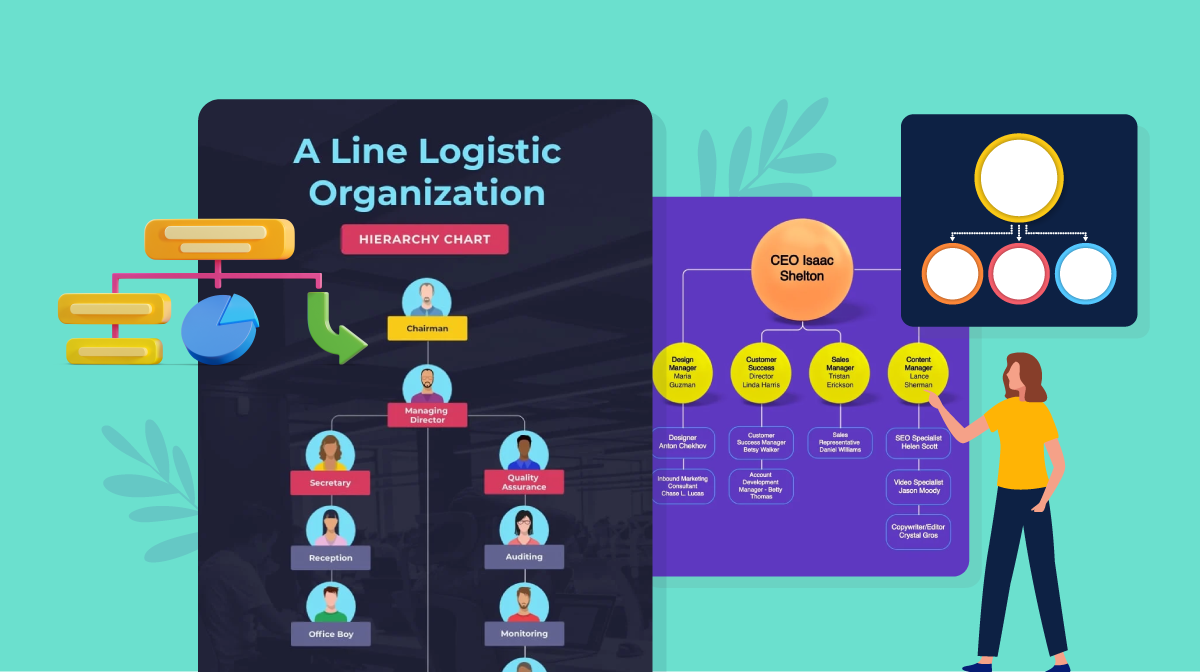
How to Make Hierarchy Chart: Best Tools & Templates


As a modern HR professional, you know that data is key to driving better results for your organization. But how do you know where to start?
That's where HR analytics comes in.
Collecting insights related to your workforce, performance, processes and more can help you understand your employees and create an engaging, productive company culture.
In this article, we'll show you how to find and harness the power of HR analytics to improve your strategies and achieve your goals.
HR analytics — also called people analytics — is the use of data and statistical analysis to understand and improve human resources (HR) processes and practices within an organization.
It involves collecting data about employee behavior, performance and outcomes, and using that data to identify trends, patterns and relationships that can help you make better decisions about HR strategies and policies.
HR analytics can be used to improve a wide range of HR processes, including hiring, training, development, performance management and succession planning.
By using data analysis, organizations can make informed and evidence-based decisions, leading to more engaged employees and better overall performance.
HR analytics is an important tool that can help your organization improve its HR strategies and practices. Some key benefits of using HR analytics include:

Before using data to guide your company’s HR strategies, you need to get your hands on the right metrics. Here are the steps to finding and collecting HR analytics:
The first step in collecting HR analytics is to identify the specific data you need. This will depend on your goals and the questions you’re trying to answer.
Here are some examples of HR analytics your organization can collect:
Collect employee feedback and perceptions towards the company culture using this self-evaluation form template.


Once you know what data you need, you can begin the process of gathering it.
Below are some data sources for HR analytics:
After you have collected the data, you’ll need to clean and organize it so it’s ready for analysis. This may involve removing duplicate or invalid data so the results aren’t skewed.
Also, make sure you standardize data formats like currency, time and date to avoid any confusion. Finally, properly structure the data in the form of tables and/or spreadsheets so it’s easier to visualize and analyze.
Once you’ve put together your data, it’s time to start analyzing it.
This step usually involves using statistical analysis techniques using tools like SPSS or Excel. You’d also want to create visualizations or use machine learning algorithms to identify trends and patterns in the data.
Use a data visualization software like Visme to transform static data into dynamic charts and graphs. You can connect live data from a Google sheet or upload an Excel file to save time.
Better yet, make your charts animated and interactive if you plan on sharing them online with your team or the management.

The steps above will help you gather data and analyze it. But what’s next? What do you do with all this valuable insight?
Let’s look at how your business can put HR analytics to good use.
Hiring the best people and getting them started on the right foot can be challenging. Fortunately, data can help streamline this process.
Below are a few ways HR analytics can improve employee recruitment and onboarding:
HR analytics can be a powerful tool for improving training and development efforts. Here are some specific ways data can help:
It’s one thing to hire the right employees. But it takes a lot more effort to keep the best ones in your organization for a sustainable period of time, that's where employee retention.
HR analytics can help you improve employee retention in several ways:
HR data analytics can be used to improve the way you pay and reward employees for their hard work. Mainly, they can help you evaluate your existing benefits and compensation packages by answering four key questions:
That’s right—data can help your employees be more productive! Here are two ways you can make that happen:
Looking to present HR analytics to your team or management? Use the following HR report templates to organize your data, visualize key statistics and present everything in an easily digestible way:
This corporate HR report template is professional and visually appealing. It includes sections for an annual summary, key HR metrics and employee demographics. It also includes charts and graphs to help visualize the data and highlight trends and insights.
This HR report can be used to report on a variety of HR metrics. You can also use it to communicate HR analytics and insights to key stakeholders within your organization.


Present your monthly HR metrics and analytics in style using this tailored KPI report template. Visualize statistics like hiring costs, training expenses, employee productivity and more with built-in graphs and editable pages.
Not happy with the color scheme? Change it with one click using our built-in color themes. Or, upload your brand kit and align it with your company’s unique visual identity.


Organize your yearly HR metrics and present them to your colleagues using this annual HR report template. Personalize each page with a few clicks—add in your data, branding, graphics, content and more.


You can also make this report interactive by adding links, hover effects, embedded content and a flipbook effect. This is especially useful if you plan on sharing this report online.
Present HR analytics at the end of the year in a more professional way using this corporate-style annual HR report template. With classic colors that can easily be customized, you’re sure to engage your audience and get your message across clearly.
Edit this HR report template using Visme’s robust document maker, which comes with built-in images, icons, fonts, color themes, charts and graphs, and much more. You can also easily upload your branded assets and collaborate on projects with your team.


This report template is designed to help HR managers track the performance of their employees on a weekly basis. The template has a clean and organized layout with sections for key performance metrics, such as target and backlog.
The template also includes visual aids such as radials and pictographs to present data and make it easy to understand. Use this report to track employee progress over time and help managers make decisions about promotions, raises or disciplinary actions.


Tracking HR analytics is essential to the success of your business. But presenting them in a visually appealing way is just as important.
Use Visme to create professional HR analytics reports with the help of ready-made templates, built-in graphics, branding capabilities, interactivity and more. Use features like online sharing and collaboration to work on comprehensive reports with your team.
Interested in learning more? Find out how Visme can help your HR team automate tasks, save time, and create beautiful resources to engage employees and boost productivity.
Design visual brand experiences for your business whether you are a seasoned designer or a total novice.
Try Visme for free![Company Succession Planning: Understanding its Process & Documentation [Including Templates]](https://visme.co/blog/wp-content/uploads/2023/11/Company-Succession-Planning-Understanding-its-Process-Documentation-Thumbnail-500x280.jpg)