Proven Product Specification Examples That Give You Clear Decisions
![How to Create an Org Chart in PowerPoint & Visme [Including Templates]](https://visme.co/blog/wp-content/uploads/2023/06/How-to-Create-an-Org-Chart-in-Powerpoint-Visme-Header.jpg)
Whether you're in the exciting beginning stages of launching a new company or aiming to streamline operations in your existing business, things can get pretty overwhelming. You need a roadmap that brings order, clarity and sense of direction to your company's structure and hierarchy.
How do you visualize a structure where everyone knows who's who and where responsibilities are crystal clear? How do you ensure communication and collaboration flow effortlessly? That's the magic of an org chart.
Org charts drive efficiency and set the stage for continued growth and success.
In this article, we will guide you on how to create an org chart using two powerful tools: PowerPoint and Visme.
We will also provide you with templates to get you started.
Let's dive in!
*Disclaimer: PowerPoint is a registered trademark of Microsoft Corporation. Visme is not affiliated with or endorsed by Microsoft. References to PowerPoint are for descriptive purposes only.
There are two ways to create an org chart in PowerPoint- by using a template or the Smart Art tool.
Step 1: On the File tab, click New.

Step 2: In the Search for online templates and themes box, type org chart and click the magnifying glass icon.
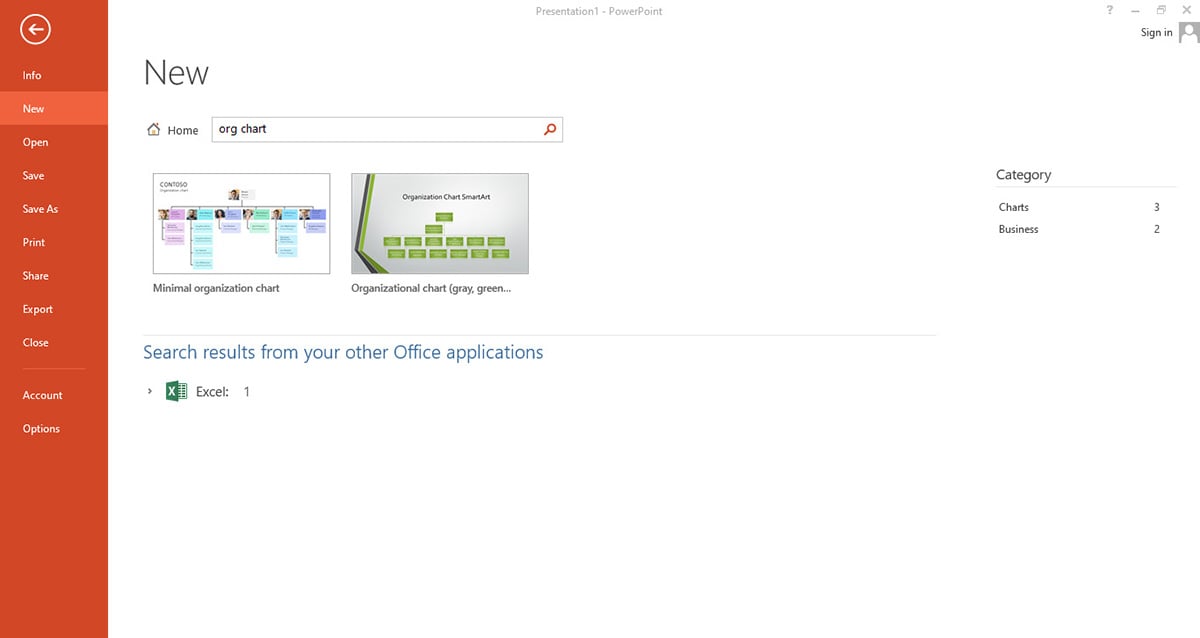
Step 3: Choose an org chart template from the search results

Step 4: Click Create and then go ahead and replace the text, images and icons with yours.
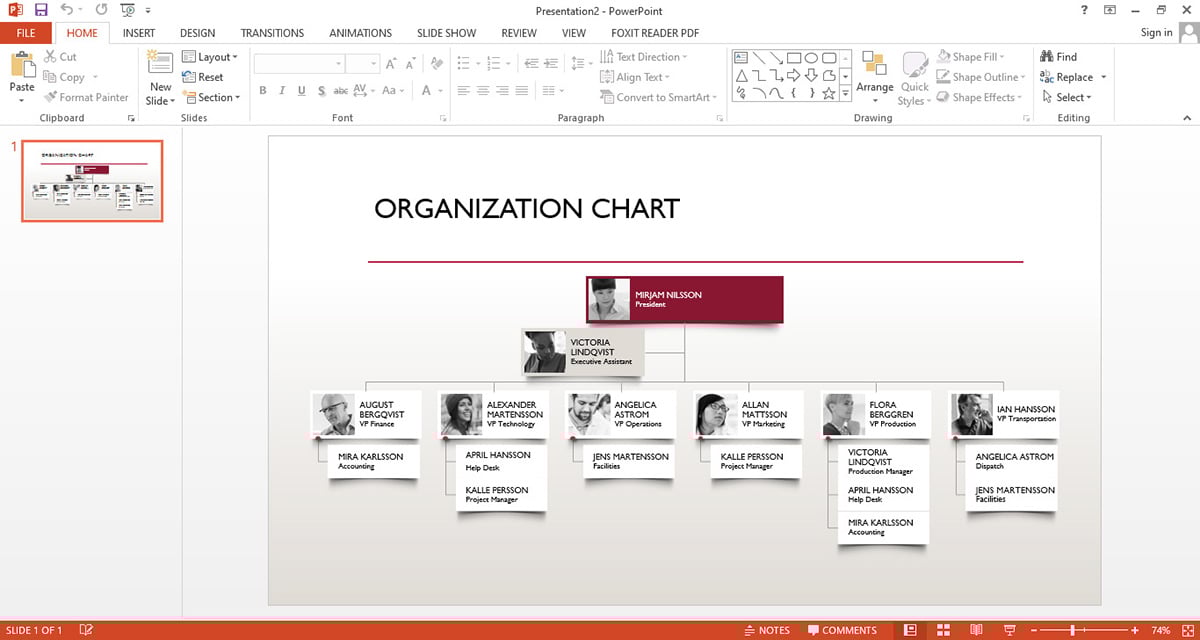
Step 1: Click the Insert tab, head to the Illustrations group and click SmartArt.
Step 2: In the Choose a SmartArt Graphic gallery, click Hierarchy. Microsoft PowerPoint has 13 organizational chart layouts for you to choose from, such as:
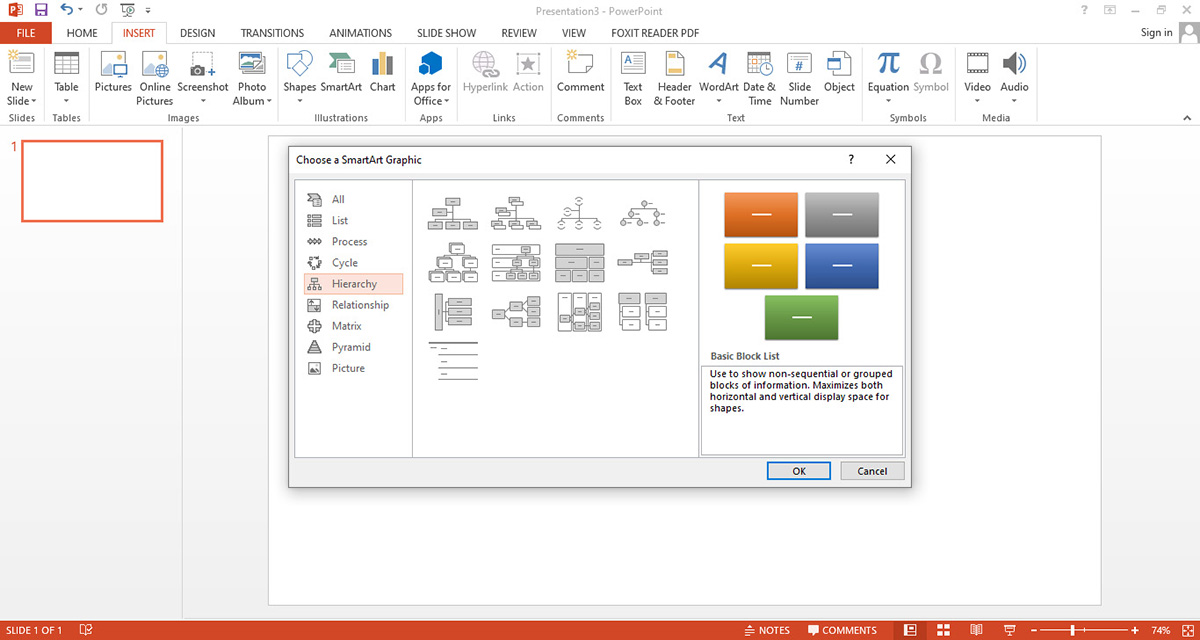
Step 3: Click an organization chart layout (such as Name and Title Organization Chart), then click OK.
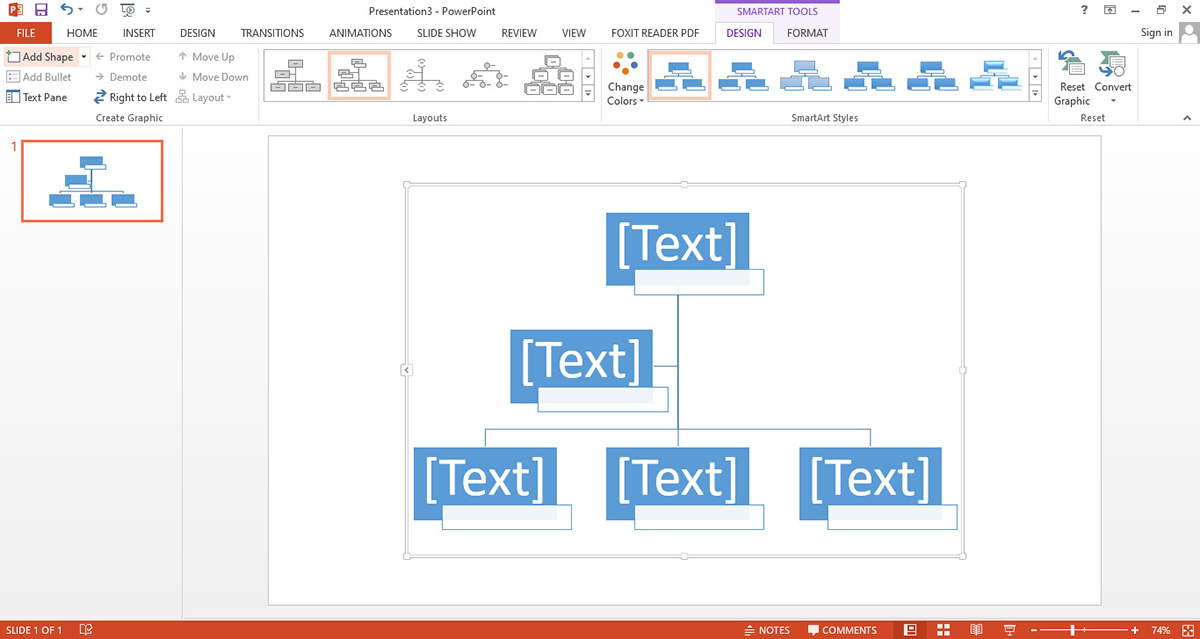
Step 4: The layout will appear on your canvas, so you can customize your chart by inputting your title and text or customizing the template color, shapes and format.
Step 5: Once done, you can save your org chart on OneDrive or export it in PPTX, JPG, PNG, GIF and PDF formats.
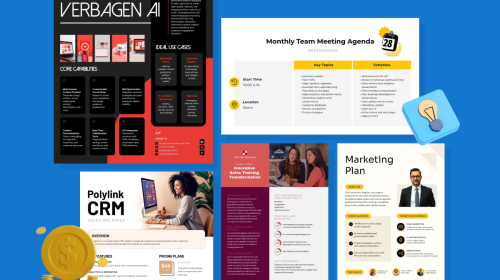
Visme offers a powerful organizational chart maker to help companies and HR teams transform their corporate hierarchy into a visually captivating masterpiece.
What makes Visme stand out is its intuitive interface, a wide range of exclusive features and professionally designed templates.
You can effortlessly design and customize charts to reflect your team’s unique structure and reporting relationships.
The best part is that our tool is foolproof, so you don’t need professional design skills and experience.
Let’s show you how to create an org chart with Visme.

Start by creating a new account or logging into your Visme account (if you’re an existing user). Once you're logged in, click on "Create New> Project and then select Infographics.
Scroll down or simply type “organizational chart” in the search bar. Then browse through our wide collection of templates to find one that matches your company’s organizational structure. Then click "Edit" to start customizing your template and you'll be redirected to the canvas.
If you prefer to have full control over your project's design and layout, you can start with predefined or custom dimensions. This will enable you to create an org chart tailored to your team’s structure.
1. Customize your template by editing the placeholders to add names, job titles and images. To add new roles or levels, use premade content blocks by clicking on Basics> Design Blocks> Diagrams.

2. You can also select the type of shapes and connector you prefer ( straight lines or curved arrows) and drag the connector to the other position you want to link. Customize the connectors by increasing the line thickness, roundness and dashes.
3. Feel free to add additional pages to your chart to capture different departments, divisions and cross-functional teams.
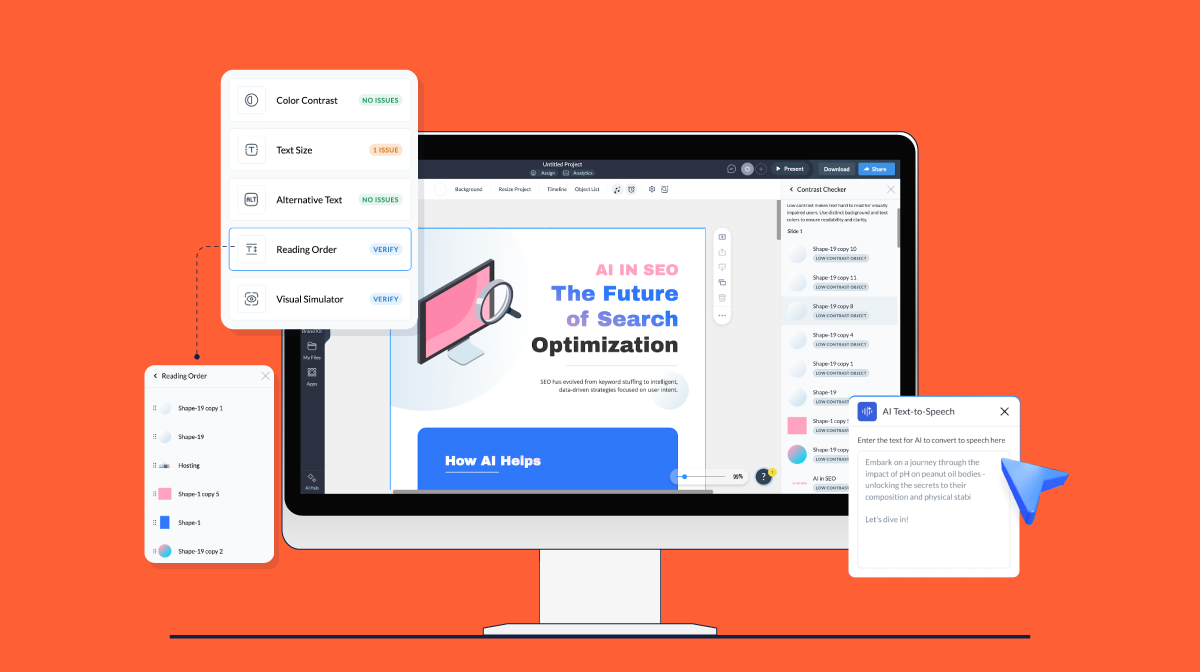
4. Visme offers a range of design options, including pre-designed themes, font styles and color palettes. Customize your organizational chart further by adjusting colors, fonts and sizes. You can also upload your own images, illustrations, 3D graphics and icons to personalize the chart.
5. Apply branding like colors, fonts, logo and other design elements that match your company's branding. Easily resize and reposition all elements on the canvas.

6. Add a dose of interactivity by adding enter/exit and text or object animations or popups and hover effects. Also you can link an object to another slide or web pages, email or social media.
Pro Tip: Enhance the user experience by creating pop ups or hover effects that reveal additional information about the role, such as detailed job description, contact information, working hours and contract type, when a user clicks or hovers on a design element.

As your organization grows and evolves, so do your organizational charts.
With Visme, it's not just about pretty boxes and lines. Our real-time collaboration and cloud storage capabilities empower multiple team members to work on the same chart in real time and asynchronously, ensuring that everyone stays on the same page.
Pro Tip: Create a workspace and invite users to view, edit, annotate and comment on your chart. Team members can tag each other, leave comments and feedback, reply, resolve and delete comments. Updates and changes are reflected instantly, eliminating the hassle of outdated and inaccurate charts.
Once you're sold on the final design and the information, you can share your chart in multiple formats, including.

Also, you can generate an online, secure, shareable link to share with your team. Or share your design on Slack, Facebook, LinkedIn, Pinterest and Twitter. Generate an embed code for the design and paste it into your company's team page, website or landing page.
But that's not all. Visme lets you make your published charts private, allowing only people with a password or link to view them.

Are you still wondering why you should pick Visme over other tools? Our users think the Visme editor is unrivaled and our templates are top-notch.
But don't just take our word for it. Here's what one of our valued users had to say about their experience with our platform.
Digital Marketing Specialist
Ready to visualize your org chart on a team, departmental and company-wide level? Visme provides an extensive collection of organizational chart templates that you can customize according to your unique needs or company structure.
Here are some of the best org chart templates you’ll find in our template library
When working on projects, you want a single source of truth for your team. Utilize this template to effectively showcase the management structure of your new project or project phases, including the responsible teams, to both your board members and teams.
The template has a simple design but shows a clear role and reporting structure for cross-functional teams involved in product development. Transform this organizational chart template to suit your unique team structure and brand identity by changing the color of the template and adding your logo.
Download your infographics in JPG, PNG, PDF and HTML5 format and share them offline. Also, you can share it online via a link or embed it on your company’s team page.
Clearly display your creative team structure with this aesthetic infographic template. The purple background mixed with multiple brightly colored shapes and fonts makes the design appealing to the eye. You can swap the logo and text with yours as well as the names and positions of team members.
Do you have a larger team? There’s no limit to how much information you can add to the sheet. With our intuitive editor, you can increase the size of your, add more tiers or levels or even create new pages to capture more information.
Ensure teams have proper guidance when bringing on new colleagues and reporting their roles and relationships using this template. This template represents a top-down structure with a clear chain of command, with boxes or rectangles for each position or role, connected by lines indicating reporting relationships.
It features a plain background with dazzling colors, making your content stand out. Incorporating team pictures adds a captivating visual element that elevates the overall experience and dramatically improves information retention.
Amp up your chart by adding interactive pop-ups or hover effects that reveal additional information like work experience and job description when the user clicks or hovers over any object.
Bring your organizational structure to life with this immersive org chart. This template goes beyond the norm and depicts your company hierarchy in brilliant ways that captivate and inspire. The clickable social media icons elevate the design and make it easier for everyone in the team to contact each other when the need arises.
Beyond the role, you can also capture extra information in a way that doesn’t ruin the design. Feel free to change the background image, text and shape color and other design assets.
If you’re looking for a simple diagram that captures the reporting structure in your company, this template is right for you. Whether you’re starting a company or project, this template visually communicates the human resource requirements to stakeholders.
The arrow connecting the nodes visualizes the relationship between roles. The high-res images, cool icons and a selection of eye-catching fonts add a professional and elegant feel.
If you want to further liven up your design, Visme has an extensive collection of high-quality and royalty-free stock photos you can choose from.
Our AI image generator is the icing on the cake. With a single prompt, you can generate photos, paintings, pencil drawings, 3D graphics, icons and abstract art and add them to your projects. Simply describe what you want to create and the AI tool will generate a wide range of graphics that match your description.

If you run a coffee shop, restaurant or eatery, this brown cafe-themed organizational chart template is perfect for visualizing your org chart. The template features stunning design elements that capture the essence of your brand and leave a lasting impression on your audience.
Just like the owner's headshot, you can include pictures of other team members. Our org chart maker also comes built-in with thousands of graphic assets like icons, characters, illustrations, gestures, shapes, stylized text and data visualizations.
Make your design process seamless and faster using our shortcut feature to find design elements. Simply click the forward slash “/” on your keyboard and a search bar will appear. There, you can find and add any design element to your organizational chart.
Take advantage of this impeccable template to clearly establish a visual hierarchy of roles within your construction company. Not only can this chart help you produce a flow of accountability, but it can also help you make smart decisions, empower your employees and eliminate bottlenecks.
Unlike the traditional top-down flow, this chart flows from left to right. You can use different text boxes, shapes or colors to portray a hierarchy chart or levels such as board, executive, director, manager and entry-level.
After you’ve published the org chart with your team, view the analytics tool to see how team members are engaging with your chart.
Are you managing cross-functional teams or project-based teams? This matrix organogram is the perfect choice for you. Matrix org charts facilitate open communication and better collaboration, especially for larger teams.
In this chart, employees are split into functional groups or teams, each with administrative and other support staff. But you can swap this information with that of your team. Also, duplicate this page or create additional pages if you have multiple cross-functional teams.
The thing is, your org chart should be a living document and you shouldn’t work in isolation. Invite your team members to collaborate with you, ensuring that you always have an updated org chart.
With Visme’s collaboration feature, your team members can tag each other on designs, leave comments, reply to questions and provide feedback and resolve and delete comments in real-time and asynchronously. You can create multiple workspaces, add team members and provide different roles, permissions or access levels.
Whether you're a seasoned e-commerce pro or just starting out, this org chart template is a valuable roadmap. With this user-friendly template, you'll be able to visualize your team's structure, roles and relationships effortlessly. From operations to marketing to sales and customer support, everyone has their place in the chart, working together like a well-oiled machine.
Our intuitive editor and wide range of customizable features let you effortlessly adapt the chart to align with your unique business model and growth objectives. Modify the text and background color, fonts and logo to match your company’s branding.
Our AI-powered brand design tool provides a set of branded templates already fitted with your brand element. All you need to do is input your website URL and our brand wizard will pull up your logo, colors and fonts from your website.
Our final pick is a departmental org chart that shows your team's hierarchy, relationships and reporting structures. With this blueprint, you can ensure that nothing falls through the cracks, enabling smooth coordination among your talented team members.
The chart visualizes how different units within your department are organized and how they interact. Although it follows the traditional approach, you can clearly identify the different levels of management, all represented by boxes with different shapes and colors.
For example, the publisher sits at the top level, depicted with a round rectangle box, followed by the middle level, where the shape is neon green. The lower levels are represented by square and rectangular boxes.
That’s the beauty of Visme. You elevate your designs and effectively communicate your message using a variety of tools in the Visme library. Utilize shapes, arrows, color themes, characters, gestures and illustrations to make your org charts impactful.
There are several org chart creators available and the ease of use may vary depending on personal preferences and specific requirements. However, Visme is a widely recommended org chart creator known for its simplicity, user-friendly interface and wide range of powerful features.
Visme offers an extensive library of professionally designed org chart templates for every industry and use case. The drag-and-drop functionality makes the tool foolproof. Anyone, regardless of their skill level, can create, customize, download and share their org chart.
Visme is popular among many users due to its smart collaboration feature and seamless integration with other widely-used business applications. These features make it a convenient option for users seeking a comprehensive and efficient solution for their business needs.
An organizational chart (also known as an org chart, organogram,” or organigram) is a visual representation of a company’s or organization’s structure. It illustrates the relationships and hierarchy among the organization’s different positions, departments and individuals.
The chart usually consists of boxes or nodes representing positions or individuals, connected by lines that show the reporting relationships or lines of authority. It may include additional information such as job titles, names and sometimes even photographs to help identify individuals and their roles.
Typically, an org chart depicts the reporting relationships, showing who reports to whom and the flow of authority and communication within the organization. It outlines the various levels of management, departments, teams and individual roles, providing a clear understanding of how the organization is structured.
The main purpose of an org chart is to provide a visual representation of the organization’s structure, helping employees and stakeholders understand the chain of command, reporting relationships, lines of communication and how the company is organized.
It serves as a valuable tool for onboarding new employees, planning and allocating resources and facilitating effective communication and collaboration within the organization.
The structure of an org chart can vary based on the unique characteristics and needs of your organization. Hence, the chart must accurately represent your company’s hierarchy and relationships.
Here’s how you can provide an accurate structure for your org chart
Read this article to learn more about the different types of organizational structures.
There you have it. Creating an organizational org chart is essential for visualizing and understanding the structure of an organization. In this article, we’ve explored the different ways you can create an org chart in PowerPoint and Visme, plus editable templates to get you started.
Now it’s time to create yours. If you're seeking a tool that goes beyond the basics and provides an immersive visual experience, Visme is your best bet.
With its robust org chart maker, Visme offers a host of intuitive features, including advanced drag-and-drop functionality, extensive formatting capabilities, interactive elements, collaboration tools and seamless integration with other business software.
By harnessing the power of org charts, workflows, checklists, onboarding and training materials and other Visme tools, your HR team can make significant strides. You can streamline your HR processes, enhance onboarding and training initiatives and effectively align people-related strategies with broader company objectives.
Ultimately, these efforts contribute to building a strong and cohesive workforce, driving success for your organization.
Design visual brand experiences for your business whether you are a seasoned designer or a total novice.
Try Visme for free