


How to Make a Gantt Chart in Excel + Easier Alternatives


When it comes to designing and planning a process, flowcharts help you identify the critical steps while offering the bigger picture of the process.
Since you are reading this, you might already know that various flowcharts are one of the most popular data visualization types used across many fields and industries.
However, to take advantage of different flowcharts to their fullest potential, you need to find the right one according to the type of process you’re aiming to visualize.
Therefore, we have put together a list of the 8 most popular types of flowcharts and templates to help you familiarize yourself with them.
Before you dive in, watch this video below to learn how you can make professional flowcharts and diagrams in just two minutes.
Here’s a short selection of 8 easy-to-edit flowchart templates you can edit, share and download with Visme. View more templates below:


A flowchart is a tool that helps you visualize the steps, decisions and interactions involved in a particular project or system. It typically includes elements like symbols, shapes and arrows that are used to represent steps and decisions.
Flowcharts are designed for various purposes and have a wide range of use cases, ranging from training to project management to system design.
| Type of Flowchart | Best Use Case | Mainly Used By |
| Process Flowchart | Visualizing the sequential steps of a specific process from start to finish. | Business managers, Product designers and Engineers |
| Swimlane Flowchart | Illustrating workflows across various departments or roles, highlighting interactions and responsibilities. | HR experts and Project managers |
| Workflow Diagram | Identifying automation opportunities and streamlining workflows. | Business Managers and HRs |
| Decision Flowchart | Assessing business strategies, risks and potential outcomes. | Executives and Risk analysts |
| Data Flow Diagram (DFD) | Mapping how data moves and transforms through a process or system | Software system designers and Data managers |
| System Flowchart | Illustrating system architecture and interactions | System analysts, IT and Architects |
| Algorithm Flowchart | Mapping out the steps of an algorithm and debugging | Programmers, Data scientists |
| Document Flowchart | Tracking how documents are created, reviewed, approved, stored and distributed across different departments | HRs, Compliance officers and Auditors |
Things always get messy when it comes to keeping track of various types of details within a business or organization. In that case, a flowchart can come in handy. It will help you organize and visualize your process and illustrate the relationship between tasks and the people responsible for carrying them out.
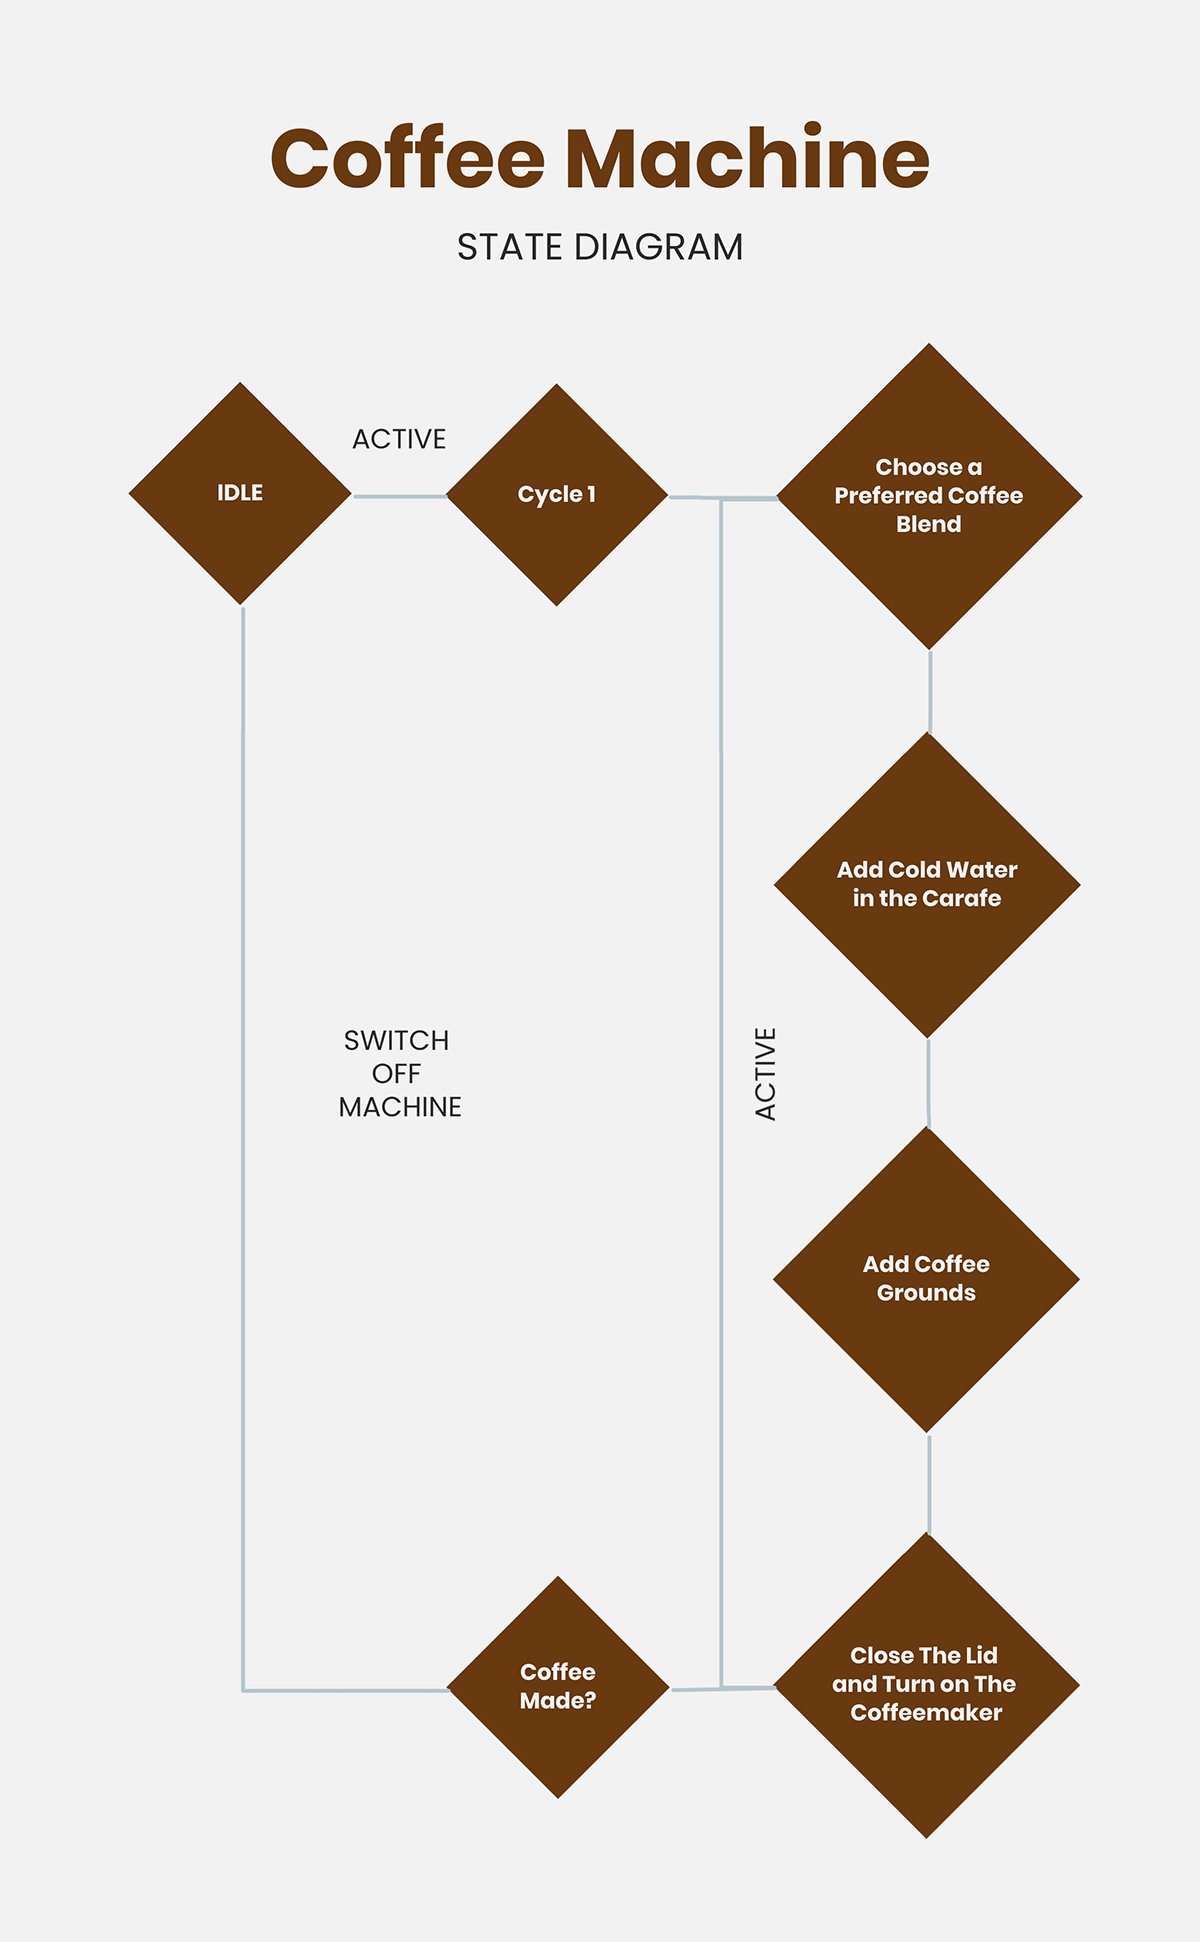
A process flowchart includes a sequential process of steps and the decisions needed to make the process work. Shapes further indicate each step, and these shapes are connected by lines. The lines feature arrows to show the movement and direction of the process.
Flowcharts follow a logical flow of information so that the process you are trying to visualize becomes crystal clear. And the best part about these types of flowcharts is that they are effortless to create.
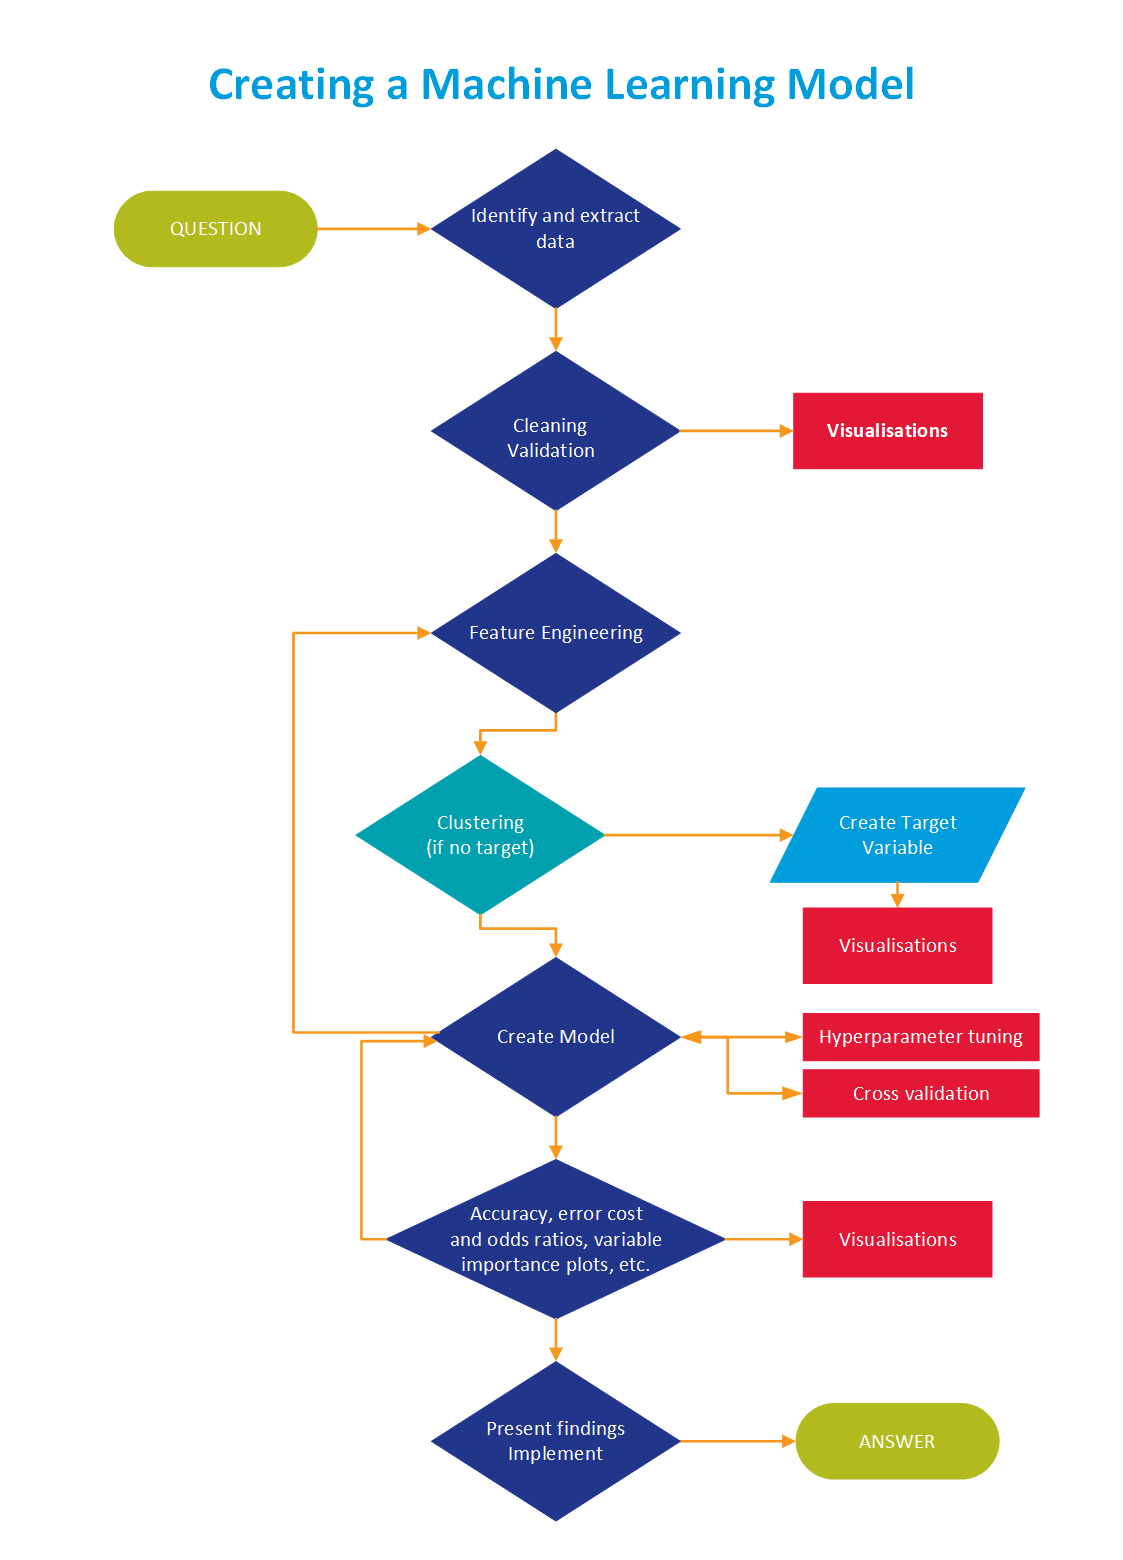
Here’s a real life example of a process flowchart.
This process flowchart is a great example of how a high-level concept can be simplified using flowcharts. Although the process of creating a machine learning (ML) model is complex, the flow remains intuitive with the simple design. The use of distinct colors, like red for optional visualization steps, ensures clarity without overwhelming the viewer.
If you want to create a process flowchart, here’s one that you can easily customize.

In a project management scenario, you can pair your flowchart with a bubble chart to get a full picture of what happens within your process. Within the context of diagram, you can create a flowchart to visualize how resources (e.g., hiring managers, interviewers) are allocated across different stages of the hiring process.
Best Use Case: Mapping out and documenting standard processes for specific operations.
Expert Tip: Sam Speller, CEO & Founder of Kenko Tea” shared the following insights about creating process flowcharts
“Keeping it simple is a best practice we swear by. In the beginning, we tried to cover too much ground with our flowcharts, which caused confusion and mistakes. Now we limit the number of steps on a single flowchart and use sub-processes for more complicated tasks. For example, when we mapped out our matcha-making process into a flowchart, we separated it into sections we could tackle: Harvesting, Grinding, Packaging. This not only enhanced readability but also simplified training for new team members. We’ve achieved both function and visual delight in our flowcharts by applying clean lines and evenly-spaced intersecting elements.”
A workflow diagram is also similar to the process flowchart, which provides a graphic overview of the process you are trying to visualize. Like a process flowchart, a workflow diagram shows the step-by-step process using standardized symbols and shapes. Due to their shared features, people often use these two terms interchangeably.
The difference between a workflow diagram and a process flowchart is that a workflow diagram defines a process for how an item should work. On the other hand, a process flowchart describes a process. Furthermore, the diagram shows who is responsible for work at what point in the process.
In other words, the process flowchart shows the processes that change the state of an object, but a workflow diagram shows the actual changes in the workflow.
Use these diagrams to help employees understand their roles and responsibilities and create more unity within different departments.
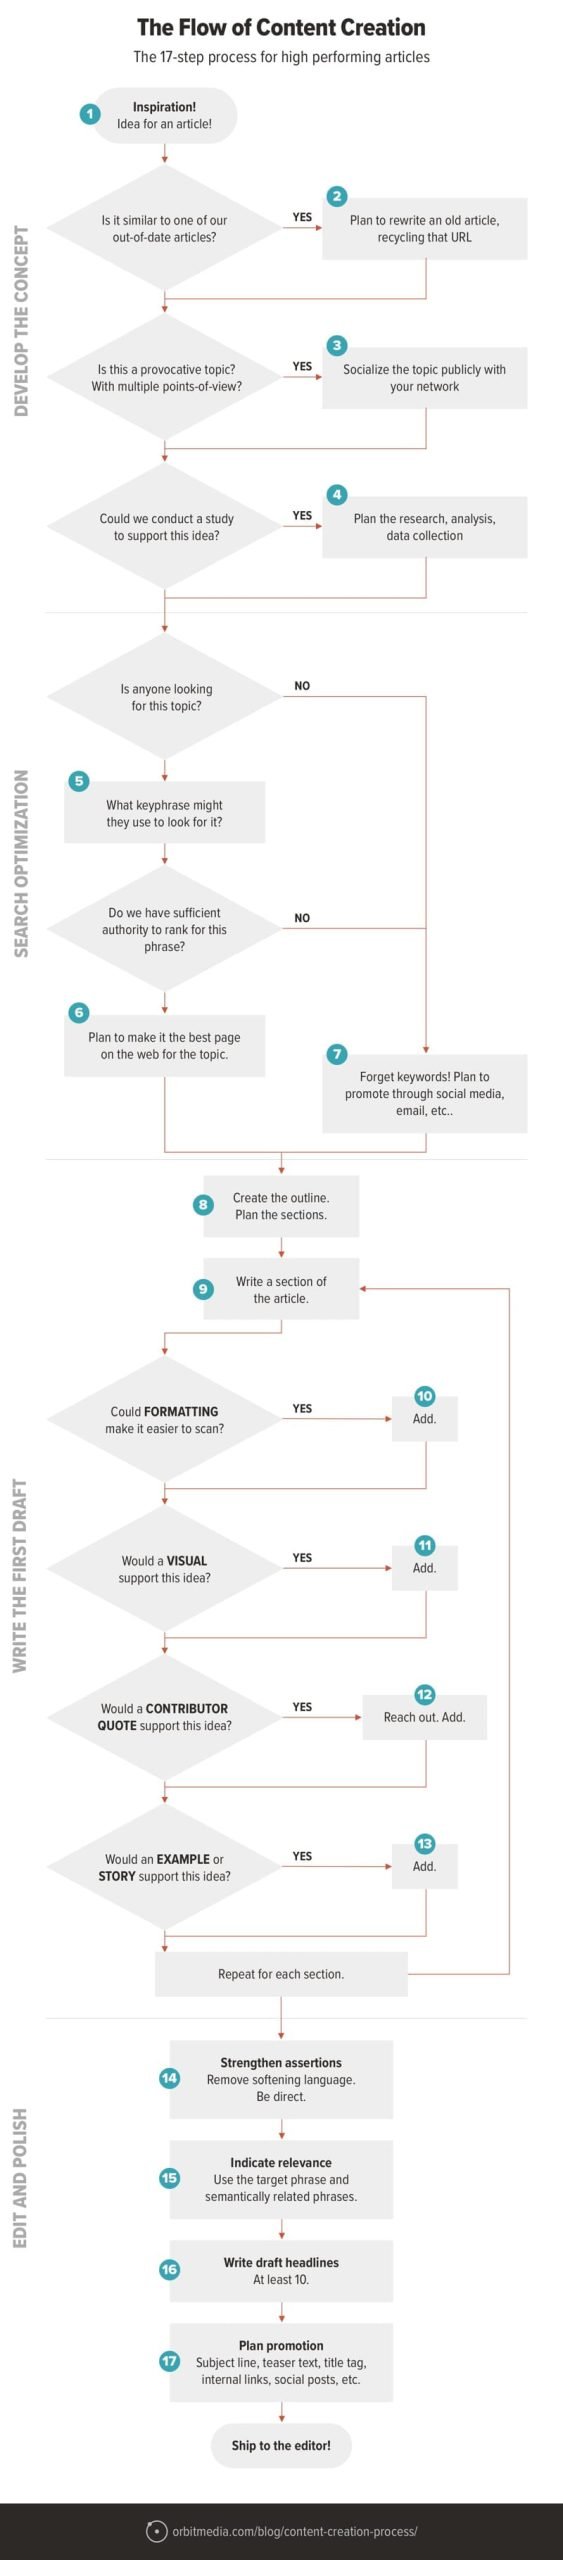
For instance, here’s a workflow diagram showing the content creation process of an agency.
This flowchart example is simple and to the point. The structured top-down approach clearly shows users the content creation process and the decision-making that goes into it. I particularly love how this flowchart uses decision shapes intensively to represent alternative flows.
Here’s a template you can easily customize to create a workflow diagram.
Best Use Case: Identifying repetitive tasks for automation and optimizing workflows
Expert tip: Sam Speller shared the following insights about organizing your flowchart logically.
“The flow should be organized logically and this is one of the primary principles we abide by. For example, when we did a diagram for our order fulfillment process, we laid the steps out top down — from customer orders to delivery confirmation. This process gave an organic view of the step and we could saw the bottlenecks. We managed to bring down order processing time by 20% and increased overall efficiency with this solution. This logical sequencing ensures that regardless of who you are, be it a data analyst, or a person working on the machine on the ground, you can process the information without confusion.”
A swimlane flowchart is also one of the most popular types of flowcharts that show who is responsible for which part of a process. It derived its name from the lanes in a swimming pool. Each lane acts as a space for a business role or department in this flowchart.
In this flowchart, the processes are split into different channels according to their responsibility, making it easier for each department to see what they’re required to accomplish.
Therefore, teams find this type of flowchart a handy tool that helps them ensure they don’t get stuck anywhere in the process. Organizations with multiple departments primarily use swimlane diagrams to illustrate the cooperative business process.
However, anyone can use these flowcharts to avoid confusion around who owns what part of a process.
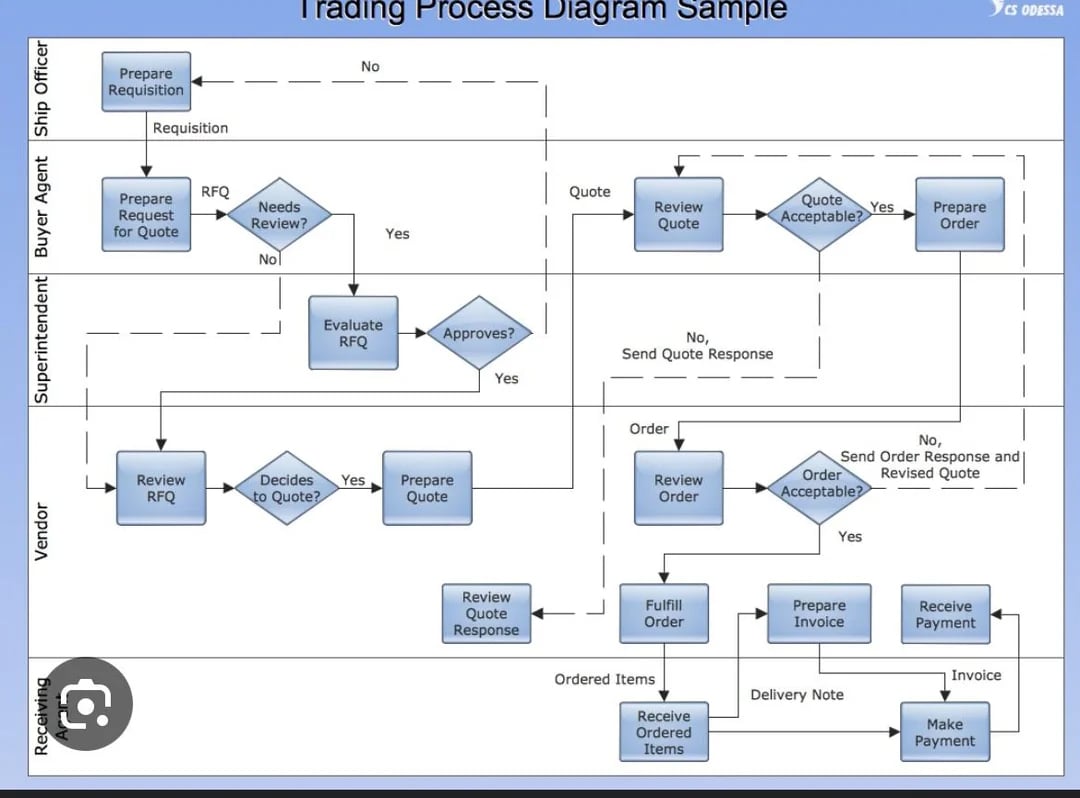
Below is an example of a trading process flowchart.
One thing I particularly like is how the decision points guide the flow seamlessly, ensuring there are no dead ends in the process. The use of arrows and consistent symbols keeps everything visually organized. If there’s one thing I would adjust, it would be adding slight color variations to distinguish different roles more clearly. This would improve the readability of the design.

Best Use Case: Mapping out processes across different departments or roles while showing interactions and responsibilities
Expert Tip: Alina Samchenko, the COO at Hire Developers Biz, emphasizes the importance of clarity in communication through visual tools.
“The best flowcharts explain everything at a glance. If someone can read it and understand what happens next and doesn't need any further explanation, you’ve succeeded.”
Data flow diagram, also called data flowchart, is one of the most important tools for structural analysis and design of information systems. It’s a graphical representation of the data flow for any system or process. It features symbols like rectangles, circles, and arrows to show data input and output.
These types of flowcharts are used in software development and design. However, you can use this flowchart for various other purposes. Use it for business analysis, agile development, business process re-engineering, system structures and many more.
Since each process may be subjected to decomposition in this diagram, the relationships between the structural components in the same notation can be shown on a separate diagram.
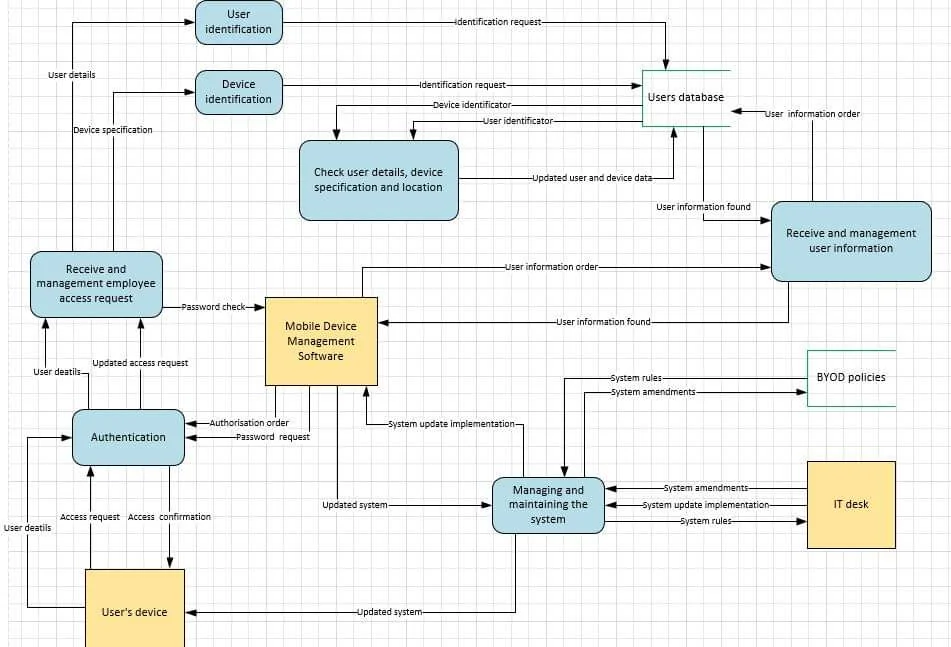
Here’s a real-life example of a data flow diagram.
This data flow diagram is a great example of how structure and clarity come together to illustrate a complex system. I love how the interconnected elements seamlessly guide the flow of user identification, device management and system maintenance. The mix of color-coded process blocks and directional arrows beautifully adds clarity of the design.

Best Use Case: Tracking the movement and transformation of data through a system.
Expert Tip: Keeping everything clear and consistent is key to avoiding confusion and errors. Loris Petro, the Marketing Manager at Kratom Earth knows this firsthand from his experiences with data flow diagrams. He shares some insights into how he approaches building these diagrams, particularly for their order processing system:
“When I create data flow diagrams, I make sure that each data flow remains consistent across all levels of the diagram. Let me illustrate this when I created a DFD for our order processing system. The Level 0 diagram showed a simple flow where a customer placed an order, the payment was processed and the order was sent to fulfillment. When expanding this into a Level 1 diagram, each step had to match the previous breakdown while adding more detail. The payment process, which originally had two inputs, had to maintain the same structure while breaking down into authorization, transaction confirmation and receipt generation. Keeping everything consistent prevented a lot of errors and made it easier for the team to follow.”
As the name suggests, system flowcharts describe how a system or program functions and interacts. These types of flowcharts are very similar to data flow diagrams or data flowcharts. Like data flowcharts, this flowchart is a way of displaying the flow of data in a system.

Furthermore, it uses symbols to illustrate the data flow and they are connected to show what happens to data and where it goes. However, the significant difference between these two is that data flowcharts only show the path, not the decisions.
A system flowchart is best used to physically model the system showing inputs, outputs, and processes. Thus, making it a helpful tool to track information while controlling the implementations along the way.
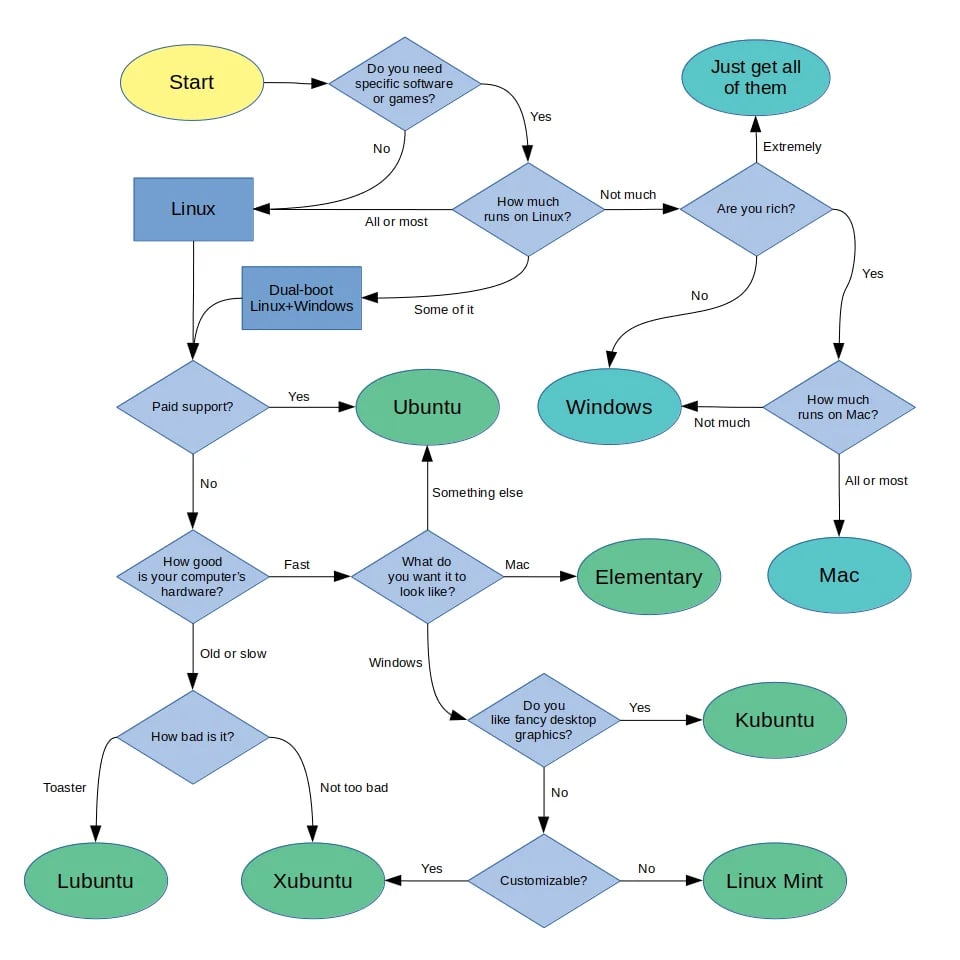
Here’s a fine example of a system flowchart.
Packed with clear decision points and witty phrasing, this flowchart keeps the selection process entertaining at every step. I especially love how the mix of blue and green tones beautifully differentiates between various OS choices.
Below is a system flowchart that you can easily customize right away.

Best Use Case: Illustrating System Architecture and the interactions of external inputs in a system.
Expert Tip: When you’re working on decision flowcharts, one of the most important things to keep in mind is how adaptable they are. Colleen Barry, Head of Marketing at Ketch, highlights how crucial it is to build these tools with flexibility in mind.
“It’s crucial to design your flowchart for flexibility and future updates. Compliance regulations and company policies change frequently, so your decision flowchart should be easy to adjust without requiring a complete overhaul. Using modular components allows you to swap out individual steps rather than rebuilding the entire chart.”
Are you too indecisive about making a rational choice quickly? Then a decision flowchart can be a beneficial tool for you, especially when decision making is an integral part of your daily activities.
A decision flowchart is one of the most popular flowcharts as they help make decisions in the order they need to be made. It enables you to visualize every possible outcome of your process and ensure that you have made the best decision possible.
So, if you are a business owner, project manager or any other professional with decision-making responsibilities, you should be well versed with these types of flowcharts.
It can help you visualize the number of processes involving interdepartmental or cross-functional teams, help team members understand their responsibilities, help the team members make decisions depending on the answers they get throughout the process and many more.
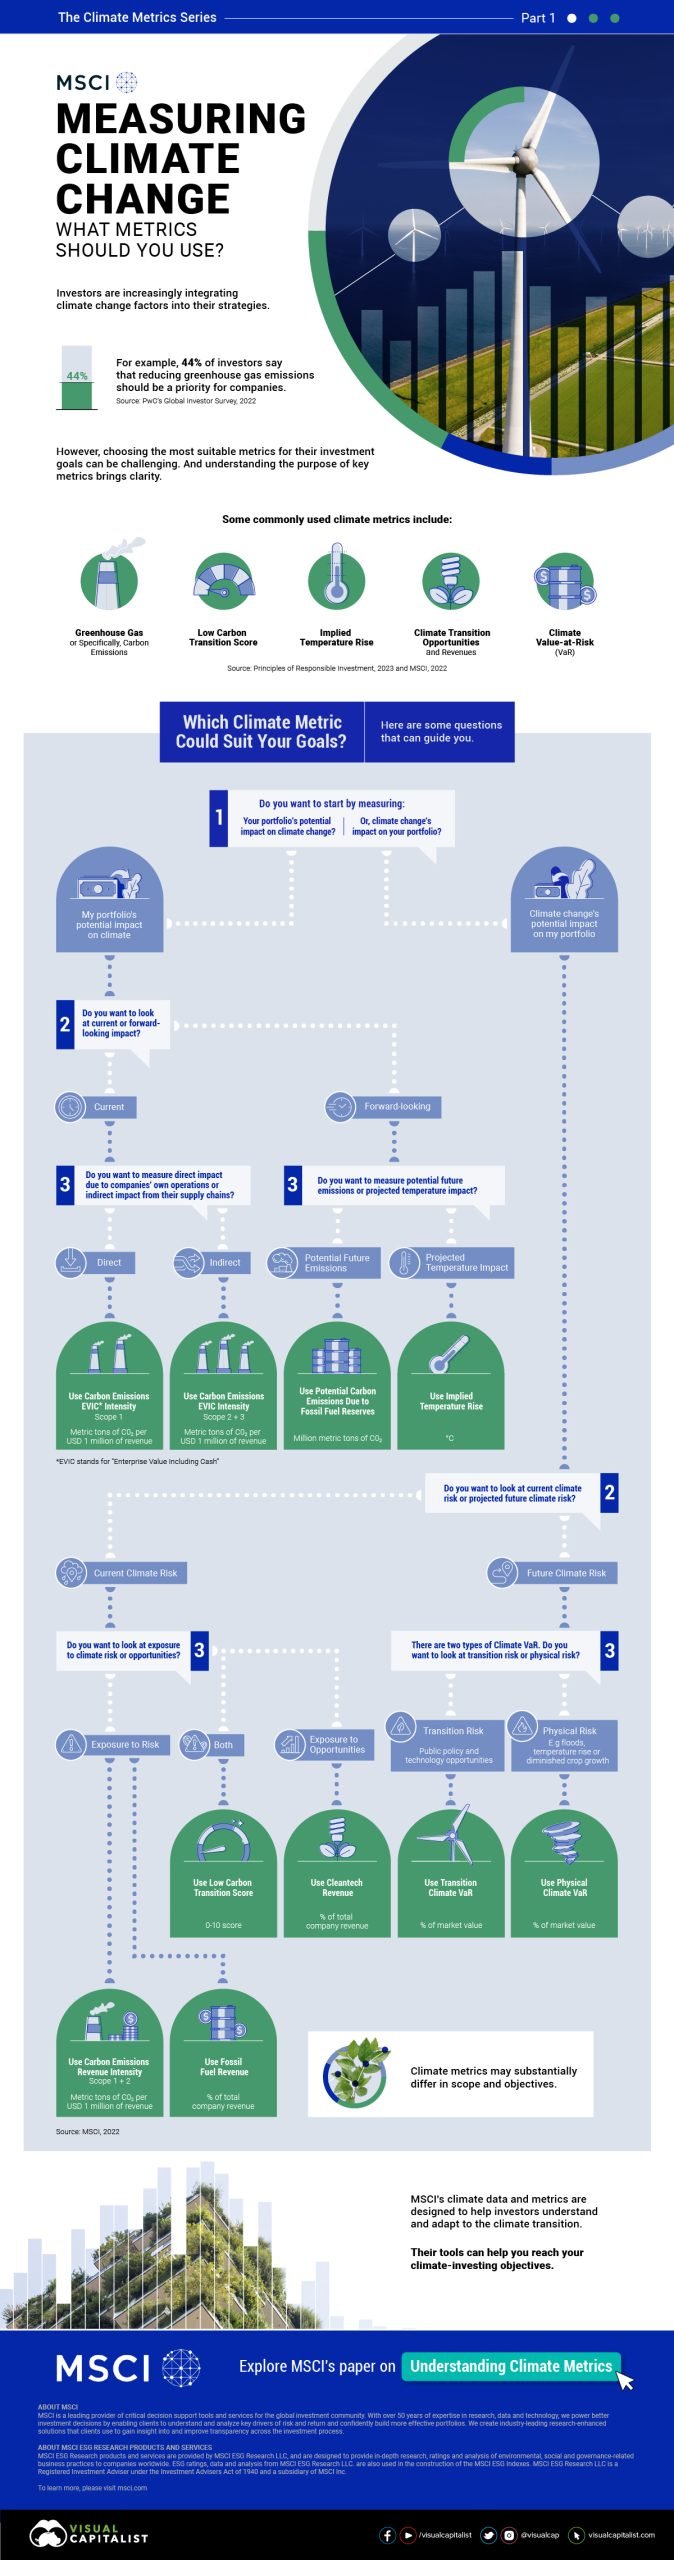
Below is a great example of a decision-making flowchart.
With a structured layout and crisp blue-and-white color scheme, this flowchart creates a clean, professional look. I love the clear segmentation of questions and how the visual icons at the bottom reinforce each choice. The balance of text and space also ensures that the information remains digestible.

Best Use Case: Evaluating business strategies, risks and outcomes.
Expert Tip: Making financial decisions can often feel overwhelming, but it doesn’t have to be. Chris Heerlein, CEO of REAP Financial, understands this well and emphasizes the need for simplicity in decision-making tools.
“We design our flowcharts to be simple and action-driven, making decisions clear and easy to follow. Too many branches or excessive detail can make it just as confusing as the decision itself. Every step should lead to a clear action, whether it is withdrawal from Roth IRA first or delay withdrawals until age 73. If a decision flowchart requires explanation, it is too complicated.”
Algorithm flowcharts are great for breaking down complex algorithm processes into clear, bite-sized steps.
Programmers often use this kind of flowchart to plan and structure their algorithms before jumping into coding. With a clear, big-picture view of the process, debugging becomes much easier. For instance, you can quickly pinpoint logic errors, unnecessary steps, infinite loops and more.
An algorithm flowchart also helps to explain an algorithm’s functionality to non-technical team members and stakeholders, as it simplifies complex technical processes into clear, easy-to-follow steps.
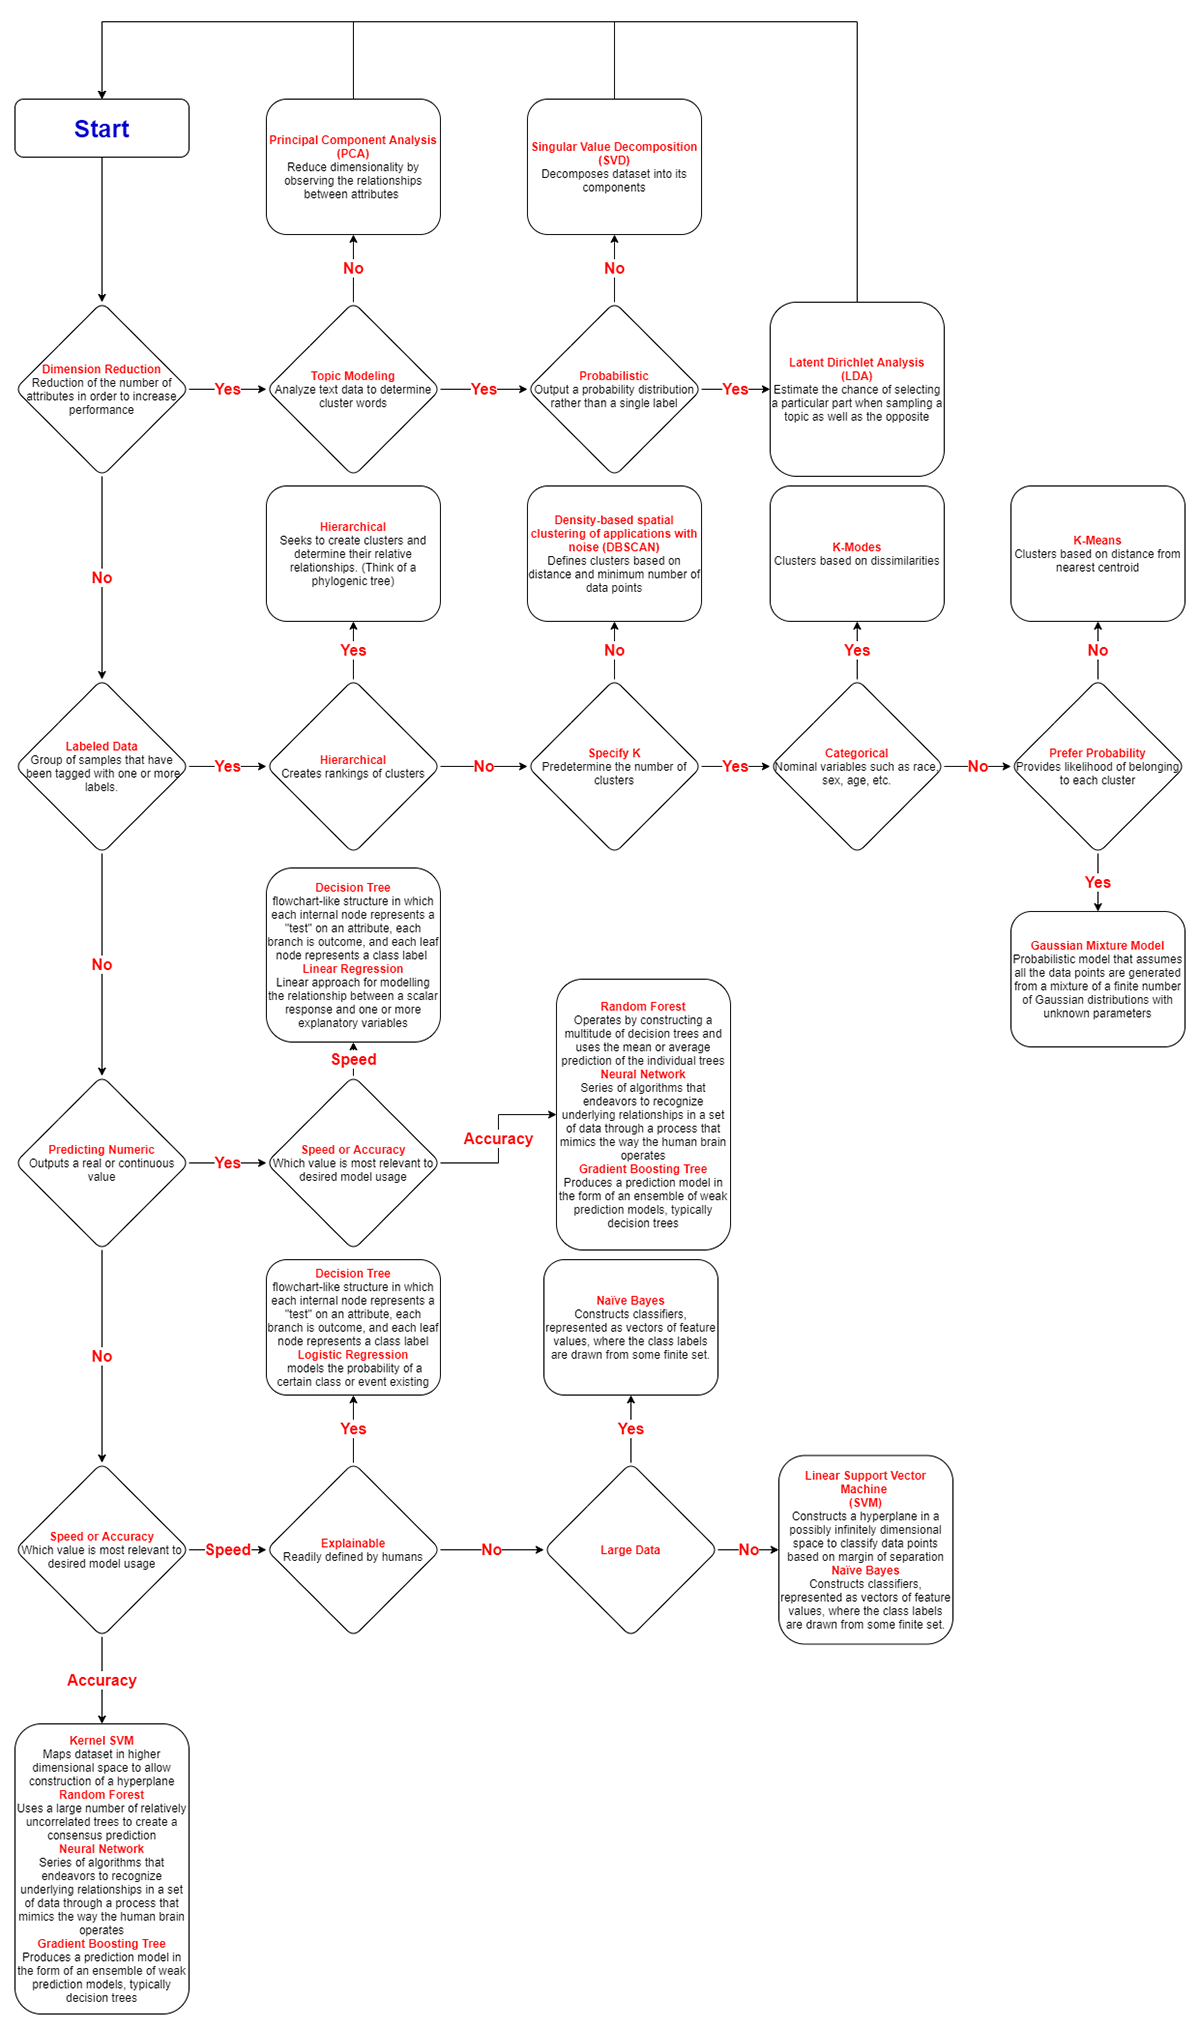
Below is an example of an Algorithm flowchart.
Talk about structure, detail and clarity, this flowchart checks all the boxes. It visually maps out different algorithm selection paths based on key factors like labeled data, dimensionality reduction, clustering needs and accuracy vs. speed trade-offs. The use of red-highlighted algorithm names also makes it easy to spot different options at a glance.
Best Use Case: Mapping out the steps of an algorithm before coding and debugging.
Expert Tip: Andrew Lokenauth, founder at TheFinanceNewsletter.com shared this insight about designing an algorithm flowchart.
“If you're designing an Algorithm Flowchart for a project, you’ll want to clearly depict each decision, loop, or computational step with clear, logical connectors. It shouldn’t be too abstract – each step should practically shout, "This is what you do next."
If you struggle with keeping track of documents as they move through different departments? A document flowchart is your best bet. You can use it to lay out every step of a document process: who drafts the document, which departments review it, and who needs to sign off before it’s final. It’s a simple way to keep everything organized and make sure nothing gets missed.
This kind of flowchart is very useful for HR departments, auditing, compliance and fields where structured documentation process is crucial.
Here’s a great example of a document flowchart.
I like how this design comes with distinct color blocks that separate the roles of the contractor and event admin, making it easy to follow each step. The dashed lines and arrows ensure a smooth visual flow, while the text callouts provide helpful context for decision points. One thing I’d change is use a different icon indicator for approval and denial to make those outcomes more immediately recognizable.
Best Use Case: Tracking how documents are created, reviewed, approved, stored and distributed across different departments.
Expert Tip: In project management, being clear and organized is very important. When documents go through different stages, everyone involved needs to understand what’s happening to avoid delays and confusion. Andrew Lokenauth shares valuable advice on this topic:
“I think you should include clear indications of revisions and approvals, so you understand where delays might crop up. The best tip is to align each part of the document’s journey neatly; even a small misalignment might cause misunderstandings.”
While flowcharts are quite versatile, they fit certain use cases better than others. Flowcharts are especially best for:
Here’s a step-by-step guide to creating a professionally designed flowchart.
Before you start creating a flowchart, you need to be clear on what process you’re mapping. Ask yourself: Am I mapping out a process to improve efficiency, train others, or document a standard procedure?
Identifying the purpose also helps you choose the right flowchart type—whether it’s a basic process flow, a decision tree, or something more complex.
The next thing to do is to break the process or workflow down into core steps or activities. This might require you to collaborate with the people who are directly involved in the process or do extensive research about the intricacies of the process.
Once you have all the necessary details, organize the activities or steps in the proper sequence until you have a clear path from beginning to end. Here’s a simple way to do that:
Creating a flowchart from scratch can feel overwhelming, especially if you’re a beginner. The good news is that Visme has a huge library of flowchart templates that make the process easier.
Just head to the dashboard, search for flowcharts and pick a template that matches the complexity of the process and the level of detail required.
Once you find one you like, just hover over it and click Edit to start making it your own. Visme’s drag-and-drop editor is very intuitive. Even if you have no design experience, you can easily get the hang of it.
And if you’d rather build from scratch, Visme’s diagramming tools in the toolbar have everything you need to put your diagram together, including flowchart content blocks or diagram shapes.
Now, it's time to draw your flowchart. Start with the main steps and add any decision points, inputs, or outputs as needed. You should ensure you’re using the standard flowchart’s symbols to avoid confusion.
Here are a few flowchart symbols and what they represent:

If you’re using Visme to create your flowchart, it’s easy for you to customize the size, color, border and roundness of your shapes, symbols and lines. Visme also allows you to design interactive flowcharts that are not only functional but visually attractive. You can even take it a notch higher and add some visual fun with icons, animations, pop-ups, illustrations, links, data visualizations and more.
Once you've completed your initial draft, review it with the team, clients or stakeholders involved. Get their feedback and make any necessary revisions.
Chris Heerlein, CEO of REAP Financial shared a key insight:
“One pro tip we have learned is testing the flowchart with real users before finalizing it. What makes sense on paper does not always work in practice. We have had clients walk through our charts while we observed their thought process. Seeing where they got stuck or hesitated helped us refine the layout, ensuring that every choice leads seamlessly to the next.”
Visme’s collaboration feature lets you work seamlessly with your team while creating your flowchart. Team members can leave comments, make edits and track changes all in real time.
But that’s not all; you can easily assign the full flowchart or specific aspects of the design to team members using our workflow management tool. You can set deadlines for completion, include a brief description and track progress and corrections—all in one place.
Now, it’s time to download and share your flowchart with your team members or audience. With Visme, you can either use a live link or download it in multiple formats, including JPG, PNG or PDF.
You can also embed it on a webpage or save it on Google Drive or Dropbox for easy access.
To learn more, watch our video tutorial for creating a flowchart using Visme.
Process charts are the most commonly used type of flowchart.
The type of flowchart you choose depends on your goals for the project. Here are some key questions to ask yourself to get some clarity:
The type of flowchart you choose depends on what you’re trying to achieve and the audience that’ll be using the chart.
A flowchart provides a detailed, step-by-step view of a process, including actions, decisions, inputs and outputs. On the other hand, a flow diagram focuses specifically on the movement of data within a system. Instead of detailing actions and decisions, it highlights how information is processed and transferred.
The key difference is that while structure charts provide a complete view of a system’s architecture, flowcharts emphasize the process flow within the system.
Yes, Visme is one of the best flowchart design tools in the market. It comes packed with dozens of ready-to-use templates and advanced features to help you create professional flowcharts in minutes.
Hopefully, the article helped you be familiar with the most popular types of flowcharts and find the ideal one. Now, it’s your turn to make a flowchart.
You can create a flowchart by drawing it using pen and paper or in software like MS Word, MS PowerPoint and others; however, it requires a lot of experience in planning and design.
Since a large chunk of creating flowcharts go to designing, you can use a tool like Visme’s free online flowchart maker. With the easy-to-edit flowchart templates and drag & drop interface for quick and easy formatting, you can create flowcharts online quickly.
Whether you want to visualize an idea, memorize a business process, engage your audience by including an entertaining visual in your content or decide on a crucial business step, Visme has got you covered.
Design visual brand experiences for your business whether you are a seasoned designer or a total novice.
Try Visme for free