


A Quick Guide on Sponsorship Marketing: Best Framework, Examples & Tools


If you’re looking to differentiate your brand and get readers to take action, making your blog posts interactive is one of the best things you can do.
Starting a blog is not that difficult, but writing interactive and engaging blog posts is an art.
Studies show that interactive content can drive 2X more conversions than static content.
And let’s not forget—the more time people spend reading and engaging with your posts, the higher you’ll be able to rank on search results.
In this post, I’ll show you 14 creative ways to make your blog more interactive. We’ll also discuss the benefits of interactive blogs and tools you can use to create them.
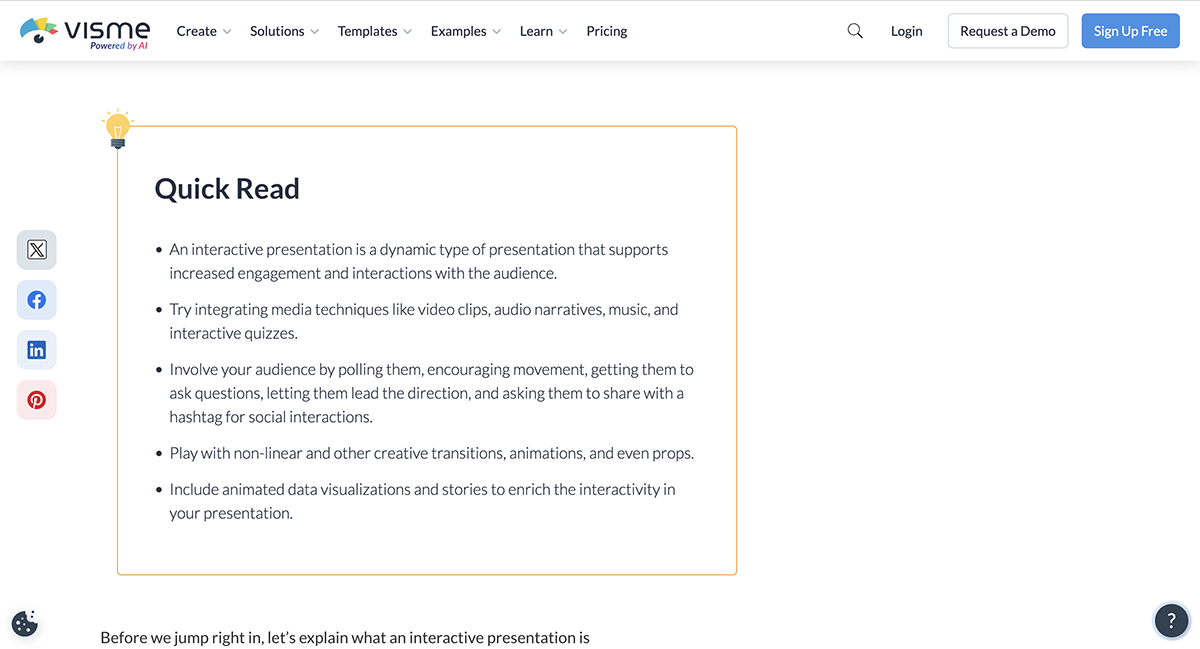
An interactive blog goes beyond traditional text and images.
It invites readers to actively participate in the content, such as by inputting information, making choices or exploring data visually. Think of quizzes, polls, interactive maps and even live chat where readers can ask questions and have a conversation with your brand.
For example, instead of just describing a process, you might include a step-by-step guide where readers click through each stage. Or you could embed a calculator that helps them solve a problem related to your topic.
The key is engagement—you're not just telling readers something, you're letting them discover and experience it for themselves.
Here’s why you need to consider adding interactivity to your blog posts:
Now, let’s look at some real-life interactive blog examples to inspire you.
Quizzes are a great way to get readers to stick around and interact with your content.
People love to test their knowledge on topics they’re interested in, or dig deeper into their personalities (even if it’s through a BuzzFeed quiz on “What type of vegetable are you?”.)
Huda Beauty adds mini-quizzes within their blog posts to engage readers and keep them scrolling till the end.
You can easily create a quiz in Visme by linking elements together. In a presentation, for example, you can link objects to different slides in a presentation, or to different elements within the same slide.
When you’re done building your quiz, simply generate an embed code to add it to your blog.
You can also use quizzes as a lead generation tool! At the end of the quiz, ask users for their name and email address so you can send them their quiz results.
Make sure you keep your quiz design and content in line with your brand voice and target audience. In Visme, you can save your brand colors, fonts and logo to create on-brand quizzes and designs every time.
You can also use our Brand Wizard to extract your brand’s visual elements directly from your website and apply them across all projects, including quizzes.
According to Wistia, visitors spend 2.6x more time on pages with video than without.
If you want people to stay on your blog post and engage with it for longer, embedding video content is the way to go. At Visme, we regularly add videos into our blog posts to keep our readers engaged.
For example, in our post below, we’ve embedded a video tutorial explaining how you can quickly create infographics in Visme.
Videos can do wonders for your blog engagement. Not only do they make your posts more interesting, they also make it easier for both readers and ‘watchers’ to consume your content.
Use Visme’s online video maker to quickly create animated videos for your blog posts. Put together a short video in minutes using our video templates. Export them in MP4 format or embed them directly using a snippet of code.
You can even track built-in analytics to see how your videos are performing. Keep an eye on views, average time spent and more to understand what works and where to improve.
Presentations are excellent tools for condensing information and long paragraphs of text into easily digestible slides. Plus, readers can actively interact with them by navigating through the slides.
Some would even prefer to view a presentation than read the entire post. Adding a disclaimer (e.g. “Looking for a quick summary?”) is a great way to get your message across to these people.
Make sure you add visual and interactive elements to your slides to make them more engaging. You can also add a CTA at the end of your presentation to drive people to take action.
Pro Tip: Struggling with coming up with the right words? Save time and use Visme’s AI Writer to generate text and compelling copy based on specific prompts.Here’s an example of an embedded presentation in our post.

You can choose from ready-made presentation templates in Visme. Customize your favorite one with an easy drag-and-drop editor that lets you create interactive slideshows that go far beyond simple PowerPoints.
You can add animations, transitions, pop-ups, rollover effects and even links to turn your slides into an immersive experience. Access millions of free graphic assets, such as illustrations, icons, shapes, stock photos and more from right inside the editor.
If you're showcasing statistics in your slides, use charts and graphs to visualize numbers. Change colors and fonts, or upload your own elements to create an on-brand presentation.
When you’re done customizing, simply generate an embed code for your presentation and add it wherever you wish to in your blog post. It’s literally that easy.
Videos are highly engaging, but can be difficult and time-consuming to create. A good alternative is to use animated GIFs instead.
GIFs can help you grab attention and add zest to your blog posts. They’re also more shareable than static images, and can sometimes be better at explaining concepts and ideas.
You can also use animated graphics instead of static screenshots to demonstrate an action, such as navigating through a tool or using a feature.
Using animation can help readers understand and retain information for longer. Here’s another example of how we use GIFs within our blog posts as visual aids.

Another way to use GIFs is to search websites like GIPHY to find something humorous and relevant to your target audience.
These types of GIFs are more flashy and have viral potential, but only if they align with your brand voice. If you’re using a pop culture reference, such as a GIF from a TV show or movie, make sure your audience is familiar with it.
Check out these animated blog graphic templates in Visme to create a GIF for your own post. You can also share these GIFs on social media or embed them into other web pages.
Data visualization can help you graphically represent boring numbers and statistics. But why stick to static charts when you can make them interactive instead?
Interactive charts are much more engaging as they demand involvement from readers to be understood and interpreted.
For example, readers can hover over different areas of your chart to get more information. You can even add animation to your chart to illustrate trends in a better way.
Here’s an interactive chart we created at Visme that compares our tool’s features with those offered by our competitors.
Hover over each slice of the chart to view detailed information about each tool’s features, rating and overall score.
You can easily create your own interactive chart using the Visme graph engine. Simply pick a chart template or type, customize the legend and appearance, and make it interactive by adding links, pop-ups, hover effects and more.
Pro Tip: Work together with your team using Visme’s collaboration tools. Comment, annotate and leave feedback to co-create content like interactive charts, presentations and infographics remotely.
Marketers love infographics for many reasons.
Not only are infographics statistically proven to improve reading comprehension, they’re shareable, skimmable and fun to look at.
But if you’re just creating static infographics, you’re doing nothing new. Thousands of brands create static infographics on various subjects each day.
To stand out, you need to create interactive infographics that involve readers in the learning process.
This could be as simple as adding motion effects or animation to your infographics.
Here’s an example of an animated infographic template that grabs your attention.

Or, get people to click or scroll as they navigate through your infographic. When readers have more control over the information they consume, they’ll be more likely to remember it.
Plus, interactive infographics can hold a lot more information than static infographics, without cluttering up the design.
Take a look at the interactive infographic below.

In the example above, clicking on each type of dog will reveal more information about that specific breed. This means the infographic design never looks messy as text is only displayed when needed.
Creating interactive infographics is simple and easy with an online tool like Visme. You don’t need to hire a designer, developer or animator to make one. You can simply use a template and add interactivity to it using our drag-and-drop tools.
Check out this video on how to create an infographic in Visme.
If you’d like to learn more about creating and using infographics, here are a few additional resources to help you out.
An interactive blog post inspires readers to take action, even if that action is sharing your content with colleagues, friends and family.
But if you want people to share your blog post, you need to make it easy for them to do so. For example, add social sharing buttons to your posts so readers can quickly share them on their favorite platforms.
If you’re running a WordPress site, you can use a plugin like AddThis to enable social sharing on your blog.
We’ve enabled social sharing on this blog post, too! Take a look at the left side of your screen and you’ll see a list of icons like the ones below.
Entire blog posts are not the only thing you can make shareable.
WordPress plugins, such as TweetDis, can help you turn selected quotes into snippets that readers can share on their Twitter feeds with a click.
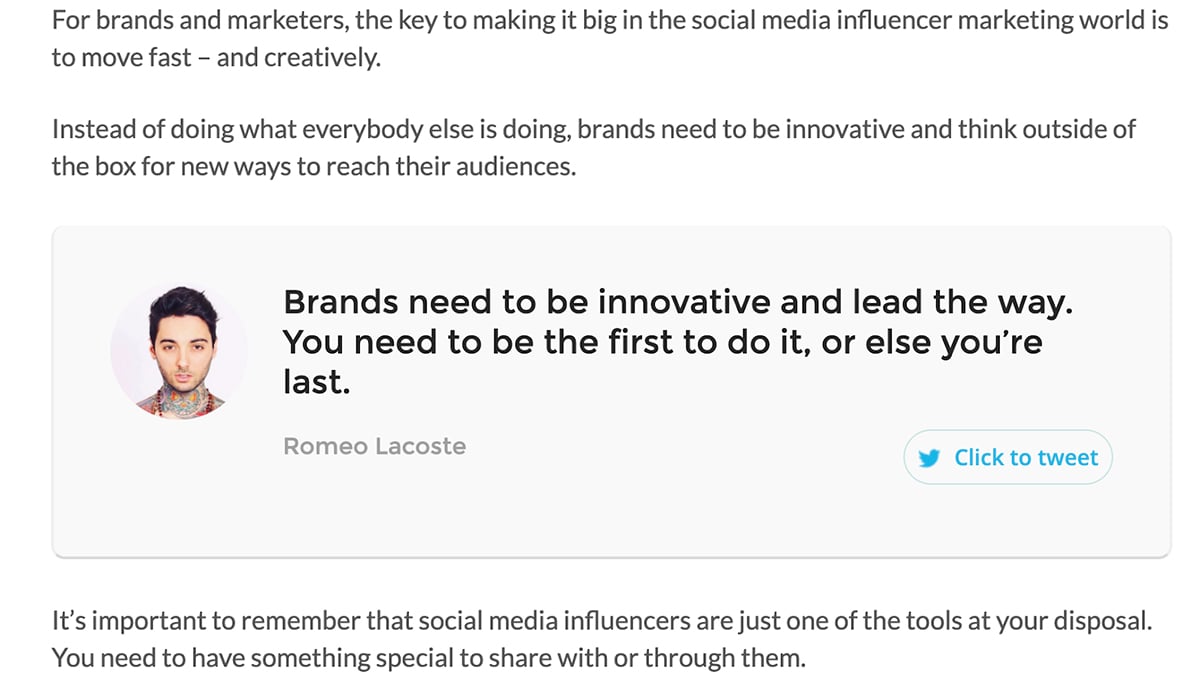
Plugins often come with various design options for tweetable images, quotes and sentences. Tweetable quotes are great for inviting interaction from readers, and has the added benefit of driving more traffic to your blog posts.
If you’re running a blog for marketing purposes, you likely include CTAs, popups and opt-ins at various points in your blog post.
But why not engage readers in a conversation instead?
This is exactly what interactive chat does. Adding a personalized, interactive chatbot to your blog can help you capture leads and even convert readers into customers.
Here’s an example of how Tidio uses interactive chat to capture leads from their blog.
The chatbot pops up after visitors spend a certain amount of time on a post. It offers a helpful resource for download that a reader can choose to accept or reject.
If they accept the chatbot’s offer, they’ll be taken to an opt-in screen where they can leave their email address to get the resource.
Interactive chatbots are more effective than static CTAs as they engage readers in a two-way conversation. This makes readers feel more in control over the decision to download a resource or share their details.
If you choose to use this method, make sure you personalize your chatbot conversations so they’re relevant to the specific blog post or category.
One of the best interactive blog post ideas is to add a calculator to your posts.
An interactive calculator computes information based on data entered by the user, which helps you deliver personalized experiences on your blog. This helps readers stick around as they actively engage with content that’s tailored to their own needs and interests.
For example, a travel agency can build a calculator that lets visitors calculate the estimated cost of a trip based on their budget, expectations and travel preferences.
Here’s another example of a calculator that helps freelancers figure out their hourly rate.

:new Image Source
An added benefit of creating a calculator for your blog is you get to collect insightful information about your target audience. In the example above, the website will be able to get a good idea of the typical income expectations and average expenses of freelancers.
Another way to make your blog post interactive is to add a table of contents with anchor links, which lets readers jump to sections they’re most interested in.
Here’s how Visme adds clickable sections into our longer blog posts.
Adding anchor links to sections makes it easier for visitors to find relevant information that they want to consume, which is good news for your blog’s engagement and dwell time.
If your post includes geographic information, visualize it for readers with an interactive map.
For example, you can illustrate population data for various countries, or draw a comparison between different regions using a map on which readers can click, scroll or hover to learn more.
Here’s an interactive map that showcases the number of coronavirus cases in the US.
Hover over each state to see the number of cases and deaths for each one. An interactive map like the one above can make readers engage with it and stick around for longer.
It’s super easy to create an interactive map for your own blog post. Visme comes with several quality map templates that you can customize, share and publish, and embed on your website. Check out this step-by-step guide to creating an interactive map online.
Spice up your blog posts and make them interactive by adding a virtual tour. For example, real estate businesses can embed 360 virtual tours of property listings within their posts.
Check out this virtual tour of Spain published by a travel blog.

Virtual tours offer a safe, convenient alternative to experiencing places of interest.
This is especially relevant during COVID-19 as more and more people are opting for online experiences than visiting places in-person.
Boost your blog's impact and engagement with interactive forms. Embed them right into your posts to get readers involved and gather valuable data.
For example, you could collect feedback, run a survey or just create an easy way for readers to get in touch with your brand. You can also generate leads and build your email list in exchange for a lead magnet or newsletter subscription.
Here’s how Pipedrive does it:
Visme’s interactive form builder lets you create many forms. They’re incredibly easy to put together in a drag-and-drop editor, and you can even add animated characters for an extra personal touch. Embed them anywhere with a snippet of code or share them directly with a link.
 Pro Tip: Use our ready-made templates for newsletter forms, feedback forms, lead magnet forms and more to get started quickly.
You can also access built-in form analytics to track metrics like form views, starts, completions, submissions and average time spent to understand how your forms are performing.
In this digital age, creating static content will only get you so far. To truly captivate your audience, you need to offer an experience, not just information.
Interactive elements like quizzes, polls, slideshows and data visualizations make your blog posts more memorable and engaging. They invite readers to dive in, explore and connect with your content on a deeper level.
Ready to spruce up your blog? Visme makes it easy to create stunning interactive content, even if you're not a design pro or tech whiz.
Sign up for a free Visme account today and transform your ideas into engaging, interactive experiences for your blog.
Design visual brand experiences for your business whether you are a seasoned designer or a total novice.
Try Visme for free