


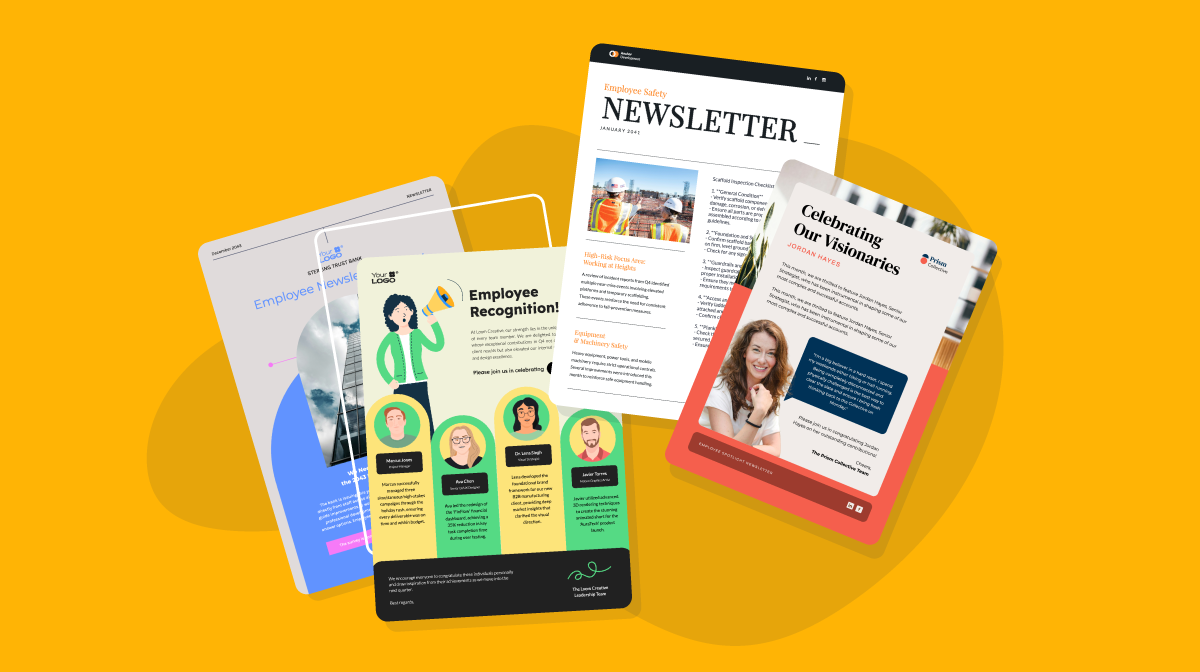
14+ Employee Newsletter Examples, Ideas & Templates

Many factors that lead to a project’s delay, complication or even failure are preventable. Poor stakeholder communication is the primary contributor to project failure 33% of the time and hurts project success more than 50%.
The Project Management Institute (PMI) considers communication an essential power skill for project managers to lead successful projects. Using a visual stakeholder map to create a detailed communication plan can increase the chances of your project reaching its goal and more.
In this guide, we review the most pressing topics about stakeholder mapping and give you a collection of 6 stakeholder maps ready to use immediately.
Let’s get started.
A stakeholder is any person, organization or entity directly or indirectly related to or affected by your project. Any stakeholder can either help or hinder your project’s success.
Stakeholder mapping is a critical step in stakeholder management which in turn is relevant in every aspect of a business. Visually, a stakeholder map is a grid or table where you place stakeholders according to a rating scale.
As a tool, stakeholder maps are helpful in project management, product development, and any business initiative that involves a process and a group of people affected by the process. The practice of mapping stakeholders is essential to knowing who the involved parties are in any project or business endeavor.
They’re also used in design thinking for UX, scientific research, and social initiatives, not just for project management.
In business, "shareholders" and "stakeholders" always come up in conversations. They’re both critical to business success but aren’t interchangeable because they’re not the same thing.
A shareholder is a stakeholder, but not all stakeholders are shareholders. A shareholder owns shares of the company’s public stock; they might or might not be invested in the project. A stakeholder might have financial ties to a project, but not all do. Stakeholder mapping helps differentiate the two.
Made with Visme Infographic Maker
Stakeholders are categorized into two groups; internal and external.
When creating the map, you’ll have to rate and categorize the list of both types of shareholders. To visualize internal and external, use a color label or tag next to the stakeholder name.
Stakeholder mapping is critical during the strategy and planning stages of every project. Especially if you’re:
It’s during these preparatory and roadmap stages that you need a stakeholder map to analyze stakeholders in detail.
Understanding the scope of your stakeholders’ influence leads to better project roadmapping and easier decision-making. By mapping them out and assigning tags or colors, you are adding qualifiers to each stakeholder and highlighting their power, influence, or interest in an outcome.
Stakeholders maps are also critical in assessing the risks and impact your stakeholders may have on the project’s outcome. With the map, you can see which stakeholders will be beneficial in the ongoing process and which others might cause an obstacle or block.
Using a stakeholder map, you can navigate risks by communicating effectively with each stakeholder. Take advantage of the knowledge you’ve acquired with the map, and communicate with each stakeholder differently and directly.

Apart from being the foundation for effective communication plans, stakeholder maps have other benefits for business management.
Getting started with a stakeholder map is simple. There are no prerequisites apart from having a project goal and a list of stakeholders. All the analysis comes after the map is started while it’s being completed and updated.
Helene Dunbar HouseCalls feel great about this benefit, “I don’t feel like I’m recreating the wheel anymore. Visme is so easy and it gives me ideas that I wouldn’t have if I was just starting from scratch in InDesign.”
A stakeholder map does two great things for project management. It helps identify key players at a glance while alerting you to potential conflicts early on from stakeholders that aren’t supportive.
Knowing where your stakeholders stand is the first step to building meaningful relationships with them. You build respect and trustworthiness for your team by communicating with stakeholders about this and other projects.
Stakeholder buy-in and engagement depend highly on how you communicate with them during the project. Some stakeholders might have high interest but need more knowledge. If you raise their knowledge rating, you can easily achieve buy-in from them.
Likewise, a map that drives honest and clear communication for internal stakeholders improves ownership with product owners, managers and agile team leads.
Stakeholders are the ones that can give you the resources you need to finish the project successfully. When you know their interest, power and knowledge rating, you’ll see how to communicate with them to get the needed resources.
Always look for a way to connect with stakeholders on a personal level. Show how the project will affect them positively, and it’ll be easy sailing for resource management from beginning to end.
Stakeholder mapping can be achieved in a variety of ways. The most common and widely used stakeholder model is the power/interest grid. But ultimately, your specific stakeholder analysis needs will be a decisive factor for which map you use.
Let’s look deeper at the power/interest grid and three others.
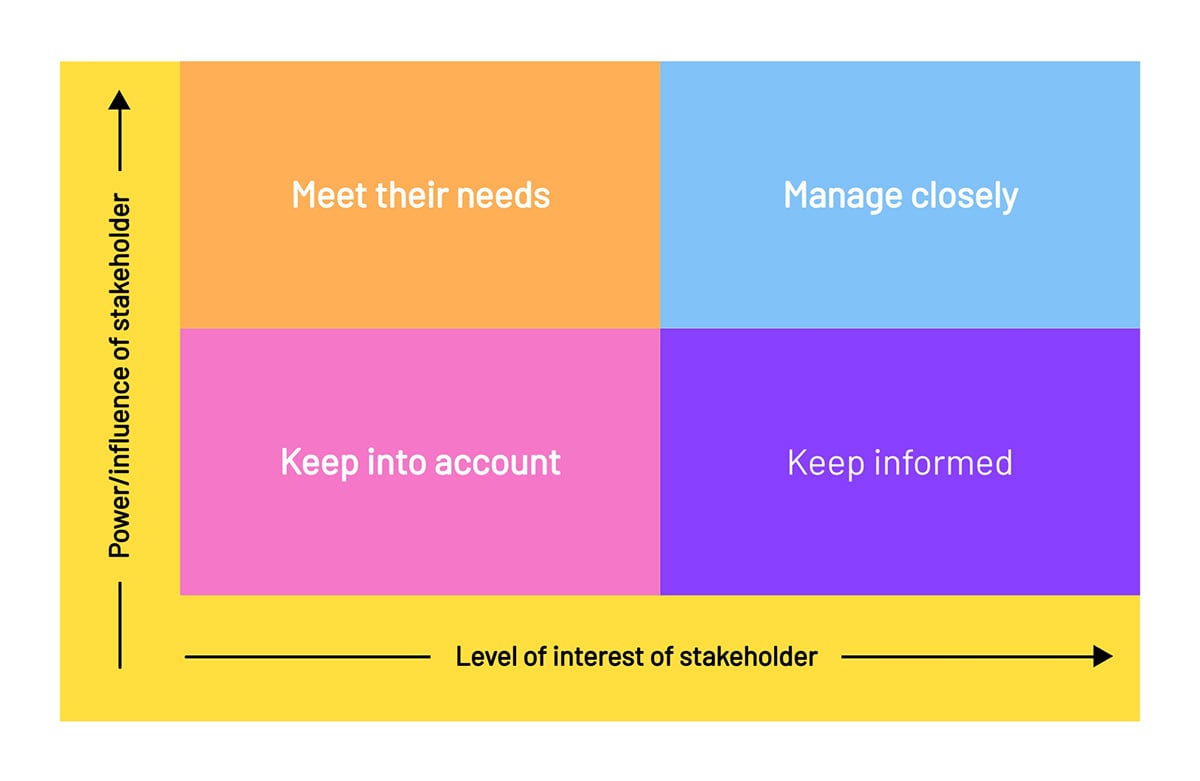
Also called Engagement Matrix, the Power/Interest Grid categorizes and maps stakeholders according to how much power—or influence—they have concerning their interest in achieving the project goal. This is the most common type of stakeholder map.
The grid has four quadrants with these combinations from top left in clockwise order; each has a particular communication type as well:
You can adapt a power/interest grid to rate stakeholders by power/predictability, knowledge/attitude or knowledge. Stakeholder maps are subjective in nature, so rating stakeholders in the way that best relates to your project will help in the long run.
With a stakeholder relationship map, you can visualize the stakeholders’ power and interest—or other rating systems—and their relationships with each other.
Visually, this map combines a matrix with a bubble chart connected with lines. Each stakeholder is a bubble; its size defines the degree of influence, while the position visualizes their involvement level. The lines represent relationships, and their thickness is the relationship's strength.

Visually resembling a spreadsheet or table, a stakeholder heatmap is a register of names along with their influence and power rating. The rating system is visualized with a color gradient that resembles heat colors from red to light green.
Red is the hottest and, therefore, more important. The power rating diminishes as it changes to green. Our example below uses six colors to show a rating scale from very low to extreme. Light green is very low involvement and dark red is extreme involvement.
What makes a heat map more efficient than a grid is the inclusion of notes about each stakeholder’s engagement and impact on the project. The colors and legend pinpoint key players and problematic areas quickly. A stakeholder heatmap is a living document that is edited regularly until you reach the goal.
Create a collaborative stakeholder map at a moment’s notice with Visme.
Here’s how.
First, choose the workspace in your Visme dashboard or create a new one. Invite all the people who will be involved in creating the map.
But first, what should a stakeholder map include? These three things:
Begin by defining a goal for your project. The more specific it is, the easier it’ll be to choose, rate and map stakeholders.
For example, instead of creating a stakeholder map for the “Annual Report,” define a goal like “Design annual marketing report to share digitally and in print” or “Build an annual financial report strategy.”
Keep in mind that for each of those options, the stakeholders will be different. Be as specific as you can when setting a goal, and include it at the top of the stakeholder map to have it as a reference.
Make a stakeholder register or list where you’ll organize and tag them before adding them to the map. You can start with simple tools like Google Sheets or create visually appealing tables with Visme’s intuitive editor.
How do you pick stakeholders? Here are a few tips:
Using the list, rate the stakeholders by power and influence—or the other parameters you’ve chosen. Rate them for more than two parameters for a deeper analysis. Use the same scale from 0 to 10 for all characteristics.
Group the stakeholders into quadrants and by category. Use tags, labels and a legend to see the big picture at a glance. Create filterable spreadsheets by tag, color, or type.
Select a template from the stakeholder map collection in the next section and prepare to make it your own.
Have the Power/Interest grid ready with X and Y axes starting at 0 and going up to 10. Place Power on the vertical axis and Interest on the horizontal.
At the 5-point line on both, draw two lines creating a cross and four quadrants. Now plot the stakeholders according to their ratings. To make it more interesting, include photos of the stakeholders or icons to represent them by category or label. The best part is that doing this with Visme is super seamless.
Have other people review the map before going ahead. A stakeholder map is highly subjective. If other invested parties don’t agree with what you’ve mapped, you’ll have trouble down the line. Be sure everyone involved agrees.
Constantly revisit the map while the project advances, as any changes could occur. Give access to the stakeholder map with further editing or commenting rights. The map can live inside your Visme workspace as long as needed and it is always ready for an update.

Achieving all that verifying and updating is easy with Visme’s collaboration tools. Within one workspace, you can add team members and task them with reading, reviewing and giving feedback. Likewise, you can task them to update the map regularly or when things change.

Avoid these mistakes at all costs when creating your stakeholder map:
1. Not setting a clear goal. When your stakeholder map doesn’t have a goal, it's impossible to know who the stakeholders really are. You have to be specific. Instead of a map for “Marketing,” make it for “Marketing campaign on social media for Q1”.
2. Doing the rating and analysis alone. Stakeholder maps are highly subjective at first. Rating the stakeholders for analysis involves making a decision. You can’t make these decisions on your own, especially if your project involves a lot of people, more so if they have high expectations.
3. Doing and forgetting. Creating a stakeholder map to then leave it in a closed folder is a no-no. You must always check on and update a stakeholder map to know where stakeholders stand. Some might have increased their rating or aren’t relevant anymore. Either way, you’ll have to adjust communications and the map itself.
4. Using the same communication style for all stakeholders. Every stakeholder is different. Tailoring communication according to their personal relationship with the project is the most straightforward way to keep them engaged. Always maintain clear communication regardless of the channels you use.
This stakeholder mapping example is an engagement grid for engagement. Simply choose the other variable and add the horizontal line. Consider variables like power, influence, interest, and relationship. Use a color chart to describe each characteristic. We’ve left all sticky notes yellow for you to build upon.
For all this stakeholder mapping work to be effective, you’ll need to accompany the stakeholder map with a stakeholder analysis. You can link the deeper analysis with ongoing notes to the map with a hyperlink button.
Alternatively, create a stakeholder dashboard document where you also have the stakeholder map. All possible within Visme.
Use this influence matrix to determine how your team will engage with stakeholders throughout the project.
Map stakeholders per quadrant or plot with a rating number system. Add colors to the Post-its for another layer of information. Try adding a color per category or type of communication channel to differentiate the stakeholders even further.
When working on a project and undertaking all steps in a communication plan, be available and keep channels of communication open with stakeholders. They will expect you to get in touch with them regularly; when you do, they are more engaged. Inefficient communication leads to a loss of interest.
Use this heatmap template to categorize your stakeholders into 16 positions of varying degrees of interaction and impact. The number of placeholders can be the total number of stakeholders in that category or the category ID.
Combine this heatmap table with a stakeholder list or register to label each stakeholder properly.
Reference and update your stakeholder maps regularly. Levels of impact and interaction don’t always stay the same throughout development. Some stakeholders might switch positions, while others might leave altogether.
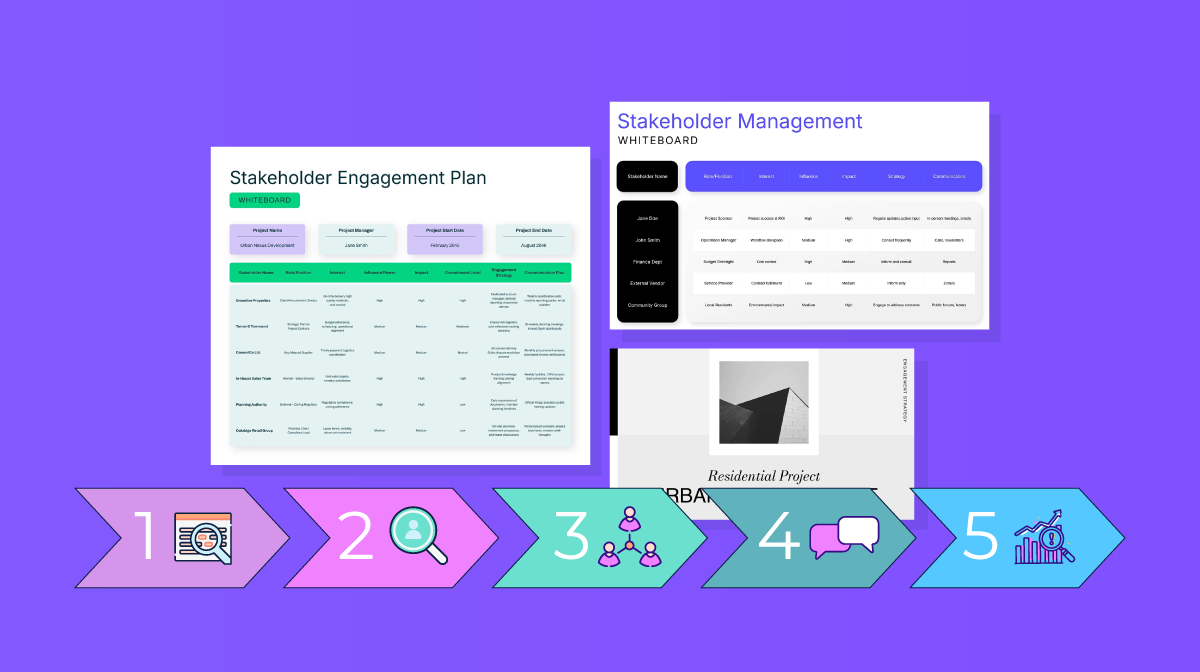
This stakeholder mapping template in the Visme infinite whiteboard is a base for a much more detailed analysis. The quadrants are labeled by their communication type, and the stakeholders' list is underneath. To make the map bigger, stretch the components to make them as big as you need.
Do you want to make your map look a bit different, more vibrant or more serious? Try changing the font. Our vast font library has hundreds of typography styles to choose from. Select the font style that best visualizes the information on your stakeholder map.
This influence/impact analysis grid has all you need to plot stakeholders where they need to be. Arrows and dots help visualize a rating scale, and the colors of the post-its add another layer of data.
This is a good option if you’re looking for a grid that can hold more analytic data. Remember always to add a color or label legend when creating stakeholder maps that lean more toward data visualization, like this example here.
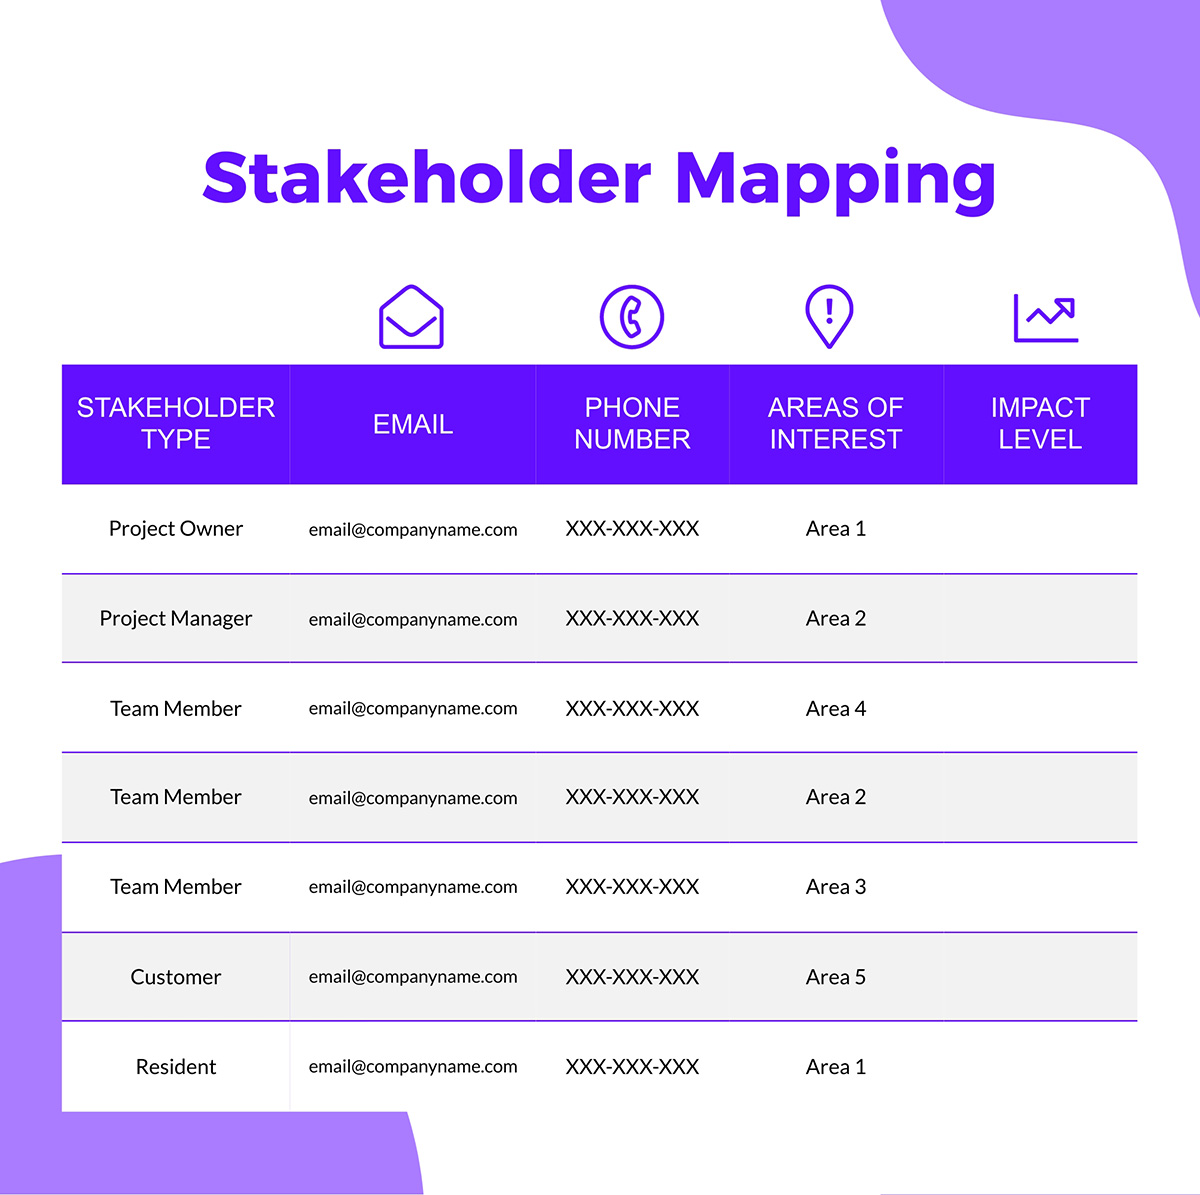
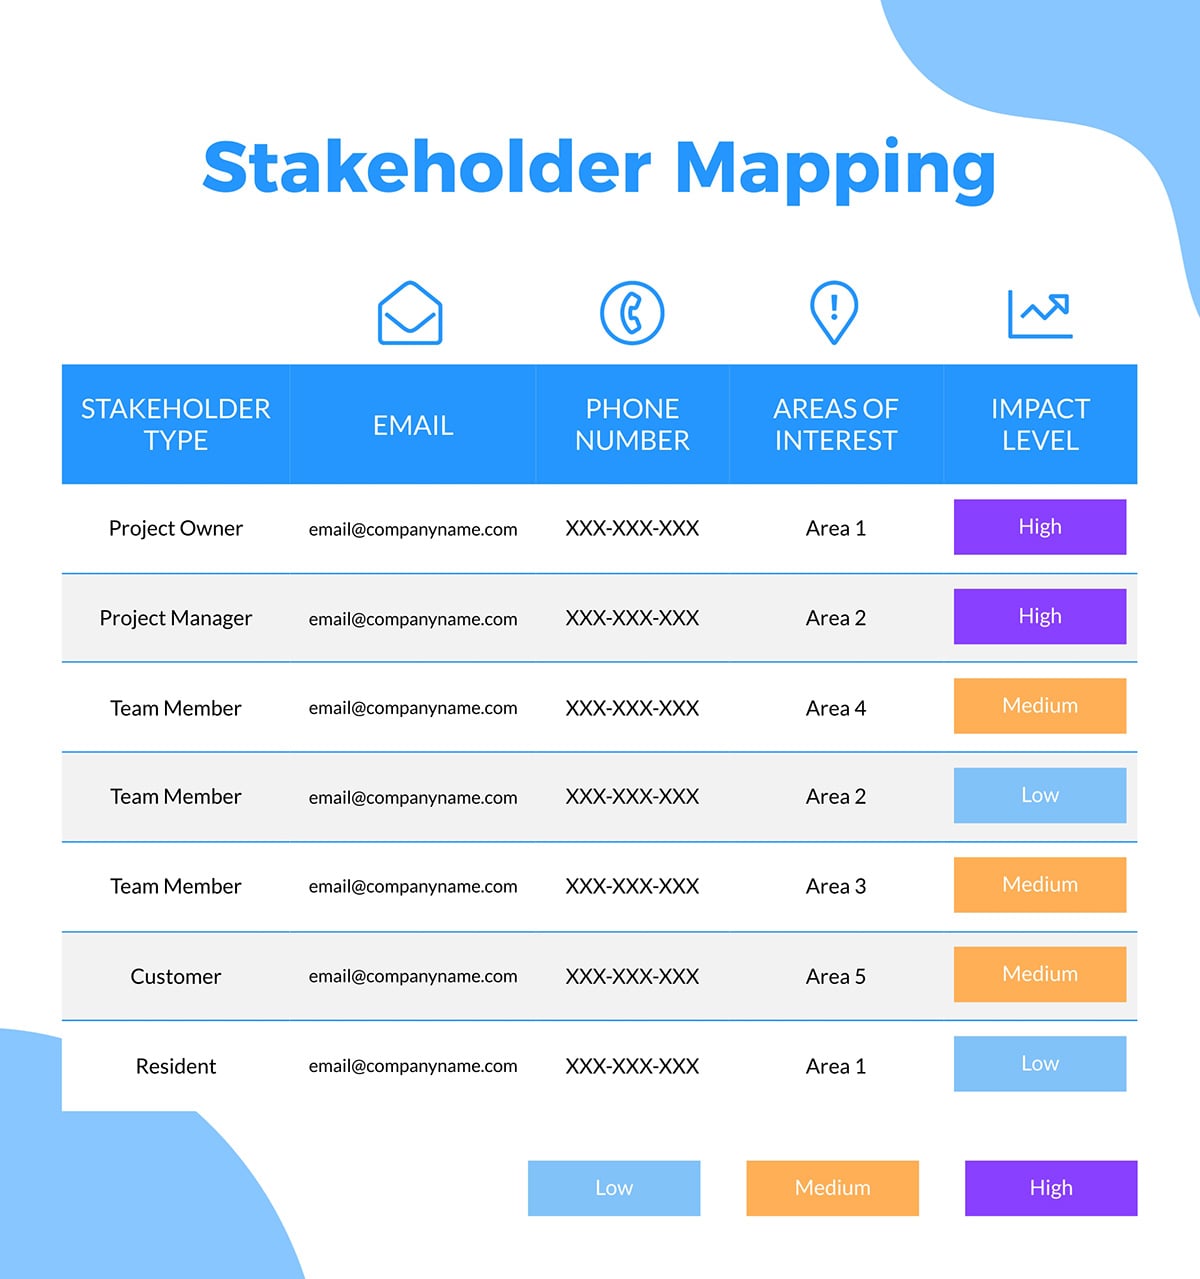
Use this table-style stakeholder map to plot stakeholders by rating their influence and interest in your project. Add a color coding legend to label what type of communication each quadrant group will receive. Combine this stakeholder map with more project management content and build a comprehensive communication plan.
Share the final digital document with your group via a live Visme link. If you notice you made a mistake after sharing, don’t worry. You can edit the map whenever you want and your viewer doesn’t need a new link.
Stakeholders maps are important for ideation, product development and project management. They help streamline communication and collaboration during projects.
With a Visme enterprise plan, you can create stakeholder maps that visualize people who can influence your project. You can access templates for stakeholder maps, communication plans, roadmaps, Gantt charts, reports, proposals, guidelines, surveys and other project management content.
Now that you know how important stakeholder maps are for communication, we hope you see you succeeding with more projects in the future.
Design visual brand experiences for your business whether you are a seasoned designer or a total novice.
Try Visme for free


![How to Create a Practical Crisis Management Plan [+ Templates]](https://visme.co/blog/wp-content/uploads/2025/07/How-to-Create-a-Practical-Crisis-Management-Plan-Thumbnail.png)