14 Expert UML Diagram Templates to Make Your Own


Do you need help creating UML diagrams that make sense and that your team can understand without obstacles? We have 13 expert solutions to solve that problem.
Visualize an activity flow or a state analysis of one of your systems. All you need are the UML building blocks, some critical thinking and the Visme diagram maker.
Choose the type of UML diagram you need and select the template that matches the system view you need to visualize.
Let’s start diagramming.
A UML diagram is used as a visual language to help teams understand how software and non-software systems work.
The letters in UML stand for Unified Modeling Language. Software engineers developed UML to unify and standardize how they visualized systems. UML has 13 official diagram types for different processes within a system’s functionality.
Even though UML diagrams originated as tools for software development, they are also practical in other business cases to visualize non-software systems. For example, a project management team may use a UML diagram to explain how each development step will flow or how the finished project will function.
Here’s what a UML diagram looks like
UML diagrams are helpful visualization tools before and after the production or development of a system. Before a development plan is executed, a UML diagram visualizes the action flow and how the final product should work.
Likewise, a UML diagram can visualize processes that have already been completed, such as helping with updates, follow-up procedures and onboarding new team members.

In total, there are 13 UML diagram types, separated into two categories; structural and behavioral. Their purposes are straightforward. Structural UML diagrams visualize how a system works, while behavioral UML diagrams visualize how they behave.
Made with Visme Infographic Maker
Although there are numerous UML diagram types, they all follow the same UML modeling parameters. All diagrams use the same visuals or building blocks, unifying their visual aspect.
All UML diagrams consist of these elements:
Each type of UML diagram has a purpose and functionality. The most common are class diagrams, followed by state diagrams and use case diagrams. Let’s take a look at each UML diagram type.
All structural UML diagrams visualize the structure of a system and how its parts work and communicate together. The UML components in the diagrams describe the system framework and its interconnected parts. All structural diagrams correlate with each other and function as a group.
Class diagram: A class diagram visualizes the structure of a system using classes, attributes, methods, and the relationships between them. The UML building blocks for class diagrams are boxes with three partitions; starting at the top is the class, then the attributes and below that, the methods. Lines and arrows connect classes showing relationships; association, aggregation, composition, inheritance, and dependency.
Object diagram: An object diagram is a type of class diagram in that it uses the same components but visualizes a ‘’specific, practical view of the system at a specific point in time. The architecture of an object diagram is like a class diagram with three-tier boxes and relationship arrows between objects.
Package diagram: Packages are logical groups of classes, use cases, and other related components within a system. They serve to visualize the big picture of a complex system with many interconnected parts. In a package diagram, packages are depicted by file folders and the relationships with arrows.
Component diagram: Component diagrams offer a broader vision of the big picture than the package diagram. In a component diagram, components consist of classes, interfaces or collaborations that are grouped by their relationship. The function of the relationship between components is to visualize system implementation.
Composite structure diagram: A composite structure diagram is another subset of the class diagram and visualizes a class's internal blueprint and structure. It goes into the details of how each section of a class relates and communicates with each other.
Deployment diagram: Deployment diagrams visualize how physical artifacts (hardware) and software relate to each other. The relationship lines show how software is deployed via hardware and how each component of the hardware and software work together for deployment.
Behavioral diagrams visualize actions within a system or between actors and systems. These are diagrams about components that aren’t static. With behavioral UML diagrams, you can show how parts of the system move or change according to what affects them,
Use case diagram: In a use case diagram, the UML components include a stick figure as the actor or user. The purpose of a use case diagram is to show the interaction between the actor and the system and how it relates to the rest of the system by triggering actions and states.
Here’s another excellent example of a use case diagram but this time created using Visme’s online whiteboard software.
State diagram: A state diagram shows how a class, object, interface, and other parts of a system change state after interacting with an actor or internal trigger. States are actions like ”Enter Pin” and endless more depending on the system.
Activity diagram: Activity diagrams are UML renditions of a process or workflow for a system, project or business action. Business professionals regularly use activity diagrams to visualize flows for project management, business systems, etc. The UML elements in an activity diagram are squares, ovals, diamonds and connecting lines.
Sequence diagram: A sequence diagram visualizes the chronological sequence of interaction and communication between system parts. Sequence diagrams are generally created in a vertical format, with the sequence flow starting at the top.
Communication diagram: Communication diagrams are like sequence diagrams, but they concentrate solely on the chronological communication between objects, components, interfaces, etc.
Interaction overview diagram: An interaction view diagram is a variation of the activity diagram and covers more of the big picture. The boxes (nodes) visualize the interaction instead of objects, and the arrows show the flow of action. Other diagrams are sometimes included inside an interaction overview diagram.
Timing diagram: In a timing diagram, you can visualize a sequence of events with time dependencies. Instead of arrows and lines visualizing relationships, increments of time are a staircase-style line with arrows that show the time constraint between events.
When it comes to developing content for business and visual communication, Visme is your go-to tool. Here’s what one of our users had to say about Visme.
“Visme saves time and is a whole lot more affordable than most other content development programs out there now. It makes it easy to develop professional, polished content.”
- Kendra Bradley, Graphic Content Developer at WOW!
In the Visme template gallery, you’ll find different types of flowcharts you can use for your UML diagrams and for various purposes. We’ve selected 13 of them to give you the opportunity to start diagramming right now.
This state diagram shows the action process for an ATM. In this case, the states are the card reading, entering the pin and the transaction itself. This state diagram is only one of many in an ATM system. Use this to create a set of state diagrams to visualize the entirety of the system or make this one larger and more robust by adding all possible states.
Customize the colors and fonts in the flowchart easily. Click on one of the shapes and select the border color. Change the color of one shape first. Then click on the option to replace everything in the previous color with the new color.
Visualize a payment process for a discount promotion with this state diagram template. In UML state diagrams, states are squares with rounded corners, and relationships are arrows between states. Other shapes and lines visualize the information input during the payment process.
When creating a UML diagram, take advantage of the rulers and smart guides in the Visme editor. Size the shapes to match each other and snap-align them to each other. Using all the standard UML elements, you can create diagrams that look great.
In this state diagram template, two black circles represent the library management system's beginning and end states. The blue states are on a 4x4 grid that helps keep shapes aligned and in visual flow. Arrows bend at strategic spots to make the composition of the diagram more balanced.
This style is a good option if your UML diagrams can’t have too much color regarding backgrounds, borders, etc. Only one color apart from black and white brings attention to the system flow and doesn’t interfere with understanding.
A state diagram with a beginning and end can be diagrammed in any direction as long as it is easy to follow and understand. In this case, the process flows in a clockwork direction to end close to where it began,
The magic of UML diagrams is that you have some freedom as to how the states are laid out on the canvas. The level of creativity in your UML diagrams depends on your company’s brand guidelines and content requirements.
Display an overview of all the interactions within a system. This diagram shows when a user tries to shop for something in an e-commerce store. Arrows indicate the main interaction flow that ends with a purchase. Meanwhile, the arrows also show when something doesn’t go as expected, and the process returns to the beginning.
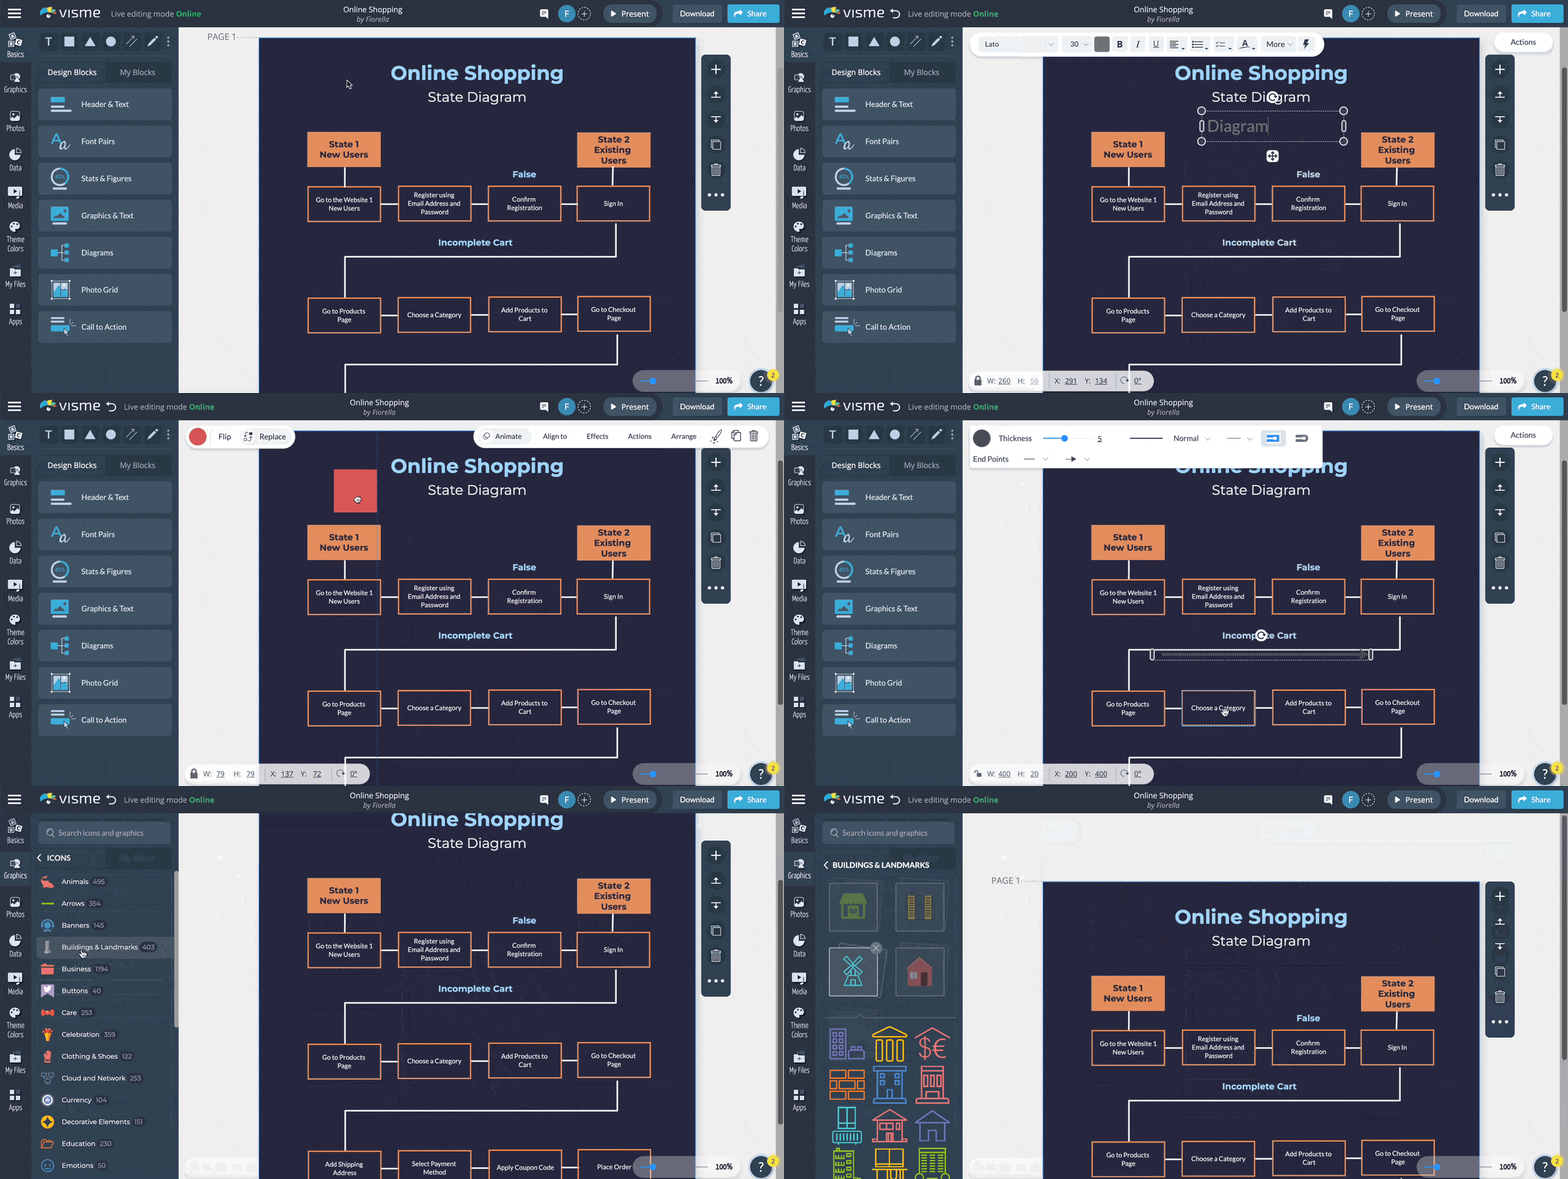
When adding and creating lines, you have customization options like color, thickness and arrowhead. If using the diagram maker, lines move along with the connected shapes as you adjust the design. Change the connecting position by clicking and dragging to another on the same shape or another.
Use this UML diagram template to visualize the data flow in a hospital system. Beginning and end states are visually depicted in cornered rectangles, while the states inside the process have rounded squares. The blue colors are calm and non-competitive with the UML components.
If you want to add the diagram to another project, save the entirety of the project as a content block. Click on the top left outside the canvas and drag to the bottom right to select every element before using the content block features. Save and give it a name. You can access it from a document or any other working project and add it in.
The orange rectangles in this UML activity diagram represent actors, while the dark elements represent tasks that need to be performed. Arrows show who should do what and if any involved parties share a task.
To change the colors and fonts in the diagram template to match brand guidelines, use the Brand Kit. Change the colors and fonts in the template easily with a quick one-time setup.
Visualize a constant, nonstop process with this state diagram template. The starting state is when an actor opens the elevator door, taking the person to the floor, from where other things can happen. Someone might call the elevator, and that’s included as a diamond shape with a question. A checkmark and an X signify yes or no, and the process continues as a cycle.
The simplicity of this template makes it easy to customize however you want. Add more nodes and connections for processes with more states and actions. Compile all the company’s state diagrams into folders inside Visme. Keep all visual content organized by teams with workspaces and media libraries.
Create a digital visual rendition of how your product is meant to work at a high level. You can see on this diagram that the states are generalizations that include many steps inside them. In this state diagram, we visualize the steps a user takes to interact with a microwave to heat up food, but there are no details for all the other buttons they could potentially press or if the microwave doesn’t turn on.
Use lighthearted colors and line icons to tell an easy story of how a microwave works. Try this state diagram as a teaching tool or to explain how any other machine works. Practice critical thinking by creating UML state diagrams of your business processes.
Use UML diagrams as teaching material to develop critical thinking skills. Explain any system using a state diagram and then ask learners to create state diagrams for any system they can think of. Share guidelines like how beginning and end states are always marked by a black dot or a shape that’s different from the rest.
Include this diagram in a digital publication and animate the icon at the top of the page. Add interactivity and motion to your UML diagrams with Visme’s animation features. Use this diagram to visualize an e-learning material that’s dynamic, engaging and memorable.
This simple input-output process state diagram shows the processes behind search engines and digital libraries. Use it to help coworkers search through the company’s database. Use it to help non-developers understand what the code will do after the software or digital application is completed.
Gradient backgrounds are a great option if you’re looking for a way to design state diagrams that stand out. For example, if you want to include state diagrams in articles, blogs and training manuals, you must make them look interesting and attractive.
What are the steps in the process of an online shopping experience? This state diagram uses a contrasting color palette to visualize two possible user states and how they progress through the sales flow. The zig-zag pattern permits all the nodes to fit into a square-sized canvas.
To start a new diagram inside any project, use the / shortcut and scroll to the diagram icon and click or write ‘diagram’ in the search bar. Use this shortcut feature to find anything you want inside the editor quickly.

Quickly visualize what your system does when the user inputs the password right or wrong. In few nodes/shapes show exactly what happens for each instance. This template can start a much longer state diagram showing more system states like ‘Clicks on the navigation button,’ ‘reads an article,’ ‘opens the shop page,’ and endless more states that a system could have.
Try creating UML diagrams in Visme. You’ll have no limits to how large the state diagram can be; just don’t go overboard. Try activity diagrams and interaction overview diagrams on the whiteboard too.
Create comprehensive use case diagrams with Visme’s infinite whiteboard. Add a legend on the left for easier reading of the use case diagram on the right. Use the infinite whiteboard feature to grow the project in any direction. Brainstorm any changes in real time on the whiteboard.
Imagine this scenario. You create a use case diagram in which you label actors as ‘users.’ There are five different user states/types. Your team leader says you need to change the word ‘users’ to ‘subscribers.’Use the Visme find and replace feature to change them all simultaneously.
So, what are UML diagrams? They are visual renditions of system processes, interactions, states and more.
There are 13 types organized into two groups; structural and behavioral. Activity diagrams are the most versatile regarding using UML for a business process that is non-software related.
Did you know diagramming with Visme is easy using the integrated flowchart and diagram tool? Apart from the wide variety of pre-designed templates, you can also access short, pre-built diagram sections plus a full-scale diagram builder with all the shapes, lines and arrows you need for creating any type of UML diagram.
Every shape in the diagram maker has connector points where you click and trigger a dropdown with line and arrow choices. You can make lines thicker, change the font inside shapes, customize the colors, add or remove lines and nodes, disconnect and connect somewhere else, and choose arrows or straight lines.
Try the Visme UML diagram maker by opening your Visme account or creating a new one. Team and enterprise accounts have workspaces where you can create and organize teams to create UML diagrams and all the content you need for effective communication.
Design visual brand experiences for your business whether you are a seasoned designer or a total novice.
Try Visme for free