Florida Panthers
How the Florida Panthers Maximize Their Workflow & Win New Clients Using Visme.
Turn research and processes into infographics your audience actually reads.

 4.5
4.5
 4.5
4.5
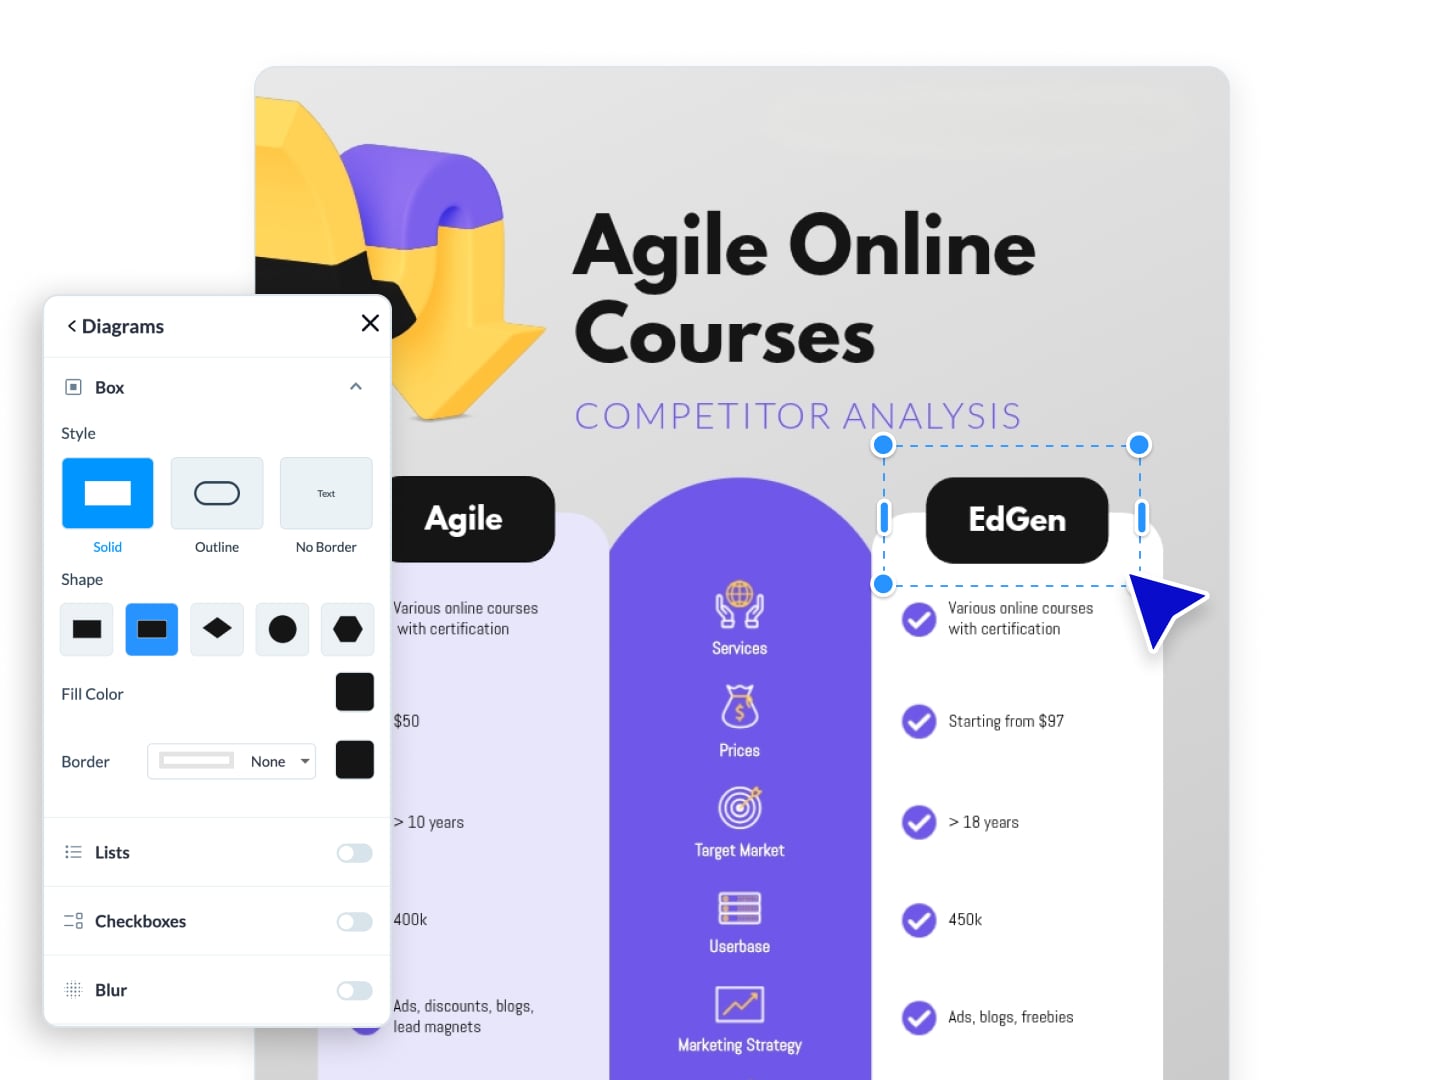
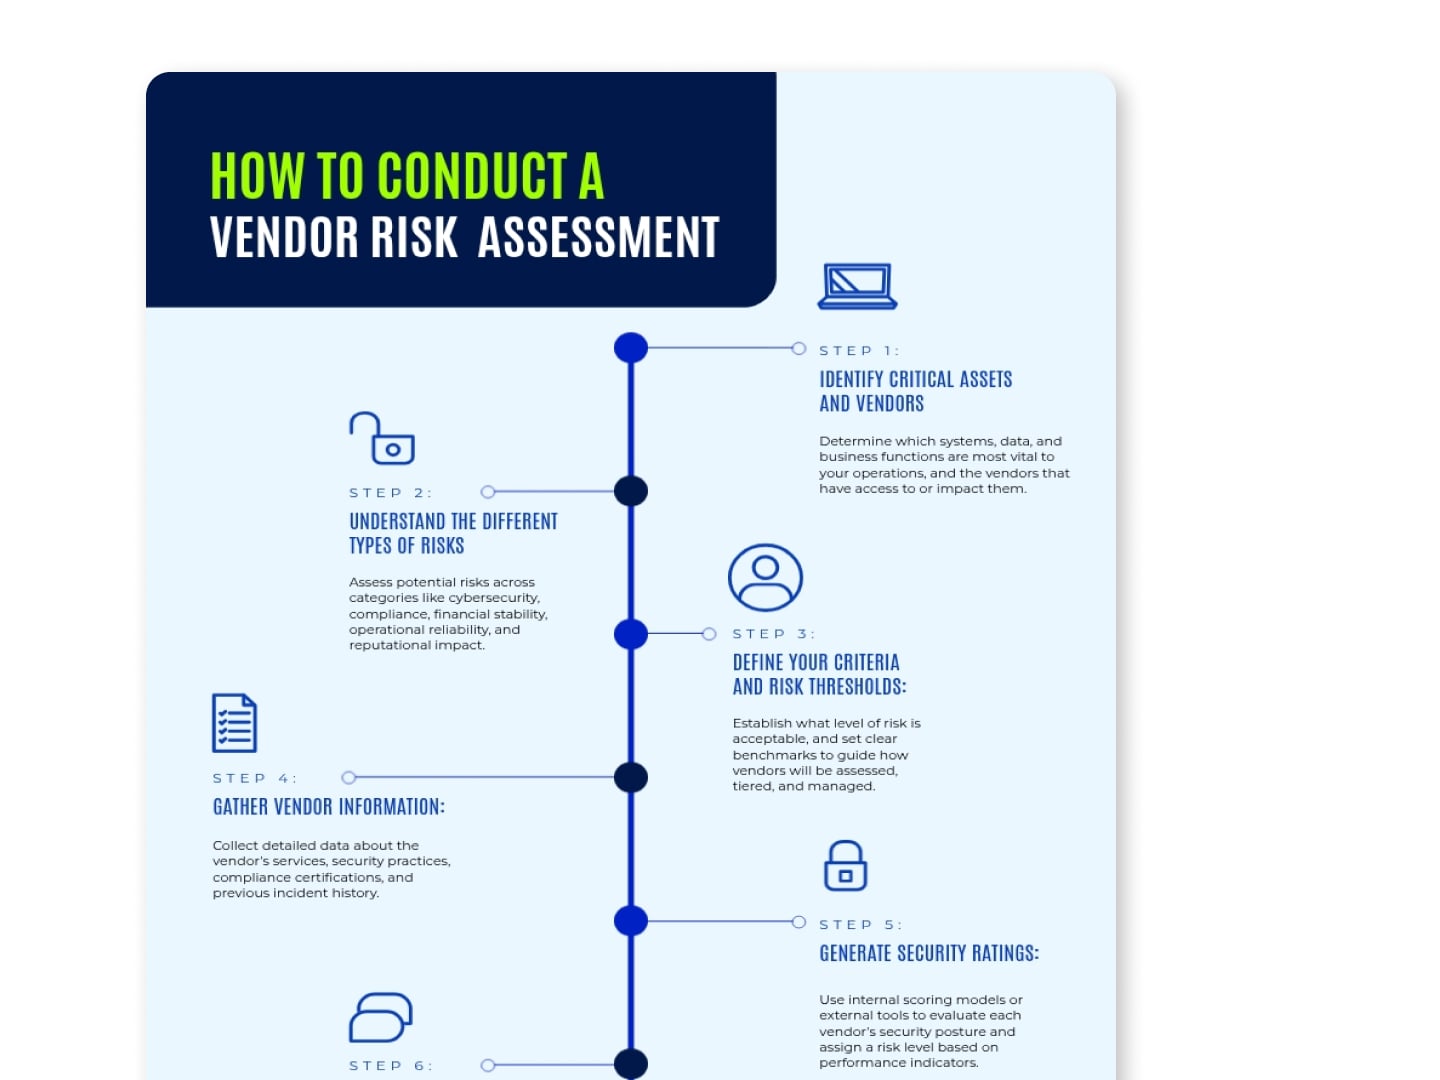
Choose from statistical, timeline, process and comparison layouts designed to fit your industry and specific needs. Pick your structure and make it yours in minutes.
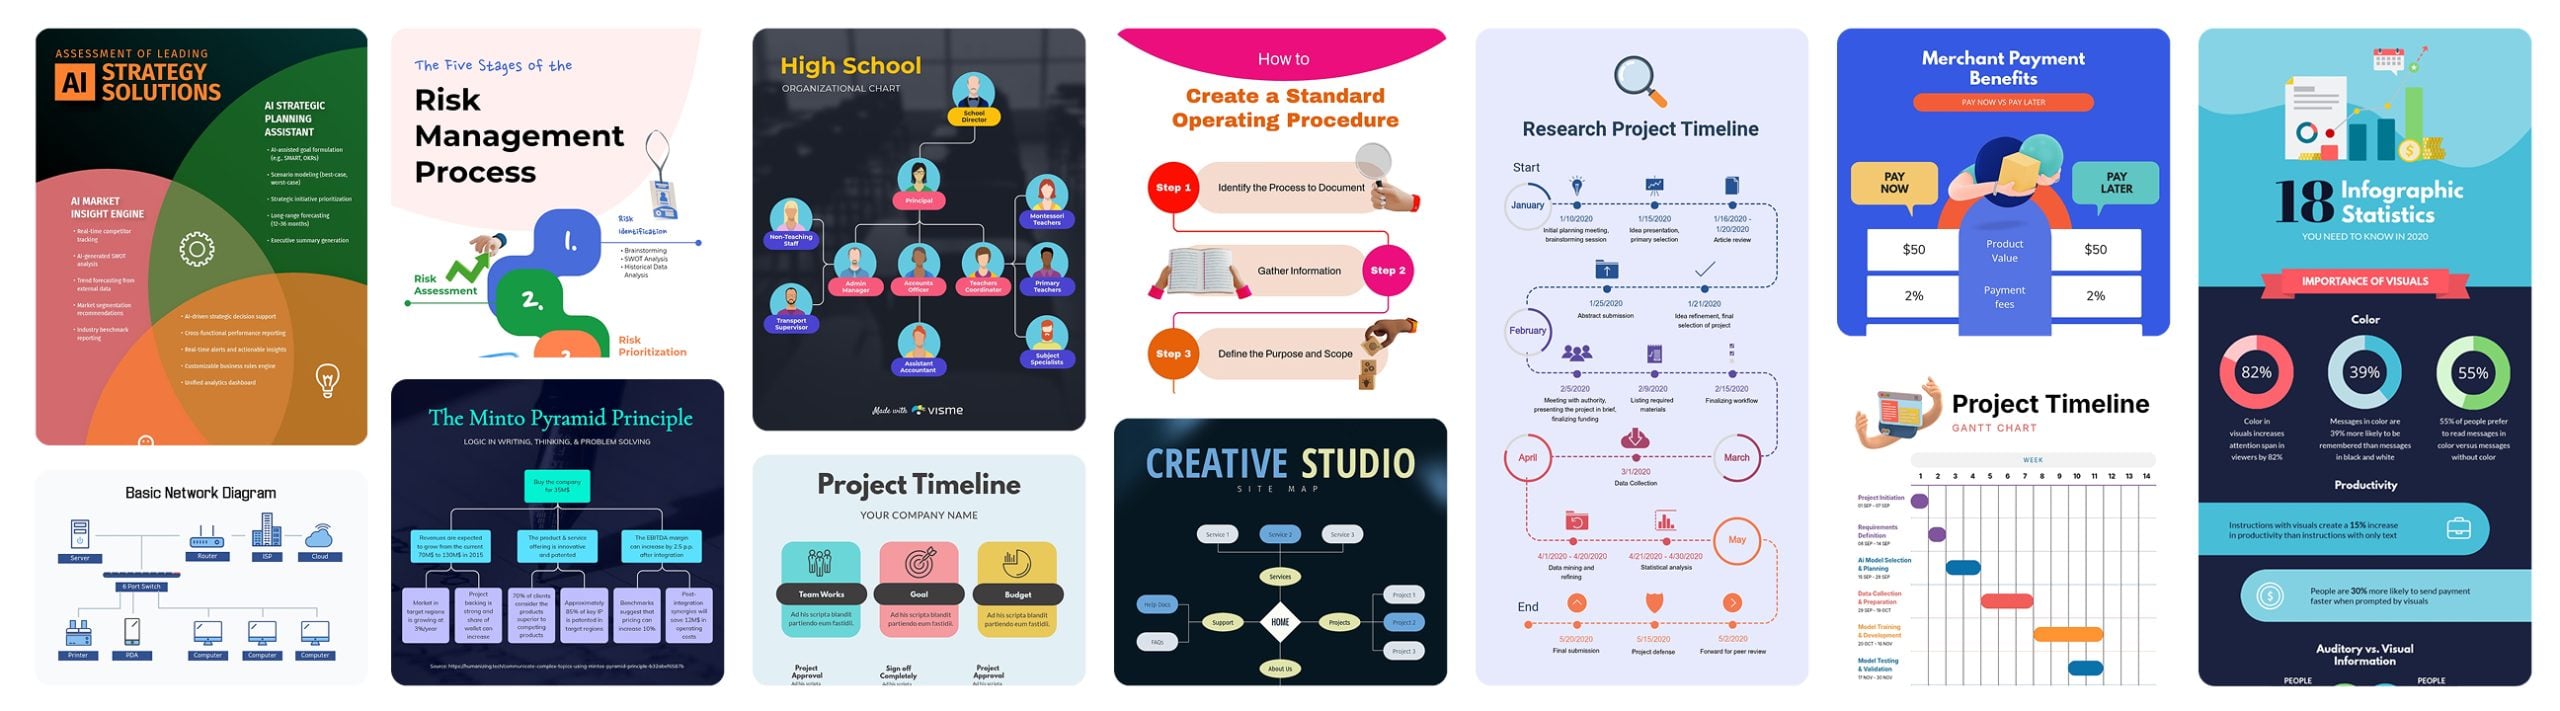
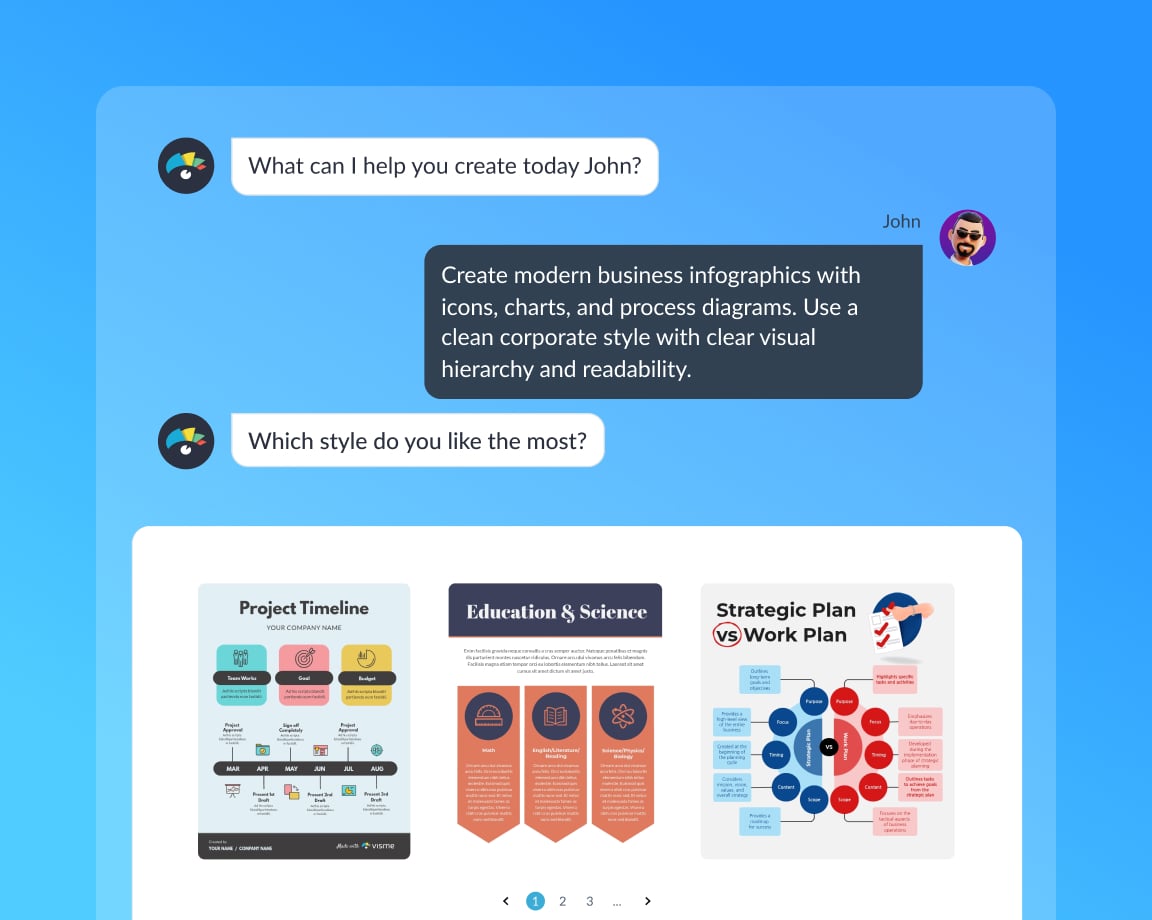
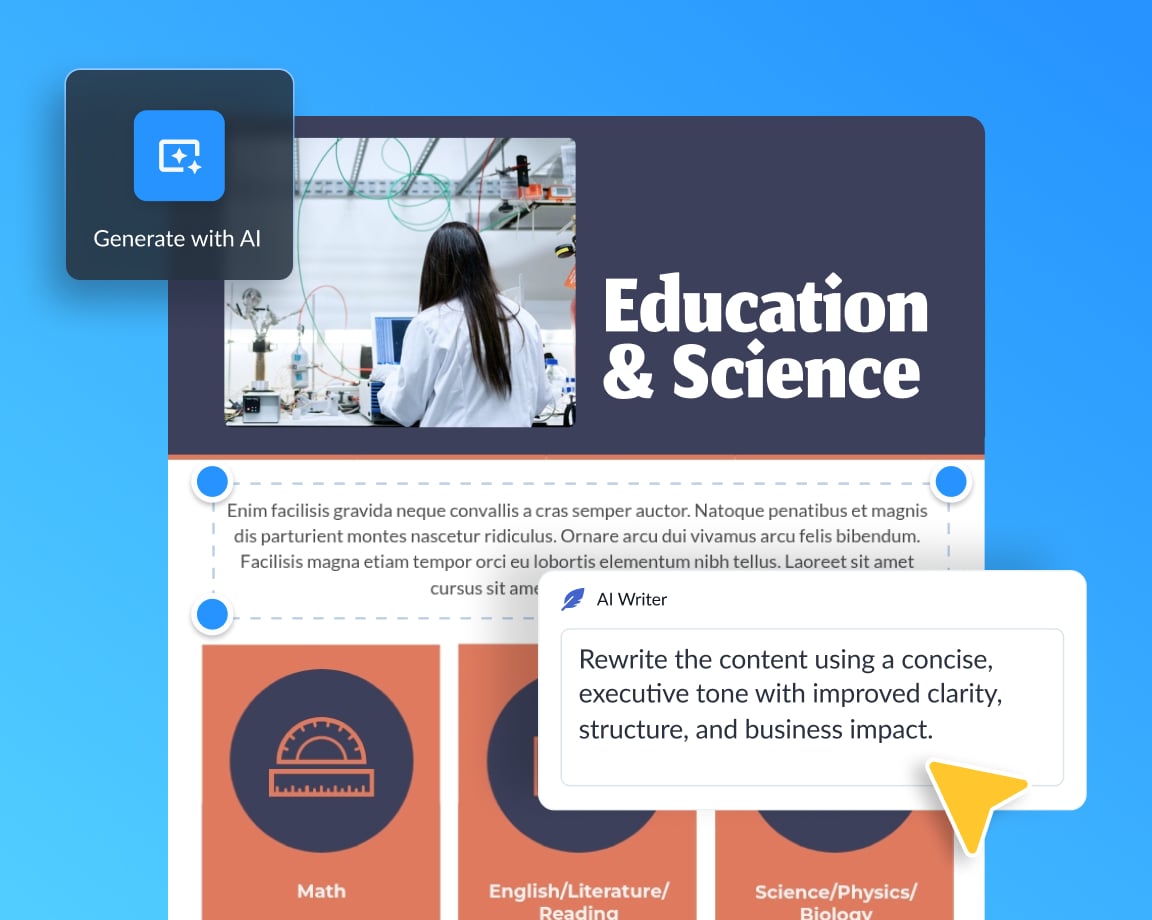
Visme AI Designer turns a text prompt into ready-to-use designs to create custom visuals for your infographics, while AI writer tools help you write and edit copy, along with other AI features.
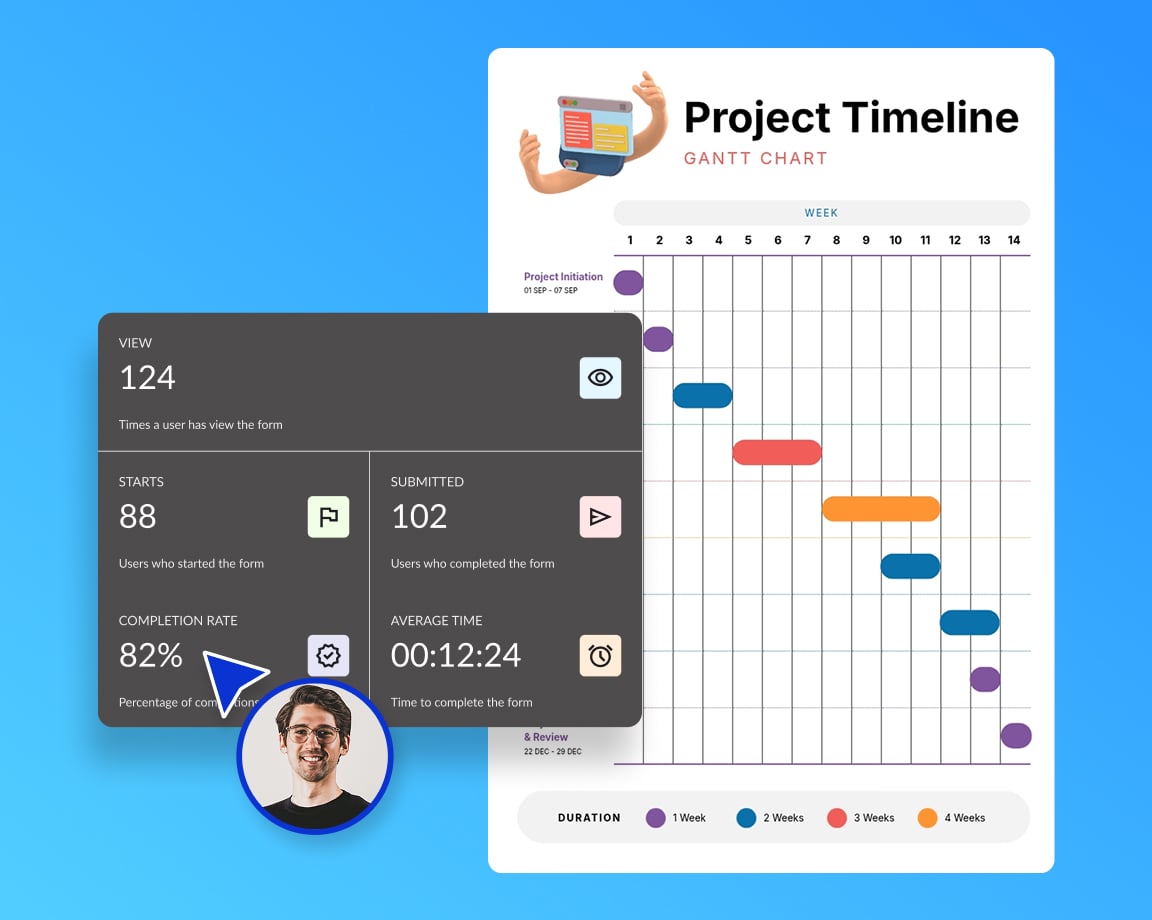
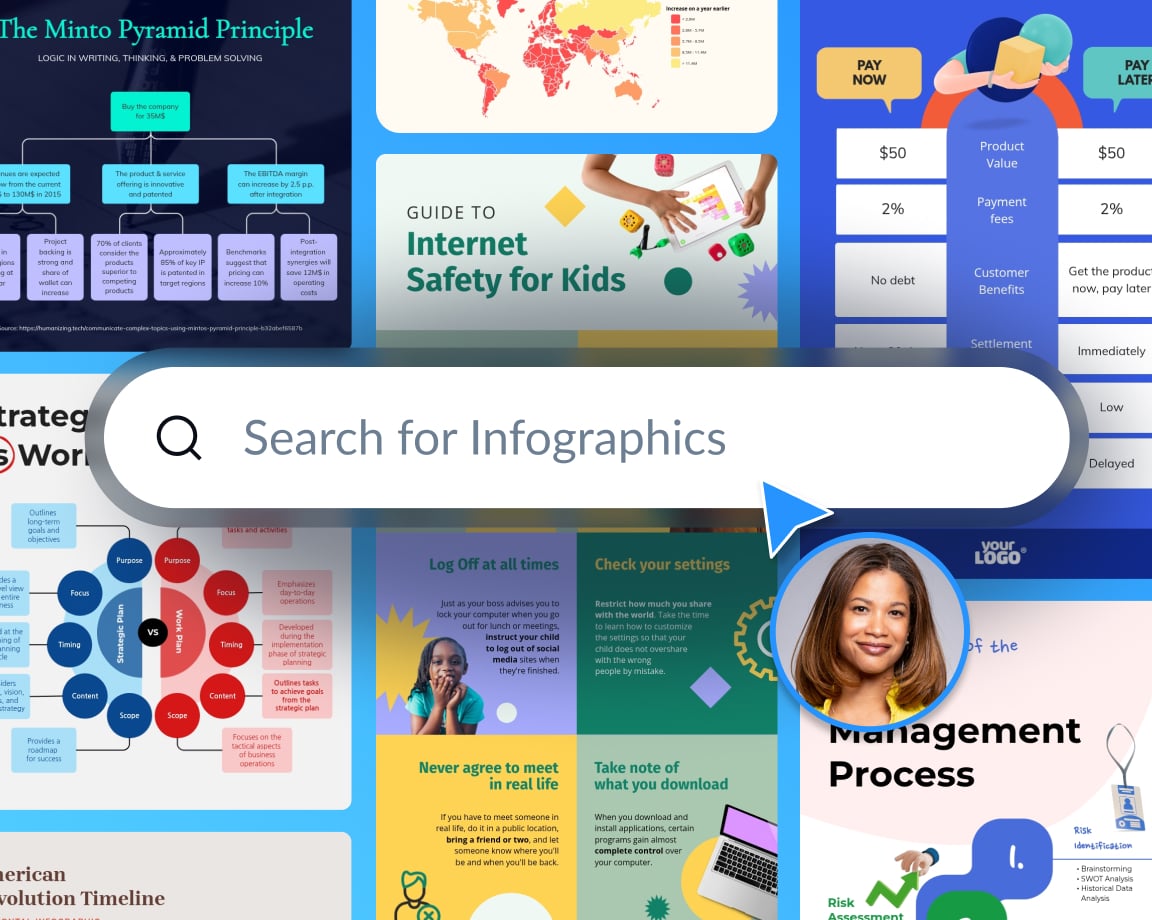
Templates, data visualization, interactivity and brand control, side by side. See why teams switch.
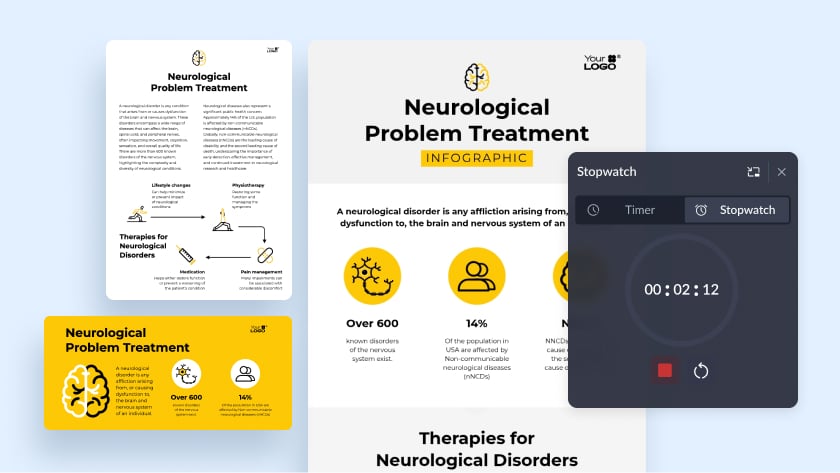
Produce campaign visuals, media kits and reports in record-breaking time.
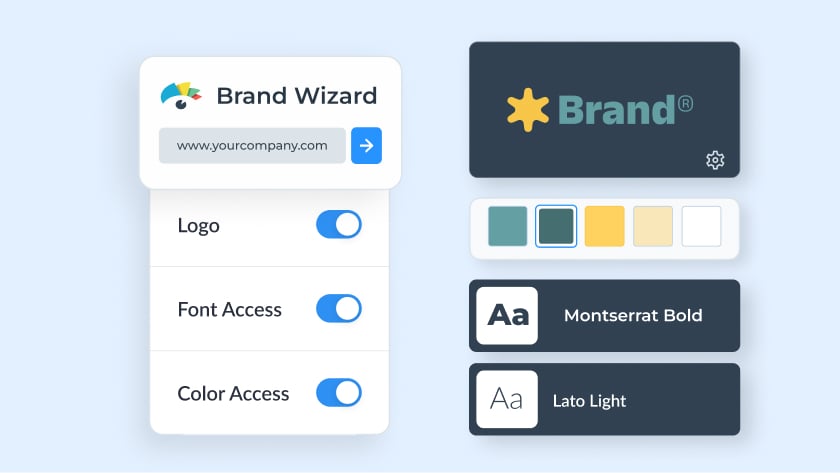
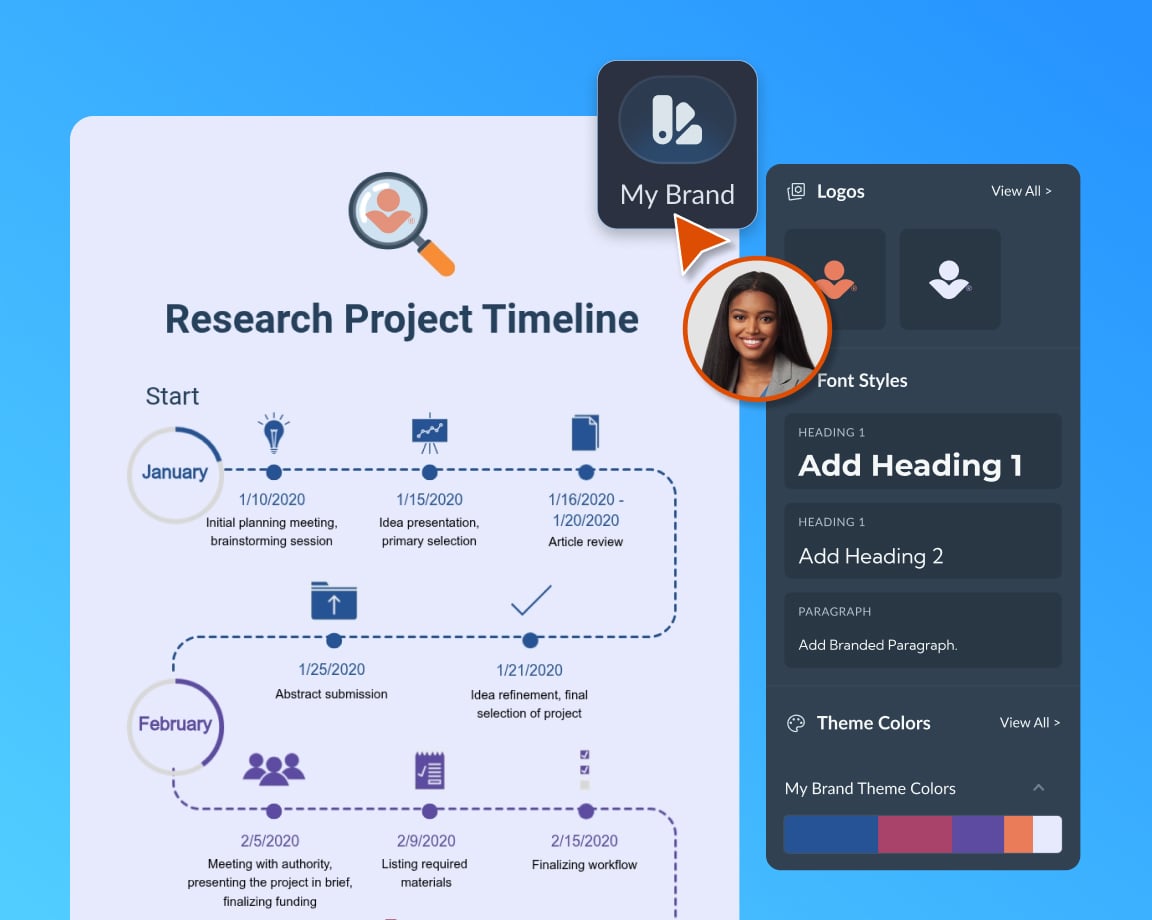
Keep every deliverable on brand with AI templates tied to your team's identity.
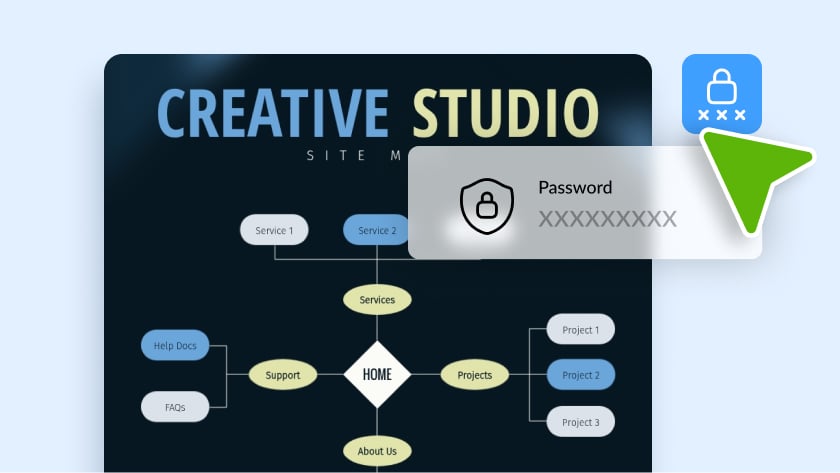
Enable privacy controls, including password protection and encryption, while scaling design output across departments.
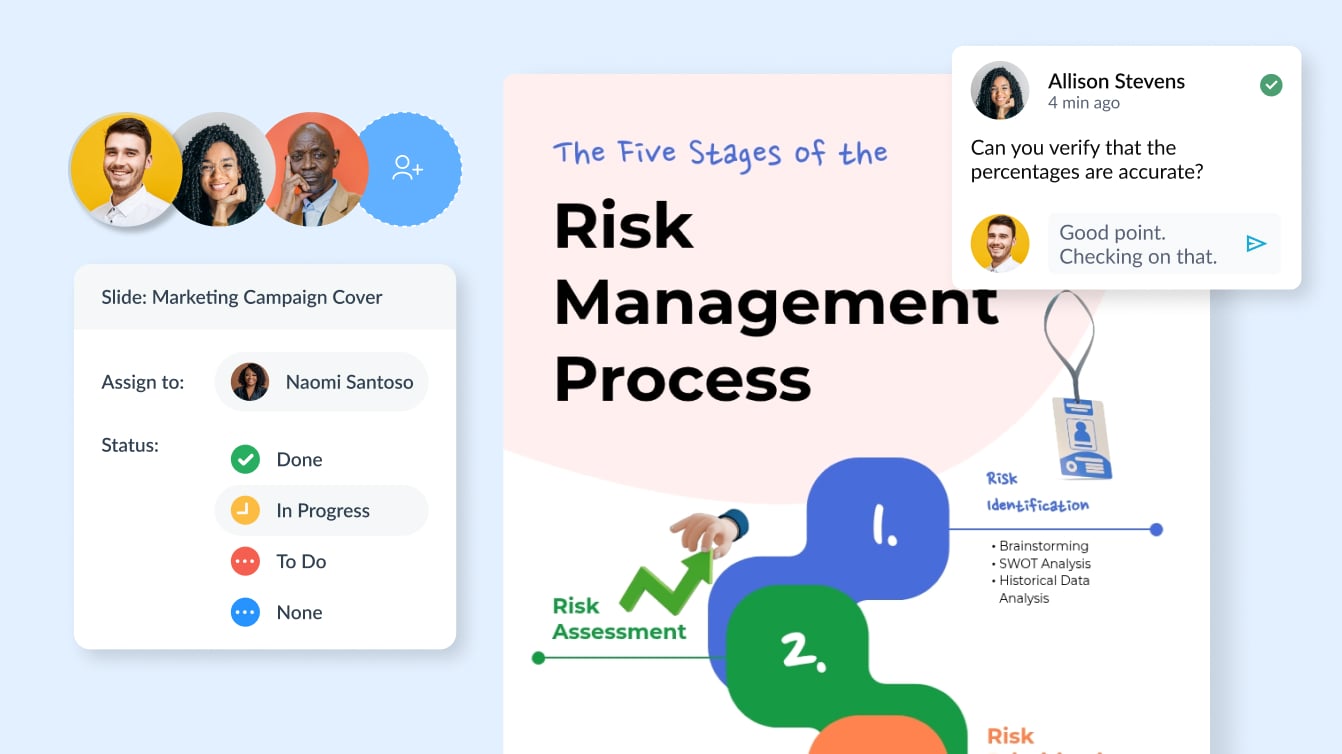
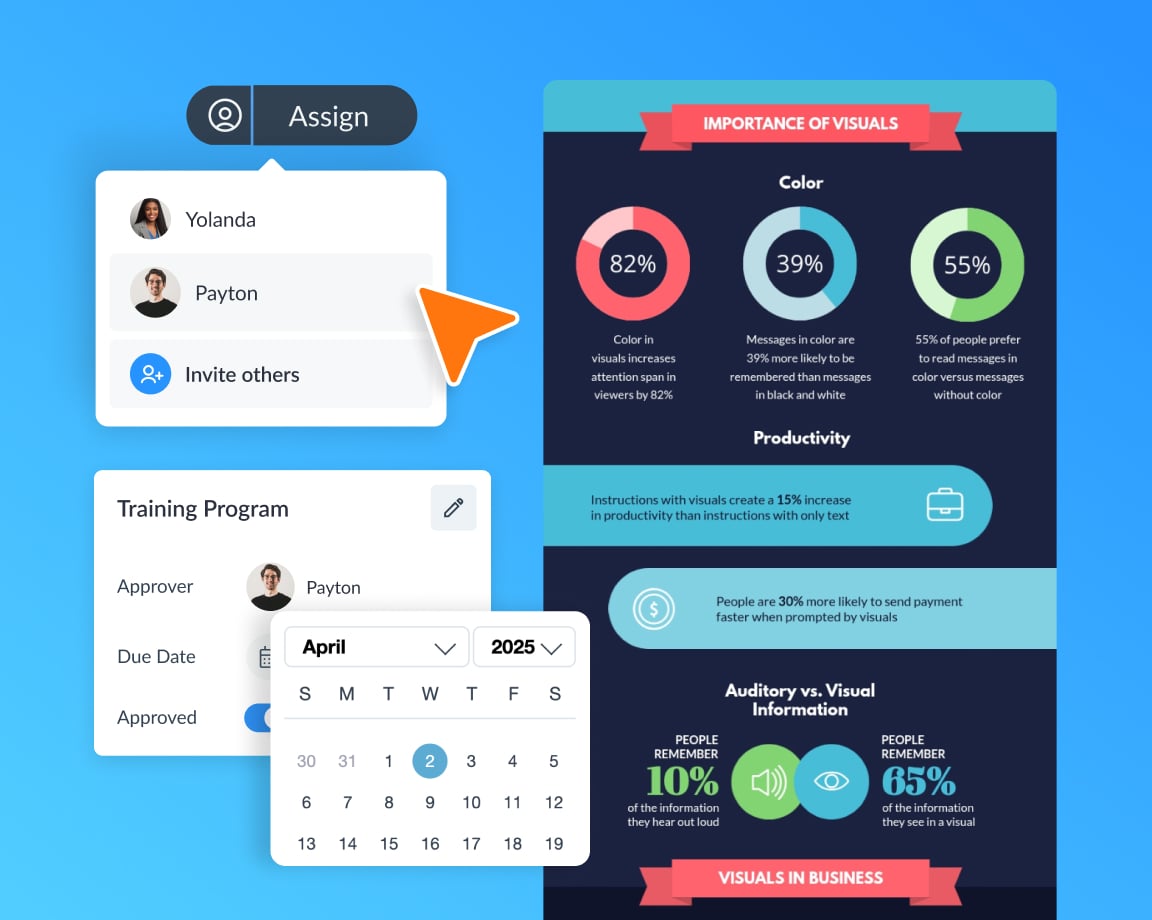
Improve synergy across departments with all the controls you need to ensure consistency, communication and visibility.
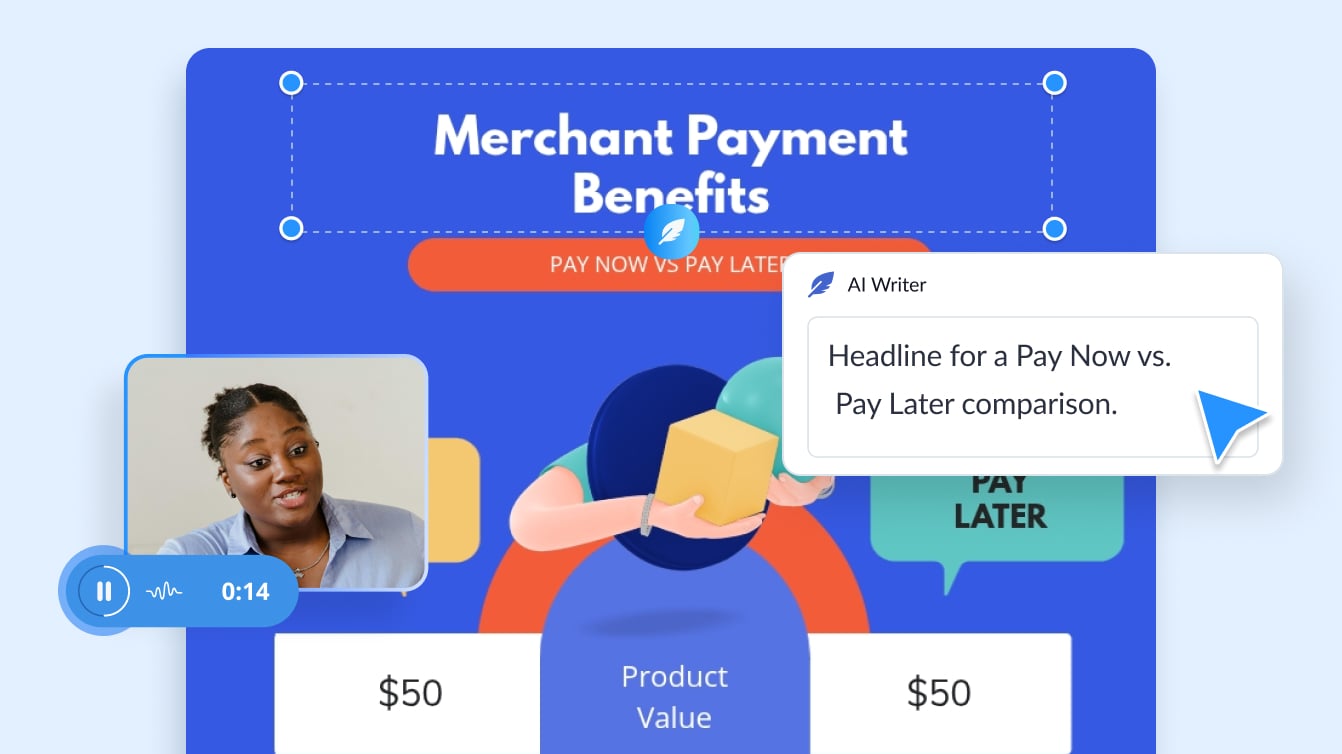
Create winning content for all your print and digital needs, including proposals, reports, social media posts, videos, signage, internal infographics and more.
Go from raw information to a share-ready infographic in four steps, without staring at a blank canvas.
Learn more about the various infographic types available in Visme and find the right one for your project below.
Start with a professionally designed template and customize it with drag and drop. Every layout, chart placement and color scheme is already handled, so you're editing a finished design rather than building one. Browse infographic templates to find your starting point.
Visme offers infographic templates across every major format: statistical, timeline, process, comparison, informational, geographic and list-based layouts, plus industry-specific designs for marketing, HR, education, healthcare and more. Explore the full infographic template library.
Yes. Visme's free plan lets you create infographics with templates and the full editor and share them online. Premium templates, your Brand Kit and additional download formats are available on paid plans. Compare options on the pricing page.
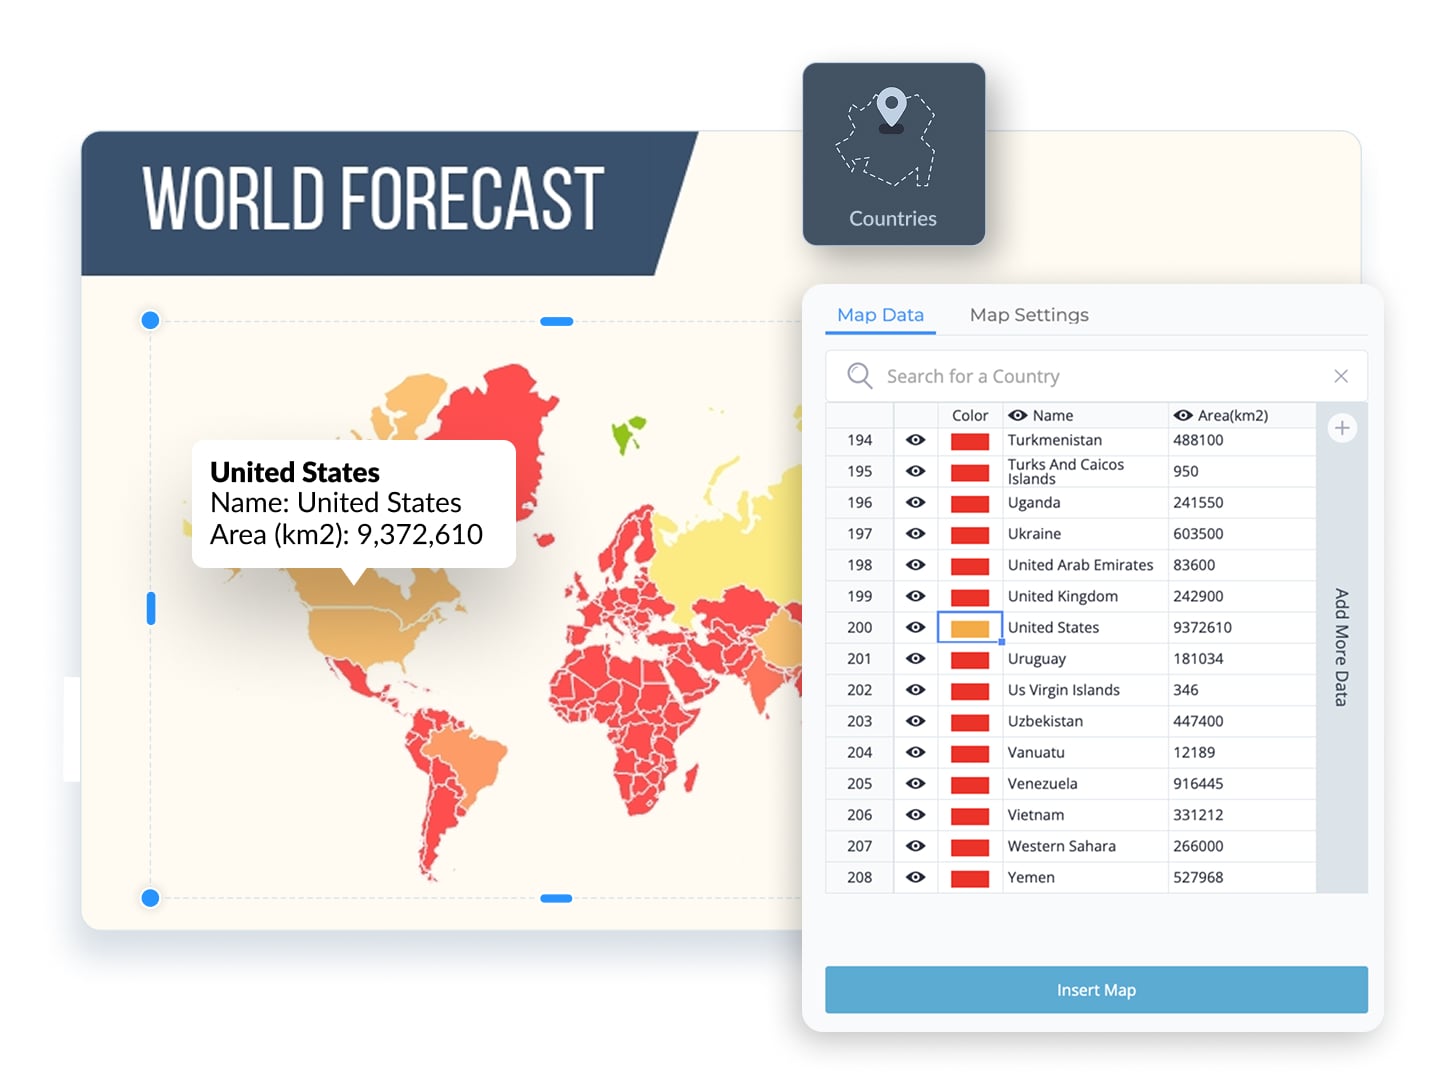
Yes to both. Every element in a template is editable: text, colors, fonts, icons, images and layout. For data, add any of 50+ charts, graphs and widgets, then enter values manually or import them from Google Sheets or Excel so your visuals update with your numbers. Learn more about data visualization tools.
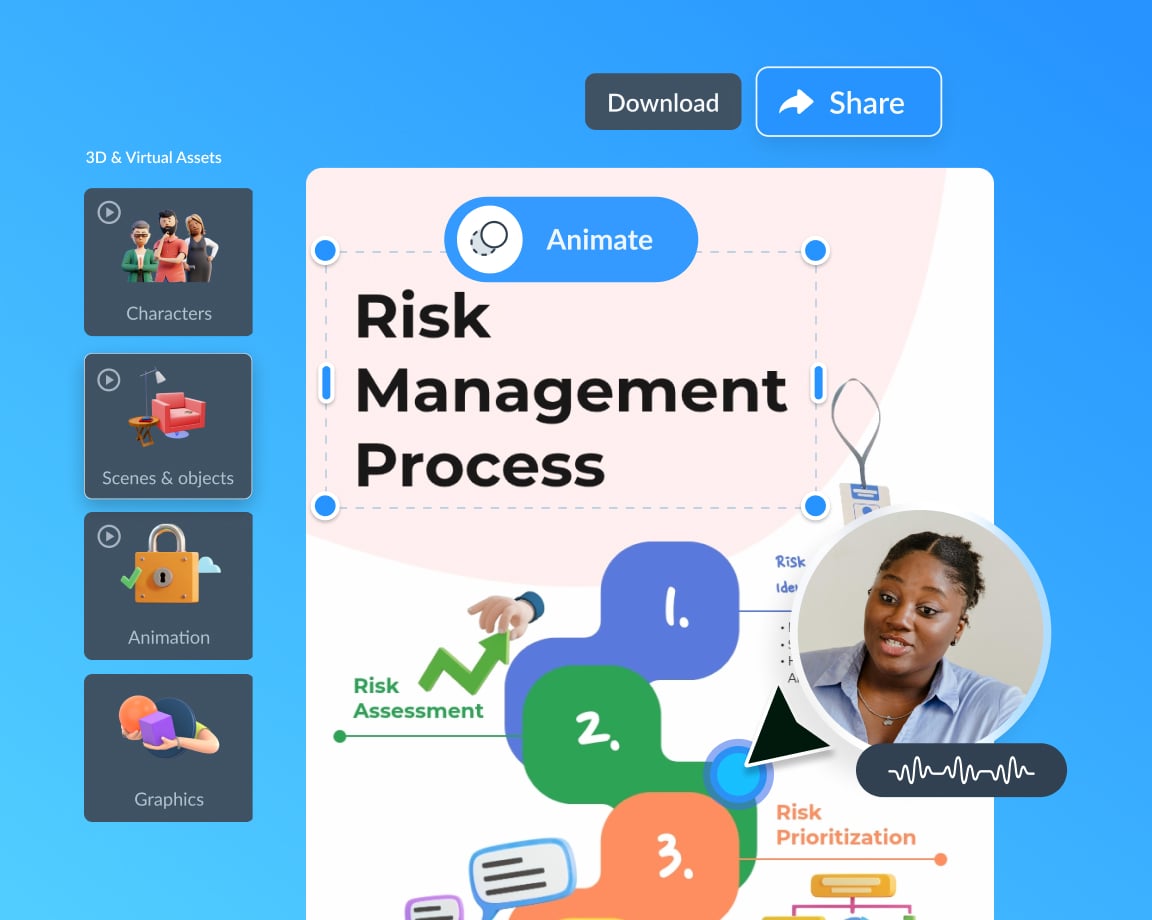
Download your infographic as a high-resolution PNG, JPG or PDF, share it with a live link anyone can open in a browser, or embed the interactive version on your website with HTML code. Interactive elements like animation and links are preserved in the live and embedded versions.
Visme is the best infographic maker for teams that need data visualization, brand control and interactivity in one tool. Where most infographic makers stop at static graphics, Visme adds 50+ chart types, live data imports, animation and team collaboration. See detailed side-by-side breakdowns on our comparison page.
The standard size for a web infographic is 800 pixels wide by around 2,000 pixels tall, which fits most blogs and social feeds. Visme templates come preset at optimal dimensions, and you can set custom dimensions for print, social or presentation formats.
Yes. Add as many pages as you need to a single project in the editor, then download the whole set as a multi-page PDF or share it as one continuous live link.
You can upload your own images, graphics, fonts and brand assets and use them to rebuild your existing design inside Visme, though third-party template files can't be imported as editable projects directly. Most teams recreate their layout once, save it as a custom template and reuse it from there.