


Typography Infographics: 12 Inspiring Examples & Techniques

What are the most important elements in design for infographics? If you’re not a designer, creating jaw-dropping infographics may not come naturally.
As more brands and their marketing teams create and share quality infographics online, it’s not enough to just slap a few facts together and call it an infographic.
Instead, it's becoming more and more important to master the art of infographic design. To stand out from the crowd, your brand's infographics must be both informative and beautifully designed. But don't worry.
Gaining mastery in the art of design for infographics is not impossible. All you need is the right information. That’s why we’ve put together the essential design principles you need to know for infographic mastery.
Our guide dives into each of the elements you need to master to design for infographics professionally.
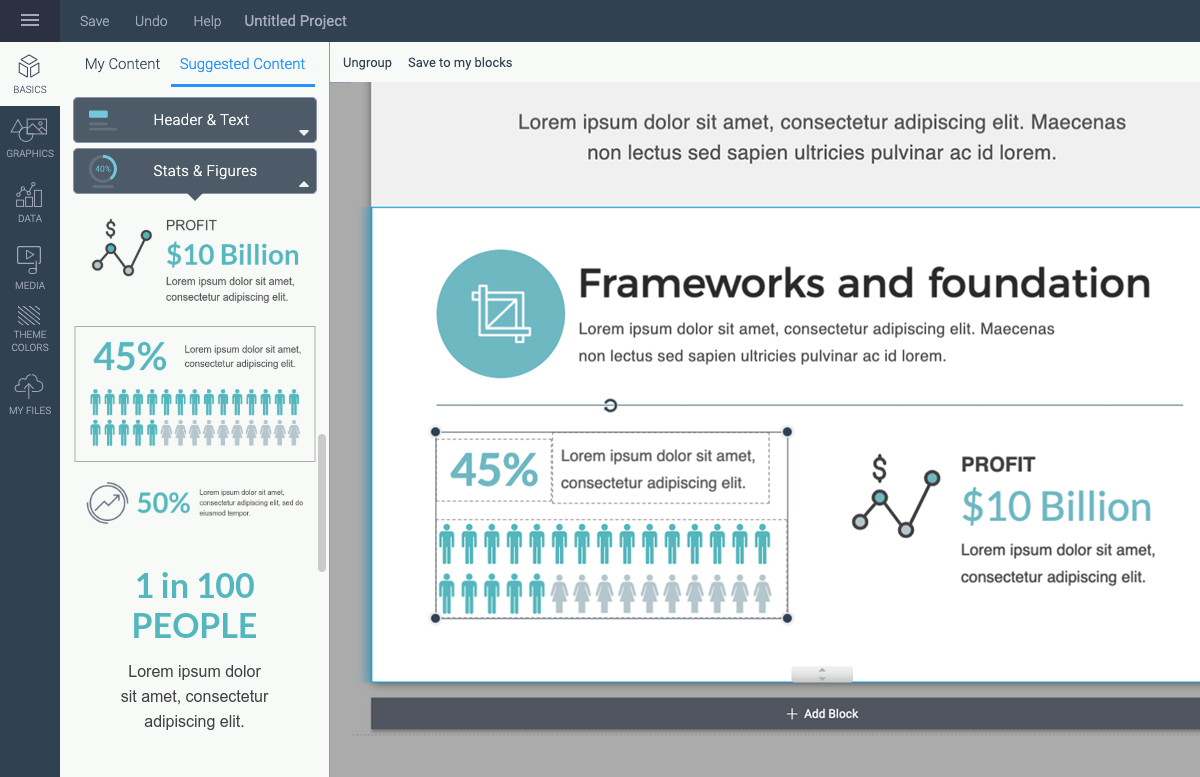
No need to worry if you're not great at design—I'll show you how to customize designs with Visme's infographic maker and easy-to-edit infographic templates.
Before you get started, watch this video to discover the art of designing effective infographics for your business.
The laws of hierarchy in the design space are a large factor in how layouts look, flow and feel for the viewer. Hierarchy is extremely important for an infographic, especially since there is so much information to relay in a small space.
The word hierarchy literally means “a visual system where things are organized in order of importance.” In design terms, that applies to every single visual thing set on a layout.
For example, the title of the infographic always sits at the top of the design in the largest letters. Easy to see, read and grasp at first sight. It’s the same in a newspaper or magazine layout. The title is the most important text.
Implement a hierarchy for your infographic by creating a visual outline before designing.
Analyze the content and identify the sections important enough to turn into subheadings. Simplify your text by turning it into a visual.
Here’s a quick look at how the hierarchy works in an infographic layout.

Apart from the basic layout of titles and subheadings, the laws of hierarchy cover other aspects like size, proximity and distance. Dig deeper into the rules of hierarchy and read our guide on visual hierarchy in the Visme Learning Center.
Apply these rules to your designs and make your infographics stand out above the rest.
It’s easy to find a relationship between design and psychology. After all, viewers will look at a design and feel either attracted to or repelled by it.
A lot of that has to do with how a designer uses the Gestalt principles.
These principles are derived from Gestalt Psychology, which dictates that the human brain perceives objects differently when seen in groups than when seen on their own.
A composition arranged at random will not have nearly the same visual effect as a design that follows the Gestalt design principles.
The principles of Gestalt psychology which affect composition and design are:

In order to choose the right color for your infographic, you need to take a moment and consider the message and the viewer.
Color psychology in marketing is not a myth, and every color choice you make will have an effect on how your infographic is perceived. As Tom May says,
The color combination you apply to your infographic must be a proven color harmony. A color harmony is a color scheme which follows the rules of the color wheel.
Follow these rules to make sure the colors in your infographic make sense with each other. There is nothing less attractive than a terrible color combination, and the right colors can help you find the perfect infographic design inspiration.
The color harmonies are as follows:

Start Designing NowCreate and apply custom color schemes.
Find more in-depth explanations of color harmonies and color psychology in marketing in our ultimate guide. The visuals in that article are some of our viewer favorites, proof that color harmonies create positive effects on the viewers.
Visme has lots of options for color adjustment. There are a number of preselected color themes to choose from in the tools panel.
Similarly, in the color picker, you have the choice of many more color palettes. You can even create your own color palettes to use for each visual you create for your brand or campaign.

Surely you’ve heard about the rule of not using more than three different fonts in any design. We couldn’t reinforce this design principle enough.
As designers, we know how easy it is to go overboard with fonts. We have so many to choose from that we always want to go for something new and interesting.
While there’s nothing wrong with new and interesting, you need to make sure that you pair it with something familiar and relatable.
Font pairing is reminiscent of how we match our clothes together or the curtains to the wallpaper. They need to work together as a whole and not compete with each other. One is usually the stronger contender, taking the other as a companion or complement.
Yes, there is also psychology intertwined with typography, that is why it’s so important.
Never underestimate the power of a font. Along with the colors, the letters are the first thing a viewer sees when they find your infographic.
If you use a unique novelty font, it needs to make sense with your message and the rest of your visuals. It also needs to be readable, so stay away from graffiti and decorative fonts.
If you’re into fonts and want to know more, you should check out our guide about the anatomy of typography. Did you know that letters have arms and legs?
The rules of font pairing are so important that we even made a video about it for our Make Information Beautiful series. Take a look:
Consider all the bits and pieces inside an infographic – the text, icons, illustrations, data widgets and shapes. All these elements together are colored, sized and placed in a shared space. They need to have a visual unity with each other.

To achieve visual unity, first take into account the sizing of the elements.
Set the icons at the same size, apply the same point size to each of the headers and use the same line spacing for the text blocks.
Then you need to be aware of your colors.
Give all the icons the same color or apply a flowing gradient from one icon to the next. Do not give the icons all different colors as if they were magnets on a refrigerator door.
Give all the headings the same color, as well as the text blocks. Use similar transparencies and intensities for shapes and backgrounds.
Finally, focus on your data widget. The easiest element to get wrong when it comes to visual unity is the data widget. Follow these steps to get it right:

Use a grid to make sure every element in your infographic is aligned and spaced properly. Keep an even margin surrounding the entirety of the content like a bounding box. Make sure the space between repeated elements is the same throughout.
For example, the space between a heading and a subheading or an icon and its text. Also, the left and right margins should be equal to each other, as well as the top and bottom. Icons and data widgets need space around them to be noticeable and distinct.
Visme templates and ready-to-use content blocks were created with a grid. Use these design for infographic tools to keep the alignment, margins and spacings in check.
When your content forces the set spacing and alignment in the blocks to change, use the grid view option in the design dashboard to help you out.
A well-designed infographic must look appealing at first sight. A viewer might see only the title and then have to scroll to see the rest, or they’ll see it at full size on Pinterest.
In order for your audience to scroll through it, click on it or even share it, the infographic must have an attractive visual balance.
To achieve a positive visual balance, it’s imperative to take into account all of the different principles mentioned above. Visual balance isn’t exactly a principle in itself, but more like an embodiment of all the principles together.
It's about spatial awareness between elements, smooth hierarchy flow, attractiveness of the colors, easy-to-read fonts and well-selected icons or illustrations.
Last but not least in our design for infographic mastery round-up, are the focal points and overall flow of the infographic. A focal point is a visually attractive section in the design which calls attention to the viewer. Focal points follow the flow of the hierarchy.
As Mads Soegaard says,
You can follow the rules of hierarchy in terms of location and size, but it won’t flow properly if there are no focal points.
For example, the title is placed at the top with a large text following the rules of hierarchy. But the color is less notorious than the icons in the content below. The viewer will be instantly pulled to look at the icons instead of the title.

Make sure that the important sections in the hierarchy are also focal points. They need to take the viewer along a journey like they’re following a path. The focal points are the narrators of your story. Use them to round it all up.
When designing an infographic, you have to keep in mind that some people are color blind. It’s not difficult to make your infographic appealing to color-blind users.
Simply remember these tips:
Accessibility is not exactly a design element or principle. Instead, it’s more like common sense. By incorporating accessible design into your infographics, you expand your user base.
What accessibility entails is just a few adjustments here and there to make your infographic “readable” or “viewable” by users who are vision impaired.
Users who are almost blind or legally blind browse the internet with the help of a screen reader. This system translates what is on the screen into voice or braille.

Your infographic is an image, so make sure you add a well-written alt text when adding it to a website or social media. The screen reader will read the alt text letting the user know that your infographic is there and it exists.
If there is no alt text, the screen reader will ignore the infographic completely.
Also, remember that the text before the infographic needs to be a short introduction to the infographic itself and what’s in it. For example, “Check out the infographic below where we visualize how to apply the basic elements of design to your own designs.”
Try to also include what type of infographic you're sharing. For example, if the infographic has maps, explicitly say so in the description.
Thankfully, as Jesse Hausler says,
Learning about design for infographics is great, but you can learn a lot more by putting this knowledge to practice. If you're intimidated by a blank canvas, Visme offers thousands of free infographic templates to get you started.
All you need to do is pick an infographics template that works with your data, replace the content with your own and do some design tweaks here and there to create your perfect visual.
You can sign up for a free account here or check out more infographic design trends, resources and tutorials on our blog.
Here are some handpicked articles to help you learn more about design for infographics:
Did you find this article helpful? What part of design for infographics do you struggle with most? Let us know your questions and feedback in the comments section!
Design visual brand experiences for your business whether you are a seasoned designer or a total novice.
Try Visme for free


![How to Make an Interactive Infographic [+Templates]](https://visme.co/blog/wp-content/uploads/2023/11/How-to-Make-an-Interactive-Infographic-Quick-Guide-8-Customizable-Templates-Thumbnail.jpg)


