Healthcare Data Visualization: How to Turn Data into Impactful Stories

A Gantt chart is a visual project management tool that helps teams to organize and plan out major projects. There are many different types of project management systems out there, with the Gantt chart just being one of them.
If you’re looking for a new way to manage your team’s projects, Gantt charts might be an awesome option.
Throughout this article, we’re going to take a deeper look at what a Gantt chart is, how you can create one, plus 15 templates you can customize to fit your own project.
Let’s get started.
A Gantt chart is a project management chart that uses visual aspects of a horizontal bar chart to represent pieces of a project, their timeline and their deadlines.
The left side of the Gantt chart displays all of the tasks, while the right side showcases the timeline for each. Take a look at this example below to get an idea of what this can look like:
Essentially, a Gantt chart helps visualize exactly what tasks need to be completed for a project and when. For larger projects, it’s a great idea to create one and distribute it to your team so that everyone knows when their piece of the project needs to be finalized.
Gantt charts have been around for a very long time — in fact, they’ve been used for over 100 years. Gantt charts created and used by Henry Gantt (1861–1919), an American mechanical engineer and management consultant. He introduced the concept around 1910–1915 as a way to visually map out project schedules and track progress over time.
Even though Gantt charts are named after Henry Gantt, the first version was actually created by a Polish engineer named Karol Adamiecki back in the 1890s. It wasn’t until about 15 years later that Henry Gantt came up with his own version, which ended up gaining traction in the U.S.
Henry primarily used these charts to keep track of manufacturing and large-scale construction projects, as well as to coordinate military production and logistics during World War I, when effective project management was critical and there was no room for error or delay.
Over time, he advocated for the Gantt chart to be adopted across other industries to improve scheduling, task management, and resource tracking in complex projects.
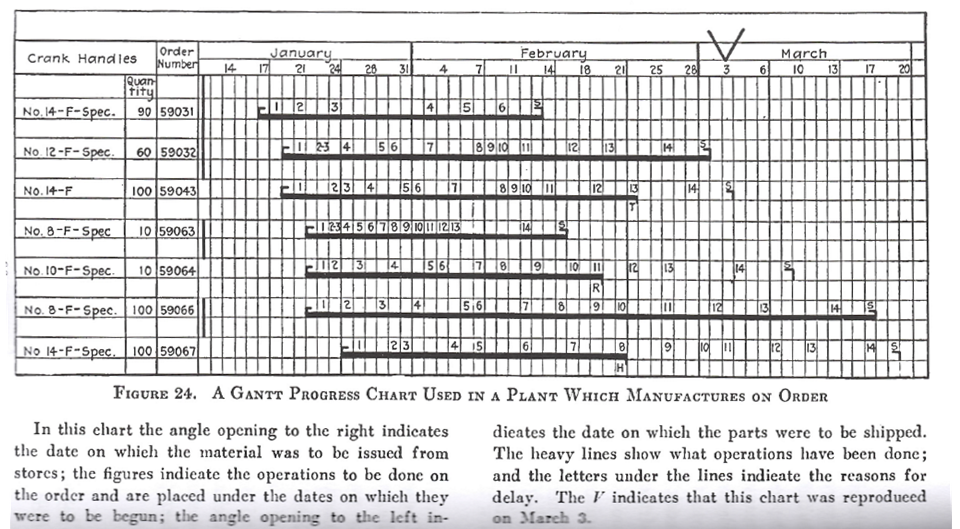
From “The Gantt Chart, A Working Tool of Management” by Wallace Clark (1922)| Source
Eventually, Gantt charts became a staple in project management — both locally and globally. Today, they’re used across industries from software development to marketing to help teams manage deadlines and easily visualize project workflows.
As great as a Gantt chart is for project management, it still comes with a few pros and cons. Below, we’ll explore the most common ones you might encounter to help you decide whether a Gantt chart is the right fit — or if an alternative might work better.
| Pros | Cons |
| Provides a clear visual timeline of tasks and deadlines. | Can become cluttered or hard to read in complex, large-scale projects. |
| Helps track dependencies between tasks to avoid delays. | Requires frequent updates to stay accurate and useful. |
| Improves team communication and coordination by showing who’s responsible for what. | May require training or experience to interpret correctly. |
| Great for setting expectations and keeping stakeholders aligned. | Not ideal for projects with flexible or shifting timelines. |
| Useful for monitoring progress and identifying bottlenecks early. | Can oversimplify task complexity or overlap if not used carefully. |
A Gantt chart isn’t a very complex project management tool. In fact, there are just a few moving parts you need to have to visualize your project:
White it's important that your Gantt chart has all this element you should also take into account the size of the document hosting it. The MCAA Research Management Working Group shares this best practice for other project managers or companies:
"A project plan schedule should be able to fit on 1 A4 (landscape allowed) so that all the project stakeholders can see with a single glance when and how long something is going to take. "
This isn’t just about making the Gantt chart accessible and easy to read — it also helps you stay focused on what can realistically fit within that A1 sheet or dimension. If the project is on a much larger scale, you can use a dashboard instead for a more extended view.
If you’re looking to create a Gantt chart, there are a couple of different ways you can do it: Create a basic Gantt chart in Google Sheets or Excel, or design a professional, visually appealing Gantt chart with Visme's Gantt Chart Maker.
If you want to create a quick Gantt chart for reference in Google Sheets, start by gathering up some of the items we listed above that you’ll need for your Gantt chart. For this one, you’ll just need to know what the tasks are and the start/end date for each.
Then, you’ll input those into three columns, like we see below:

From there, you’ll need to translate that data into numbers. Create a separate Start Date column with the function =int(B2) - int($B$2). Create a Duration column by subtracting the original end date and start date with the function =C2-B2.
Those are the numbers you’ll use to create your Gantt chart. Highlight the new columns with Task, Start Date and Duration, then go to Insert > Chart to build your new chart.
Customize your chart by making it a stacked horizontal bar chart. Then, head to the Series section of the Customize tab and change the Start Date series (which will likely automatically be blue) to white. So all that’s left is the visual of the duration of each task, perfecting your visual Gantt chart.
However, like we mentioned, it’s a very rudimentary Gantt chart. If you’re looking for something that looks a little more professional (but still doesn’t take a lot of time), you’ll want to use Visme.
Visme can be used to create many different types of visual content, from presentations and documents to charts, dashboards and social media content. A Gantt chart is just one of the many content types you’re able to build—either from scratch or from a professionally designed template.
While you can always start from scratch, customizing a pre-made template can make the process much quicker—especially because Visme allows businesses to create a brand kit that makes it easy to apply your own brand colors and fonts.
Search through our Gantt chart templates to find one that looks similar to your needs—or that you just like. Remember, you can customize every single piece of the template; it’s just a great starting point.
Now, you’ll need all of the information we mentioned earlier:
You’ll be able to add details to each task, color code based on time frame or task owner, and include any other information you’d like within your Gantt chart design.
On the left side of your Gantt chart, input each of the tasks that need to be completed for your project, like we see in this template below:
Put them in the order they need to be completed, from top to bottom.
At the top of your Gantt chart, you’ll need to switch the dates or length of time to fit your project. Then you’ll need to adjust the timeline for each task.
Your timeline will consist of small shapes that you can easily adjust based on how long each of your tasks needs to take. Simply click on each side of the rectangle and drag it to the point.

Resize these based on the timeframe that each of your tasks will take. Some may overlap if there are no task dependencies, and others will have to start once another task is completed. To save time you can also use the AI Resize Tool to instantly resize your timeline for various formats you might have to share with internal or external stakeholders.
Once you’ve input your tasks and adjusted the timeline to match your start and end dates, it’s time to color code your Gantt chart. You can color code it based on the project phase, the month each task is completed, or the team/team member assigned to each task.
For example, this template uses a different color for each phase of the project:
And this template color codes based on who’s assigned to each task:
The last step is to download your Gantt chart—either as a PNG or PDF file—and send it to your team for their reference.

Another option is to create an interactive Gantt chart that allows viewers to click on or hover over pieces of the timeline to learn more about each task. If that’s the route you go, you can publish the Gantt chart and copy a shareable link you can send to each of your team members.
Ready to create your Gantt chart? Here are 15 Gantt chart templates that are perfect to customize for your next project.
Want to keep your day-to-day projects organized? Consider customizing this daily project Gantt chart template to help you break down big tasks and make them more manageable.
If you have a more in-depth project that requires the help of a lot of people, consider creating an individual Gantt chart for each phase of the project, like we see with this template. You can easily color code based on each person’s task and replicate the chart for each individual phase.
This template switches up the way you’ll edit your timeline slightly, as it’s been built with a table. With this, you’ll simply recolor each of the table cells based on the task duration rather than dragging a shape to a different length.
This template presents a slightly more unconventional Gantt chart that doesn’t differ in length based on the duration of each task. But instead, it puts the duration on the colored segment. This is useful if you have some tasks that will take much longer than others, but you still need to fit them all on the same chart.
If you have a big launch or testing day coming up, consider using this hourly Gantt chart template to help organize your day and make sure you don’t forget any major steps.
With this Gantt chart, we’ve also included a section for completion. Have your team update this column at the end of each day so that you’re able to keep an eye on how far along each person is on their task.
With a template like this, you can easily update the task owner of each task or phase by inputting their headshot. This makes it clear who is in charge of what part of the project.
As you see in its name, this is a very simple Gantt chart template. It can be fully customized to match your brand fonts and colors as well as to fit your tasks, project and timeline.
This promotional campaign Gantt chart template is perfect for a three-week project that needs a bit of oversight. Easily replace the placeholder content with your own tasks and timeline for a seamless project management tool.
This template presents another option for using a table rather than shapes to visualize your timeline. Easily customize this based on the number of weeks you expect your project to take.
This template provides you with a way to input even more information about each of your tasks so that your team knows exactly what you expect from them.
Break your Gantt chart up into phases, like we see here. We’ve got marketing tasks versus development tasks. This template is perfect for agile sprints that you’re looking to visualize.
This template showcases yet another great way to color code your chart based on who’s in charge of each task. This type of organization makes sure that no one is unsure of who needs to be in charge of which piece of the project.
Gantt charts can even be used for visualizing personal projects, like a wedding. If you need to visualize a timeline for an event, this is the perfect template for you.
This template doesn’t have any current color coding, making it the perfect canvas for your own customization. Adjust the time frame to days or months, or keep it at weeks. Insert your own tasks, adjust the timeline and share with your team.
Avoid any further delays on your projects with a Gantt chart that visualizes start dates, end dates, dependencies and more. Create your own Gantt chart infographic today with Visme's Gantt Chart Maker and revolutionize the way your team manages projects.
Design visual brand experiences for your business whether you are a seasoned designer or a total novice.
Try Visme for free